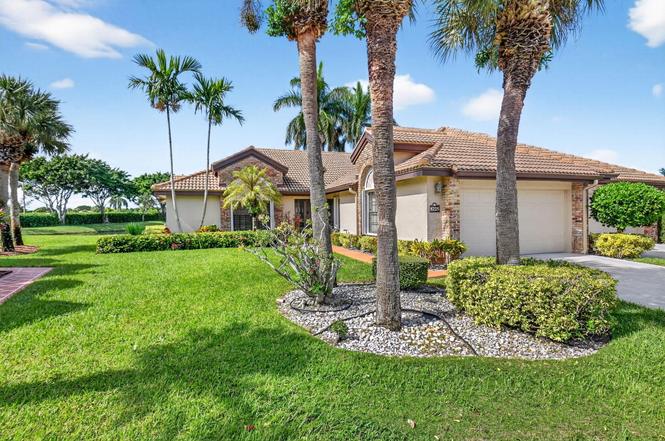
8225 Cassia Dr · Boynton Beach, FL
Flood risk 1/10 · Minimal
- FEMA flood zone
- X (unshaded)
- Chance of flooding over 30 yrs
- 0.0%
- Est. flood insurance / yr
- $507 – $1,088
Fire risk 1/10 · Minimal
- Est. fire insurance / yr
- $947 – $1,759
Heat risk 9/10 · Severe
- Hot days now (above 106°F)
- 7 days/yr
- Hot days in 30 yrs
- 26 days/yr
Wind risk 10/10 · Severe
- Chance of severe wind over 30 yrs
- 99.0%
Air-quality risk 2/10 · Minimal
- Unhealthy air days now
- 0 days/yr
- Unhealthy air days in 30 yrs
- 2 days/yr
Risk factors via First Street. Map © Google.
Why this score? — see what drove the B+ grade
The composite is a weighted blend of 9 inputs, each scored 0–100. Each bar is that input's sub-score; the figure is the points it added to the 100-point composite (weight × sub-score).
- Cash flow +29.6/30.0
- 1% rule +10.0/10.0
- DSCR +10.0/10.0
- ARV discount +7.5/15.0
- Appreciation +5.1/10.0
- Schools +4.3/10.0
- Livability +3.6/5.0
- Rent growth +2.5/5.0
- Condition / age +2.5/5.0
$219,999
🖨 Deal sheet 📄 Offer letter ✓ Due diligence
Listing remarks
Charming 3 bedroom 2 bath villa on a quiet cul-de-sac. Stunning views of the lake and golf course views overlooking the fifth green. Thoughtfully maintained and move-in ready. This home features a new roof (2022), AC (2025), newer stainless steel appliances and granite countertops that beautifully complement this open spacious kitchen. Diagonal tile flooring flows through the main living areas, creating a bright and open feel, while the living room- dining room and lanai offer space for entertaining. Step outside to enjoy professional landscaped grounds and serene golf course and lake scenery. Complete with accordion shutters for full storm protection for peace of mind. Aberdeen is a mandat
Key facts
- Accordion shutters
- Golf course access
- Granite countertops
Tags
Property features AI
Finance
- Other: Association fee covers cable TV, grounds maintenance, and common areas
- Financial info: Pets allowed (breed restrictions and number limits); Community of 152 units
- HOA & community: Has association (Aberdeen Property Owners Association); Monthly HOA fee; Community amenities: clubhouse, fitness center, pool, spa/hot tub, tennis courts, pickleball courts, bocce ball, putting green, golf course, game room, community room, cafe/restaurant, library, internet included, manager on site
Exterior
- Parking: Attached 2-car garage; 2 covered parking spaces
- Security: Security patrol
- Utilities: Public water; Public sewer; Three-phase electric; Cable available
- Home design: Villa; Single-story; North-facing
- Construction: CBS construction; Spanish tile roof
- Exterior features: Waterfront; Entry level living area
Interior
- Kitchen: Dishwasher; Electric range; Microwave; Refrigerator; Disposal; Electric water heater
- Bedrooms: 3 bedrooms on the main level
- Flooring: Carpet; Ceramic tile; Vinyl
- Bathrooms: 2 full bathrooms (main level)
- Heating & cooling: Central electric heating; Ceiling fan(s) for cooling
- Interior features: High ceilings; Walk-in closet(s); Custom mirrors; Roman tub; Blinds
- Laundry & utility: Laundry area in garage
Neighborhood map
What this means for you Summary
Snapshot
- This is a 3-bed/2.0-bath townhouse listed at $220k.
Deal economics
- At list price, monthly cash flow is $794 ($10k/yr) — positive.
- The deal already cash-flows at list — no discount required.
- Meets the 1% rule at list price ($4k rent vs $220k).
- Recommended offer: $194k (12.0% below list) — sets the bar for market timing.
- Cap rate 10.6% vs local median 4.3% in Boynton Beach — top-decile yield for the area; either an underpriced asset or a hidden risk that comps aren't pricing in. Stress-test before assuming the spread holds.
Location & tenants
- Location reads 72/100 on livability (#351 in FL) — a middle-class / working-renter tenant base. Strengths: housing A+, health & safety B+, cost of living B; Watch: amenities D+, crime D-, commute F.
- Palm Beach (suburban): math 46% / reading 53% proficiency, ranked #34 of 73 in FL (top 47%) — families likely to look elsewhere, expect single-tenant / working-renter base with shorter leases.
- Zoned schools: Crystal Lakes Elementary School (math 55% / reading 64%, grade B-, #690 of 2,144 statewide, top 34%, 788 students, 37% FRL); Christa Mcauliffe Middle School (math 63% / reading 63%, grade B+, #111 of 571 statewide, top 20%, 1,387 students, 35% FRL); Park Vista Community High School (math 43% / reading 64%, grade C-, #146 of 667 statewide, top 22%, 3,191 students, 28% FRL) — zoned schools average 34% FRL vs 52% district-wide (18 pts lower); this property's tenant base skews higher-income than the district average.
- Market conditions: 169 active listings in the ZIP; 37 comparable units currently listed for rent nearby; rentals at typical pace (median 19d on market — plan ~3-4 weeks tenant-placement turnaround); 3,974 units permitted in Palm Beach County in 2024 (1,012 in 5+ unit buildings).
Forward outlook
- In year one you build about $2k of equity ($2k loan paydown + $436 appreciation (0.2% local appreciation)).
- Palm Beach County population projected at +30% by 2050 — long-run rental-demand tailwind backs the buy-and-hold thesis.
- At projected returns (0.2% appreciation + 3.0% rent growth), your $62k cash investment doubles in ~5 years — after that, you're playing with house money.
Negotiation context
- It's been on market 242 days — a 12% lower offer ($194k) is reasonable based on typical stale-listing flexibility.
Risks & watch-outs
- Climate carrying-cost: severe wind risk, 99% chance of damaging wind over 30y; extreme-heat days projected 7→26/yr by 2055 (HVAC capex compounding) — expect insurance premiums to compound above CPI over the hold.
Questions for the listing agent
- It's been on market 242 days. Have you received any prior offers? Is the seller open to a 12% concession, seller financing, or rate buy-down credit?
- What does the HOA fee cover, when was the last increase, and are there any pending special assessments or reserve-fund shortfalls?
- Why hasn't it sold? Are there any deal-killer items the seller is aware of (foundation, flood, title, zoning, code violations)?
- Is there a deadline driving the sale (1031 exchange, divorce, estate, relocation)? That informs how much negotiation room exists.
- Crime grade is D in this area — have there been break-ins, vandalism, or insurance claims at this property in the last 3 years? What carrier currently insures it and at what premium?
- What's the average days-on-market for RENTAL listings here right now (not sales)? A rising rental-DOM trend means longer vacancies and softer asking-rent achievability than the comps imply.
- What's the recent tenant-quality profile in this submarket — average credit score on applications, eviction rate, late-payment / NSF rate, and stable-employment percentage? A property-management company in the area should have these aggregated.
- How much new for-sale + rental construction is in the pipeline within 1–3 miles? Heavy new supply typically softens prices + rents 12–24 months out; constrained supply supports both.
Investment metrics
- 1% rule
- 1.62% ✓
- Cap rate
- 10.62%
- Cash-on-cash
- 15.47%
- DSCR
- 1.69
- GRM
- 5.1
CMA / ARV
No comps found within radius.
Projected returns pro-forma
0.2% appreciation · 3.0% rent growth · sell at horizon
- IRR
- 15.5%
- Equity multiple
- 1.76×
- Total profit
- $46,565
- Equity at exit
- $66,069
- IRR
- 19.9%
- Equity multiple
- 3.25×
- Total profit
- $138,358
- Equity at exit
- $81,185
Cash invested: $61,600 (down + closing). Projections, not guarantees.
Landlord ↔ Tenant lean methodology
- Overall (STATE)
- 87 Strongly Landlord-Friendly
- State Florida
- 87 Strongly Landlord-Friendly · R+3
- County
- — inherits STATE
- City
- — inherits STATE
ZIP-level market 33472
- Home prices YoY
- 0.1%
- Active inventory
- 169
- Price-to-rent
- 5.1×
Monthly cashflow live
- Estimated rent
- $3,567 high interval (Pro) →
- Mortgage (P&I)
- −$1,154
- Tax from tax record
- −$101 /mo · $1,214/yr
- Insurance
- −$92
- HOA
- −$677
- Vacancy / Maint / Mgmt
- −$749
- Net cashflow
- $794
Break-even live
UW: 25.0% down · 7.5% · 30yr · 1.5% tax · 5.0% vac · 8.0% maint · 8.0% mgmt
Financing live
Cash to close
- Down payment
- $55,000
- Closing costs
- $6,600
- Reserves months
- —
- Total cash needed
- —
Loan-product check · same deal, 3 products live
Conventional
25% down · 7.5% · 30yr
- Down + closing
- —
- Monthly P&I
- —
- Monthly cashflow
- —
- DSCR
- —
- Eligible?
- —
Personal DTI + credit; lowest rate.
DSCR
20% down · 8.5% · 30yr
- Down + closing
- —
- Monthly P&I
- —
- Monthly cashflow
- —
- DSCR
- —
- Eligible?
- —
No personal income docs; deal must DSCR.
Hard money
10% down · 12.0% · 12mo
- Down + closing
- —
- Monthly P&I
- —
- Monthly cashflow
- —
- DSCR
- —
- Eligible?
- —
Short-term bridge; refi at stabilization.
Rent comps 37 comps
| Address | Beds | Baths | Sqft | Rent | $/sqft | DOM | Units | Dist |
|---|---|---|---|---|---|---|---|---|
| 7418 Wescott Ter Lake Worth, FL | 3.0 | 2.5 | 2170 | $3,250 | $1.50 | 7d | 1 | 0.35mi |
| 7705 Thornlee Dr Lake Worth, FL | 4.0 | 2.5 | 2382 | $3,500 | $1.47 | 2d | 1 | 0.48mi |
| 8082 Aberdeen Dr #102 Boynton Beach, FL | 2.0 | 2.0 | 1619 | $8,500 | $5.25 | 24d | 1 | 0.57mi |
| 7816 Bridlington Dr Boynton Beach, FL | 3.0 | 3.0 | 2330 | $12,000 | $5.15 | 24d | 1 | 0.66mi |
| 7821 Dorchester Rd Boynton Beach, FL | 3.0 | 3.0 | 2325 | $11,000 | $4.73 | 24d | 1 | 0.70mi |
| 7725 Rockford Rd Boynton Beach, FL | 3.0 | 2.5 | 2249 | $10,000 | $4.45 | 3d | 1 | 0.72mi |
| 8884 Shoal Creek Ln Boynton Beach, FL | 3.0 | 2.0 | 1936 | $4,900 | $2.53 | 24d | 1 | 0.74mi |
| 8884 Shoal Creek Ln Boynton Beach, FL | 3.0 | 2.0 | 1936 | $5,000 | $2.58 | 10d | 1 | 0.74mi |
| 7975 Rockford Rd Boynton Beach, FL | 2.0 | 2.0 | 1720 | $3,700 | $2.15 | 24d | 1 | 0.75mi |
| 6731 Southport Dr Boynton Beach, FL | 3.0 | 2.0 | 1727 | $3,600 | $2.08 | 24d | 1 | 0.81mi |
| 7936 Rockford Rd Boynton Beach, FL | 3.0 | 2.0 | 1871 | $9,000 | $4.81 | 22d | 1 | 0.85mi |
| 7832 Rockford Rd Boynton Beach, FL | 3.0 | 2.0 | 1598 | $3,800 | $2.38 | 22d | 1 | 0.88mi |
| 7577 Caprio Dr Boynton Beach, FL | 3.0 | 2.0 | 1884 | $3,200 | $1.70 | 14d | 1 | 0.94mi |
| 7577 Caprio Dr Boynton Beach, FL | 3.0 | 2.0 | 1884 | $3,200 | $1.70 | 3d | 1 | 0.94mi |
| 8451 Siciliano St Boynton Beach, FL | 3.0 | 2.0 | 1627 | $3,200 | $1.97 | 12d | 1 | 0.96mi |
| 8481 Siciliano St Unit 8481 Boynton Beach, FL | 3.0 | 2.0 | 1774 | $3,650 | $2.06 | 24d | 1 | 0.99mi |
| 7275 Summer Tree Dr Boynton Beach, FL | 2.0 | 2.0 | 1722 | $4,300 | $2.50 | 24d | 1 | 1.05mi |
| 7192 Summer Tree Dr Boynton Beach, FL | 2.0 | 2.0 | 1722 | $3,000 | $1.74 | 24d | 1 | 1.05mi |
| 6581 Marissa Cir Lake Worth, FL | 3.0 | 2.0 | 1414 | $3,300 | $2.33 | 18d | 1 | 1.05mi |
| 6143 Windlass Cir Boynton Beach, FL | 4.0 | 2.5 | 2245 | $4,200 | $1.87 | 18d | 1 | 1.10mi |
| 7366 Ashley Shores Cir Lake Worth, FL | 3.0 | 2.5 | 1945 | $4,200 | $2.16 | 7d | 1 | 1.10mi |
| 7218 Michigan Isle Rd Lake Worth, FL | 3.0 | 2.0 | 1656 | $3,500 | $2.11 | 15d | 1 | 1.11mi |
| 7218 Michigan Isle Rd Lake Worth, FL | 3.0 | 2.0 | 1656 | $3,500 | $2.11 | 13d | 1 | 1.11mi |
| 6836 Long Key St Lake Worth, FL | 3.0 | 2.5 | 1637 | $2,950 | $1.80 | 17d | 1 | 1.20mi |
| 7273 Burgess Dr Lake Worth, FL | 3.0 | 2.0 | 1385 | $2,630 | $1.90 | 7d | 1 | 1.20mi |
| 7142 Davit Cir Lake Worth, FL | 3.0 | 2.5 | 2050 | $3,545 | $1.73 | 17d | 1 | 1.21mi |
| 7354 Michigan Isle Rd Lake Worth, FL | 4.0 | 3.0 | 2050 | $3,295 | $1.61 | 24d | 1 | 1.21mi |
| 7600 Edisto Dr Lake Worth, FL | 3.0 | 2.5 | 1764 | $2,700 | $1.53 | 20d | 1 | 1.23mi |
| 6365 Lansdowne Cir Boynton Beach, FL | 3.0 | 2.0 | 1769 | $3,200 | $1.81 | 3d | 1 | 1.29mi |
| 7891 Sailing Shores Ter Unit 7891 Boynton Beach, FL | 3.0 | 2.0 | 2011 | $3,000 | $1.49 | 7d | 1 | 1.32mi |
| 7891 Sailing Shores Ter Boynton Beach, FL | 3.0 | 2.0 | 2011 | $3,400 | $1.69 | 16d | 1 | 1.32mi |
| 9121 Paragon Way Boynton Beach, FL | 4.0 | 2.0 | 2154 | $4,950 | $2.30 | 24d | 1 | 1.33mi |
| 9650 Harbour Lake Cir Boynton Beach, FL | 3.0 | 2.0 | 1937 | $2,975 | $1.54 | 24d | 1 | 1.40mi |
| 6974 Oak Bridge Ln Lake Worth, FL | 2.0 | 2.5 | 1310 | $2,650 | $2.02 | 15d | 1 | 1.40mi |
| 9336 Water Course Way Boynton Beach, FL | 3.0 | 2.0 | 1779 | $3,600 | $2.02 | 22d | 1 | 1.46mi |
| 9336 Water Course Way Boynton Beach, FL | 3.0 | 2.0 | 1779 | $3,600 | $2.02 | 24d | 1 | 1.46mi |
| 6880 Brook Hollow Rd Lake Worth, FL | 3.0 | 2.5 | 1428 | $2,850 | $2.00 | 24d | 1 | 1.48mi |
HOA detail
- Monthly dues
- $677 · $8,124/yr
- Likely covers
- landscaping
Listing history 14 events
-
2026-06-18days on market $219,999 Active 242 DOM
-
2026-06-17days on market $219,999 Active 241 DOM
-
2026-06-16days on market $219,999 Active 240 DOM
-
2026-06-15days on market $219,999 Active 239 DOM
-
2026-06-13days on market $219,999 Active 237 DOM
-
2026-06-09days on market $219,999 Active 233 DOM
-
2026-06-07days on market $219,999 Active 231 DOM
-
2026-06-04days on market $219,999 Active 228 DOM
-
2026-06-03days on market $219,999 Active 227 DOM
-
2026-06-01days on market $219,999 Active 225 DOM
-
2026-05-31days on market $219,999 Active 224 DOM
-
2026-04-03price $219,999
-
2026-01-26price $249,000
-
2025-10-18$260,000 Active
ⓘ Source: listings_history table (triggers on properties + properties_extension) + one-shot
backfill from property_details.listing_events for pre-trigger history.
Tax reassessment forecast FL · Resets to sale price
- Current annual tax
- $1,214 · $101/mo
- Projected year-2 tax
- $1,826 · $152/mo
- Expected delta
- +$612/yr (+$51/mo · 50.4%)
ⓘ Screening estimate from a state-policy table — verify with the county assessor before closing.
Climate risk First Street
- Flood 1/10 Low FEMA zone X (unshaded) · 0% chance over 30 yrs
- Wildfire 1/10 Low
- Heat 9/10 Extreme 7 d/yr ≥106°F today · 26 d/yr by 30 yrs out
- Wind 10/10 Extreme 99% chance of damaging wind over 30 yrs
- Air quality 2/10 Low 0 unhealthy d/yr today · 2 by 30 yrs out
Nearby sold comps map
Loading sold comps map…
Walkable amenities ~0.75 mi
Loading nearby amenities…
Taxation est. · year 1
- Rental income
- $42,801
- − Mortgage interest
- −$12,323
- − Property taxes
- −$1,214
- − Insurance
- −$1,100
- − Repairs & maintenance
- −$3,424
- − Management
- −$3,424
- − HOA
- −$8,124
- − Depreciation
- −$6,400
- Taxable income
- $6,791
- Est. tax owed @ 24.0%
- −$1,630
- After-tax cash flow
- $7,900/yr
For passive investors: Depreciation is non-cash, so a rental often shows a tax loss while cash-flowing — sheltering income. Rental losses are passive: they offset passive income freely, and up to $25,000/yr can offset ordinary (W-2) income if you actively participate and your MAGI is under $100k (phasing out to $0 by $150k); unused losses carry forward. On sale, claimed depreciation is recaptured at up to 25%, and gains may owe capital-gains tax (a 1031 exchange can defer both). Figures are a year-1 estimate at your 24.0% rate — not tax advice; consult a CPA.
Schools (NCES district)
- District
- Palm Beach
- NCES district ID
- 1201500
- Math proficiency
- 46% ▼ -16.00%
- Reading proficiency
- 53% ▼ -4.00%
- Median HH income
- $53,943
- Composite
- 42.72/100
- National rank
- #3160
- State rank
- #34 of 73 in FL
Livability — Boynton Beach
- Score
- 72/100
- State rank
- #351
- US rank
- #6098
Category grades
Schools grade is shown separately in the Schools card above.
Census & demographics
- City population
- 148,060
- Population (ZIP)
- 18,689
Population outlook (Palm Beach County) Hauer SSP2
- Today (2025)
- 1,637,487 people
- By 2030
- 1,743,255 · +6.5%
- By 2040
- 1,948,712 · +19.0%
- By 2050
- 2,132,979 · +30.3%
- By 2075
- 2,530,027 · +54.5%
- By 2100
- 2,706,979 · +65.3%
Race, ethnicity, and origin ACS 2023
- Neighborhood character
- Diverse neighborhood (Simpson 0.56)
- Race & ethnicity
- White 63% Hispanic / Latino 18% Two or more races 14% Black 10% Asian 4%
- Hispanic origin (detail)
- Mexican 2% Puerto Rican 2% Cuban 7%
- Common ancestry
- Romanian 5% Scotch-Irish 4% Hispanic 3%
- Foreign-born
- 24% · Canada, China, Jamaica
- Languages at home
- 77% English-only · Spanish 11% Other Indo-European 4% French/Haitian/Cajun 3%
Political lean MEDSL · Palm Beach
- 2024 margin
- Toss-up / Even · D 50.0% · R 49.2%
- 2008→2024 swing
- -22.1pp toward R · 2008: 22.9pp · 2024: 0.8pp
- All cycles
- 2024: D+0.8 2020: D+12.8 2016: D+15.3 2012: D+17.0 2008: D+22.9
Not yet ingested
- Civics
- —
Market trends
- HPI YoY
- ▲ 0.20%
- Current HPI
- 268.1142
- Rent YoY
- —
- Metro
- —
- State GDP YoY
- ▲ 3.28%
- F500 in state
- 36
Industry mix (Fortune 500 HQ in FL)
| Industry | F500 HQs | Revenue |
|---|---|---|
| Industrial Technology | 2 | $29B |
|
||
| Insurance | 2 | $17B |
|
||
| Retail | 1 | $60B |
|
||
| Technology Distribution | 1 | $58B |
|
||
| Homebuilding | 1 | $35B |
|
||
| Technology Manufacturing | 1 | $35B |
|
||
Price history
-15.4% since first listed3 events — show timeline
- 2026-04-03 Price Changed $219,999 Beaches MLS
- 2026-01-26 Price Changed $249,000 Beaches MLS
- 2025-10-18 Listed $260,000 Beaches MLS
Property tax history
-0.2%/yrLatest (2025): $1,214 · +3.9% YoY. Source: county tax records.
Cash-flow waterfall
monthlySold comps — $/sqft
last 12 mo · ≤1 miLoading sold comps…