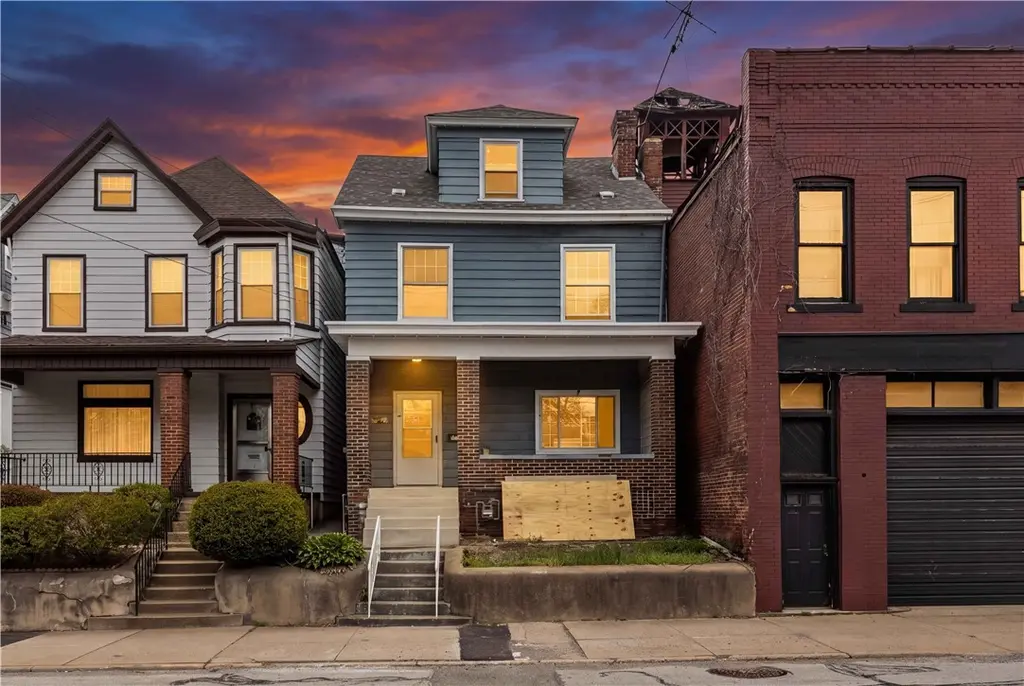
2008 Main St · Sharpsburg, PA
Flood risk 10/10 · Severe
- FEMA flood zone
- X (unshaded)
- Chance of flooding over 30 yrs
- 0.99%
- Est. flood insurance / yr
- $473 – $860
Fire risk 1/10 · Minimal
- Est. fire insurance / yr
- $511 – $949
Heat risk 4/10 · Minor
- Hot days now (above 98°F)
- 8 days/yr
- Hot days in 30 yrs
- 19 days/yr
Wind risk 2/10 · Minimal
- Chance of severe wind over 30 yrs
- —
Air-quality risk 4/10 · Minor
- Unhealthy air days now
- 5 days/yr
- Unhealthy air days in 30 yrs
- 7 days/yr
Risk factors via First Street. Map © Google.
Why this score? — see what drove the D+ grade
The composite is a weighted blend of 9 inputs, each scored 0–100. Each bar is that input's sub-score; the figure is the points it added to the 100-point composite (weight × sub-score).
- Cash flow +15.9/30.0
- ARV discount +7.5/15.0
- Schools +6.9/10.0
- DSCR +4.9/10.0
- Livability +4.0/5.0
- Rent growth +3.8/5.0
- 1% rule +3.6/10.0
- Condition / age +2.5/5.0
- Appreciation +0.0/10.0
$268,900
🖨 Deal sheet (PDF) 📄 Offer letter ✓ Due diligence
Listing remarks MLS
LOTS OF SPACE/4 BDRMS/ 2 FULL BTHS/UPDATED BATHS, ROOF & WNDOWS/VERY EASY TO SHOW!/ GREAT FOR 1ST TIME BUYERS
Key facts
- Rear parking
- Front porch
- 2,408 sq ft lot
Tags
Property features AI
Exterior
- Parking: Off-street parking for 2 vehicles
- Utilities: Public water; Public sewer
- Home design: Two-story home; Resale property; Asphalt roof
- Construction: Frame construction; Home warranty included
- Exterior features: Public transportation nearby
Interior
- Kitchen: Refrigerator; Stove; Dishwasher; Some gas appliances
- Bedrooms: Three bedrooms (two located on the upper level)
- Flooring: Laminate flooring; Carpet
- Bathrooms: Two full bathrooms
- Heating & cooling: Forced air heating (gas); Central air conditioning
- Interior features: Full basement with walk-up access; One fireplace located in the living/family room; Total of 7 rooms
Neighborhood map
What this means for you Summary
Snapshot
- This is a 3-bed/1.0-bath single-family listed at $269k.
Deal economics
- At list price, monthly cash flow is $70 ($842/yr) — positive.
- The deal already cash-flows at list — no discount required.
- To meet the 1% rule (rent ≥ 1% of price), the offer needs to be $232k (13.8% below list).
- Recommended offer: $232k (13.8% below list) — sets the bar for 1% rule.
- Cap rate 6.9% vs local median 9.5% in Sharpsburg — below-typical yield; the buyer is paying a premium for something (appreciation thesis, condition, location) that the cap rate doesn't capture.
Location & tenants
- Location reads 79/100 on livability (#248 in PA, #2,145 nationally) — a middle-class / working-renter tenant base. Strengths: commute A+, cost of living A+, housing A+; Watch: amenities D, schools D-, employment D-.
- Fox Chapel Area SD (suburban): math 73% / reading 85% proficiency, ranked #7 of 539 in PA (top 1%) — strong family-tenant draw, lease renewals of 3-5y typical; only 16% free/reduced lunch — higher-income household profile.
- Market conditions: Rents rising fast (+5.2%/yr); 56 active listings in the ZIP; 6 comparable units currently listed for rent nearby; rentals at typical pace (median 20d on market — plan ~3-4 weeks tenant-placement turnaround); solid renter incomes; 2,996 units permitted in Allegheny County in 2024 (1,588 in 5+ unit buildings).
Forward outlook
- Local home prices are declining (-3.0%/yr); year-one equity from $2k of loan paydown is wiped out by about $8k of value loss. Plan a longer hold.
Negotiation context
- It's been on market 49 days — a 3% lower offer ($261k) is reasonable based on typical stale-listing flexibility.
- 2 sale attempts since 27y ago with the ask held roughly flat each time — persistent listings suggest the price (not the market) is what's stuck; bring a comps-based counter.
- Current owner paid $34k; list at $269k implies a 703% gain — meaningful room to come down on a strong offer.
Risks & watch-outs
- Watch-outs: flood insurance adds $56/mo; built in 1920 — expect roof / HVAC / electrical / plumbing capex.
- Climate carrying-cost: severe flood risk — expect insurance premiums to compound above CPI over the hold.
Questions for the listing agent
- It's been on market 49 days. Have you received any prior offers? Is the seller open to a 14% concession, seller financing, or rate buy-down credit?
- Built in 1920 — when were the roof, HVAC, electrical panel, plumbing, and water heater last replaced?
- What's the actual annual flood-insurance premium (NFIP or private), and is the property in a SFHA with mandatory coverage?
- Is there a deadline driving the sale (1031 exchange, divorce, estate, relocation)? That informs how much negotiation room exists.
- Schools are D-rated, which usually means shorter tenancies and higher turnover. Who's the typical renter profile here, and what's been the actual vacancy rate?
- The area grade is low — what's the realistic commute time and amenity access for the typical tenant pool here? Any planned neighborhood developments (good or bad) we should know about?
- What's the average days-on-market for RENTAL listings here right now (not sales)? A rising rental-DOM trend means longer vacancies and softer asking-rent achievability than the comps imply.
- What's the recent tenant-quality profile in this submarket — average credit score on applications, eviction rate, late-payment / NSF rate, and stable-employment percentage? A property-management company in the area should have these aggregated.
- How much new for-sale + rental construction is in the pipeline within 1–3 miles? Heavy new supply typically softens prices + rents 12–24 months out; constrained supply supports both.
Investment metrics
- 1% rule
- 0.86% ✗
- Cap rate
- 6.85%
- Cash-on-cash
- 2.00%
- DSCR
- 1.09
- GRM
- 9.7
CMA / ARV
- ARV (median comp)
- $163,508
- List price
- $268,900
- Delta
- 64.46%
- Verdict
- OVERPRICED
- Comps
- 20 within 1.0 mi
Show comp detail 12 sales within ~0.75 mi
| Address | Dist | Beds/Ba | Sqft | Sold | Price | $/sf | Match |
|---|---|---|---|---|---|---|---|
| 211 4th St | 0.67mi | 3/1.5 | 2,063 (+1%) | 4mo | $335,000 | $162 | 61 |
| 29 Kittanning Pike | 0.57mi | 3/1.5 | 1,934 (-5%) | 8mo | $205,000 | $106 | 56 |
| 115 Fifth St | 0.57mi | 3/2.5 | 1,920 (-6%) | 2mo | $606,000 | $316 | 56 |
| 1218 Penn St | 0.74mi | 3/1.5 | 2,082 (+2%) | 8mo | $128,000 | $61 | 54 |
| 123 W 8th St | 0.62mi | 4/3.0 (+1) | 1,936 (-5%) | 1mo | $560,000 | $289 | 49 |
| 214 Farmington Rd | 0.74mi | 4/3.5 (+1) | 2,028 (-0%) | 4mo | $440,000 | $217 | 46 |
| 1860 Jancey St | 0.66mi | 4/2.0 (+1) | 1,948 (-4%) | 10mo | $289,000 | $148 | 45 |
| 7218 Witherspoon St | 0.59mi | 3/2.5 | 1,809 (-11%) | 7mo | $353,000 | $195 | 42 |
| 221 13th St | 0.74mi | 4/2.0 (+1) | 2,100 (+3%) | 12mo | $170,000 | $81 | 42 |
| 123 Harding Rd | 0.54mi | 3/2.0 | 1,750 (-14%) | 9mo | $125,000 | $71 | 39 |
| 212 2nd St | 0.65mi | 3/1.5 | 2,323 (+14%) | 7mo | $369,000 | $159 | 38 |
| 411 Center Ave | 0.63mi | 3/1.5 | 1,760 (-14%) | 11mo | $432,000 | $245 | 37 |
Match score weights: distance 35% · size 25% · config 20% · recency 20%. Top-matched comps best support the ARV.
Projected returns pro-forma
-3.0% appreciation · 5.24% rent growth · sell at horizon
- IRR
- -12.2%
- Equity multiple
- 0.55×
- Total profit
- $-33,794
- Equity at exit
- $40,094
- IRR
- -0.1%
- Equity multiple
- 0.99×
- Total profit
- $-845
- Equity at exit
- $23,250
Cash invested: $75,292 (down + closing). Projections, not guarantees.
Landlord ↔ Tenant lean methodology
- Overall (STATE)
- 62 Landlord-Friendly
- State Pennsylvania
- 62 Landlord-Friendly · EVEN
- County
- — inherits STATE
- City
- — inherits STATE
ZIP-level market 15215
- Rents YoY
- 5.2%
- Active inventory
- 56
- Price-to-rent
- 9.7×
Monthly cashflow live
- Estimated rent
- $2,317 high interval (Pro) →
- Mortgage (P&I)
- −$1,410
- Tax from tax record
- −$182 /mo · $2,188/yr
- Insurance
- −$112
- Flood insurance flood zone
- −$56 /mo · $666/yr
- HOA
- −$0
- Vacancy / Maint / Mgmt
- −$487
- Net cashflow
- $70
Break-even live
Sensitivity live
| Price | -10% $222 | -5% $146 | +0% $70 | +5% $-6 | +10% $-82 |
|---|---|---|---|---|---|
| Rent | -10% $-113 | -5% $-21 | +0% $70 | +5% $162 | +10% $253 |
| Rate | -1.0pp $206 | -0.5pp $139 | base $70 | +0.5pp $0 | +1.0pp $-70 |
UW: 25.0% down · 7.5% · 30yr · 1.5% tax · 5.0% vac · 8.0% maint · 8.0% mgmt
Financing live
Cash to close
- Down payment
- $67,225
- Closing costs
- $8,067
- Reserves months
- —
- Total cash needed
- —
Loan-product check · same deal, 3 products live
Conventional
25% down · 7.5% · 30yr
- Down + closing
- —
- Monthly P&I
- —
- Monthly cashflow
- —
- DSCR
- —
- Eligible?
- —
Personal DTI + credit; lowest rate.
DSCR
20% down · 8.5% · 30yr
- Down + closing
- —
- Monthly P&I
- —
- Monthly cashflow
- —
- DSCR
- —
- Eligible?
- —
No personal income docs; deal must DSCR.
Hard money
10% down · 12.0% · 12mo
- Down + closing
- —
- Monthly P&I
- —
- Monthly cashflow
- —
- DSCR
- —
- Eligible?
- —
Short-term bridge; refi at stabilization.
Rent comps 6 comps
| Address | Beds | Baths | Sqft | Rent | $/sqft | DOM | Units | Dist |
|---|---|---|---|---|---|---|---|---|
| 131 5th St Unit Na Pittsburgh, PA | 2.0 | 1.5 | 1840 | $1,800 | $0.98 | 44d | 1 | 0.61mi |
| 307 Highland Ter Pittsburgh, PA | 3.0 | 2.0 | 1450 | $4,000 | $2.76 | 5d | 1 | 0.80mi |
| 514 Guyasuta Rd Apt 7 Pittsburgh, PA | 2.0 | 2.0 | 1400 | $2,000 | $1.43 | 24d | 1 | 0.81mi |
| 212 8th St Sharpsburg, PA | 4.0 | 2.0 | 2240 | $2,100 | $0.94 | 18d | 1 | 0.98mi |
| 5700 Bunkerhill St Pittsburgh, PA | 1.0–3.0 | 1.0–2.0 | 1258 | $3,236 | $2.57 | 2d | 17 | 1.03mi |
| 6026 Sawyer St Unit NA Pittsburgh, PA | 3.0 | 2.0 | 2231 | $2,500 | $1.12 | 19d | 1 | 1.47mi |
Listing history 16 events
-
2026-06-18days on market $268,900 Active 49 DOM
-
2026-06-17days on market $268,900 Active 48 DOM
-
2026-06-16days on market $268,900 Active 47 DOM
-
2026-06-15days on market $268,900 Active 46 DOM
-
2026-06-13days on market $268,900 Active 44 DOM
-
2026-06-09days on market $268,900 Active 40 DOM
-
2026-06-08days on market $268,900 Active 39 DOM
-
2026-06-07days on market $268,900 Active 38 DOM
-
2026-06-03days on market $268,900 Active 34 DOM
-
2026-06-02days on market $268,900 Active 33 DOM
-
2026-06-01days on market $268,900 Active 32 DOM
-
2026-05-31days on market $268,900 Active 31 DOM
-
2026-04-29$268,900 Active 863-char remark
-
1999-12-03soldstatus $33,500
-
1999-12-01soldstatus $33,500 115-char remark
Show marketing remark (115 chars)
LOTS OF SPACE/4 BDRMS/ 2 FULL BTHS/UPDATED BATHS, ROOF & WNDOWS/VERY EASY TO SHOW!/ GREAT FOR 1ST TIME BUYERS
-
1999-01-26$35,900 115-char remark
Show marketing remark (115 chars)
LOTS OF SPACE/4 BDRMS/ 2 FULL BTHS/UPDATED BATHS, ROOF & WNDOWS/VERY EASY TO SHOW!/ GREAT FOR 1ST TIME BUYERS
ⓘ Source: listings_history table (triggers on properties + properties_extension) + one-shot
backfill from property_details.listing_events for pre-trigger history.
Tax reassessment forecast PA · Partial reset (capped growth)
- Current annual tax
- $2,188 · $182/mo
- Projected year-2 tax
- $3,218 · $268/mo
- Expected delta
- +$1,030/yr (+$86/mo · 47.1%)
ⓘ Screening estimate from a state-policy table — verify with the county assessor before closing.
Climate risk First Street
- Flood 10/10 Extreme FEMA zone X (unshaded) · 99% chance over 30 yrs
- Wildfire 1/10 Low
- Heat 4/10 Moderate 8 d/yr ≥98°F today · 19 d/yr by 30 yrs out
- Wind 2/10 Low
- Air quality 4/10 Moderate 5 unhealthy d/yr today · 7 by 30 yrs out
Nearby sold comps map
Loading sold comps map…
Walkable amenities ~0.75 mi
Loading nearby amenities…
Taxation est. · year 1
- Rental income
- $27,801
- − Mortgage interest
- −$15,063
- − Property taxes
- −$2,188
- − Insurance
- −$2,011
- − Repairs & maintenance
- −$2,224
- − Management
- −$2,224
- − Depreciation
- −$7,823
- Taxable loss
- −$3,732
- Est. tax savings @ 24.0%
- +$896
- After-tax cash flow
- $1,737/yr
For passive investors: Depreciation is non-cash, so a rental often shows a tax loss while cash-flowing — sheltering income. Rental losses are passive: they offset passive income freely, and up to $25,000/yr can offset ordinary (W-2) income if you actively participate and your MAGI is under $100k (phasing out to $0 by $150k); unused losses carry forward. On sale, claimed depreciation is recaptured at up to 25%, and gains may owe capital-gains tax (a 1031 exchange can defer both). Figures are a year-1 estimate at your 24.0% rate — not tax advice; consult a CPA.
Schools (NCES district)
- District
- Fox Chapel Area SD
- NCES district ID
- 4210070
- Math proficiency
- 73% ▼ -5.00%
- Reading proficiency
- 85% ▼ -2.00%
- Median HH income
- $73,326
- Composite
- 69.02/100
- National rank
- #324
- State rank
- #7 of 539 in PA
Livability — Sharpsburg
- Score
- 79/100
- State rank
- #248
- US rank
- #2145
Category grades
Schools grade is shown separately in the Schools card above.
Census & demographics
- Census place
- Sharpsburg, PA
- County
- Allegheny County · 1,022,028 people
- Metro
- Pittsburgh, PA
- Population (ZIP)
- 11,907
- Household income
- $99,071
- Rent vs Own
- Severe rent burden
- 311.0
Population outlook (Allegheny County) Hauer SSP2
- Today (2025)
- 1,250,282 people
- By 2030
- 1,256,482 · +0.5%
- By 2040
- 1,256,318 · +0.5%
- By 2050
- 1,244,169 · -0.5%
- By 2075
- 1,197,693 · -4.2%
- By 2100
- 1,093,187 · -12.6%
Race, ethnicity, and origin ACS 2023
- Neighborhood character
- Predominantly White (86%)
- Race & ethnicity
- White 86% Asian 5% Two or more races 4% Black 4% Hispanic / Latino 3%
- Common ancestry
- Romanian 9% Lithuanian 3% Scotch-Irish 2%
- Foreign-born
- 7% · China, South Korea, Canada
- Languages at home
- 91% English-only · Spanish 2% Chinese 2% Other Indo-European 2%
Political lean MEDSL · Allegheny
- 2024 margin
- Strong D (+20.3) · D 59.7% · R 39.4%
- 2008→2024 swing
- +4.8pp toward D · 2008: 15.5pp · 2024: 20.3pp
- All cycles
- 2024: D+20.3 2020: D+20.4 2016: D+16.4 2012: D+14.4 2008: D+15.5
Not yet ingested
- Civics
- —
Market trends
- HPI YoY
- ▼ -171.68%
- Current HPI
- 284.7359
- Rent YoY
- ▲ 5.24%
- Metro
- Pittsburgh, PA
- State GDP YoY
- ▲ 1.68%
- F500 in state
- 34
Industry mix (Fortune 500 HQ in PA)
| Industry | F500 HQs | Revenue |
|---|---|---|
| Healthcare | 2 | $309B |
|
||
| Insurance | 2 | $27B |
|
||
| Telecommunications / Media | 1 | $124B |
|
||
| Industrial Distribution | 1 | $22B |
|
||
| Financial Services | 1 | $20B |
|
||
| Chemicals / Materials | 1 | $18B |
|
||
Price history
+649.0% since first listed4 events — show timeline
- 2026-04-29 Listed $268,900 West Penn MLS
- 1999-12-03 Sold (Public Records) $33,500 Public Records
- 1999-12-01 Sold (MLS) $33,500 West Penn MLS
- 1999-01-26 Listed $35,900 West Penn MLS
Property tax history
+4.7%/yrLatest (2026): $2,188 · +1.3% YoY. Source: county tax records.
Cash-flow waterfall
monthlySold comps — $/sqft
last 12 mo · ≤1 miLoading sold comps…