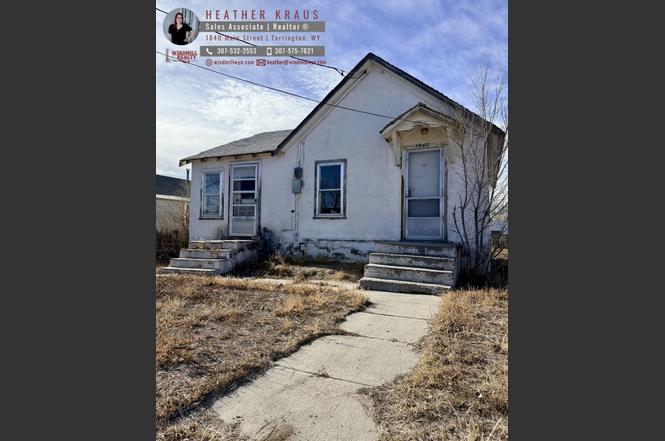
1340 W C St · Torrington, WY
Flood risk 1/10 · Minimal
- FEMA flood zone
- X (unshaded)
- Chance of flooding over 30 yrs
- 0.0%
- Est. flood insurance / yr
- $473 – $860
Fire risk 2/10 · Minimal
- Est. fire insurance / yr
- $564 – $1,046
Heat risk 3/10 · Minor
- Hot days now (above 94°F)
- 7 days/yr
- Hot days in 30 yrs
- 20 days/yr
Wind risk 1/10 · Minimal
- Chance of severe wind over 30 yrs
- —
Air-quality risk 2/10 · Minimal
- Unhealthy air days now
- 1 days/yr
- Unhealthy air days in 30 yrs
- 2 days/yr
Risk factors via First Street. Map © Google.
Why this score? — see what drove the B grade
The composite is a weighted blend of 9 inputs, each scored 0–100. Each bar is that input's sub-score; the figure is the points it added to the 100-point composite (weight × sub-score).
- Cash flow +30.0/30.0
- 1% rule +10.0/10.0
- DSCR +10.0/10.0
- ARV discount +7.5/15.0
- Schools +4.3/10.0
- Livability +3.4/5.0
- Rent growth +2.5/5.0
- Condition / age +2.5/5.0
- Appreciation +0.0/10.0
$44,900
🖨 Deal sheet 📄 Offer letter ✓ Due diligence
Key facts
- Centrally located
- Room to build a shop
- Larger lot
Tags
Property features AI
Exterior
- Parking: No garage
- Utilities: Public water; Public sewer
- Home design: Single family residence; Residential property
- Construction: Stucco construction; Asphalt roof
- Exterior features: 0.12-acre lot
Interior
- Interior features: Partial basement
- Laundry & utility: Laundry in basement
Neighborhood map
What this means for you Summary
Snapshot
- This is a 2-bed/1.0-bath single-family listed at $45k.
Deal economics
- At list price, monthly cash flow is $372 ($4k/yr) — positive.
- The deal already cash-flows at list — no discount required.
- Meets the 1% rule at list price ($807 rent vs $45k).
- Recommended offer: $40k (12.0% below list) — sets the bar for market timing.
- Cap rate 16.2% vs local median 3.7% in Torrington — top-decile yield for the area; either an underpriced asset or a hidden risk that comps aren't pricing in. Stress-test before assuming the spread holds.
Location & tenants
- Location reads 67/100 on livability (#66 in WY) — a middle-class / working-renter tenant base. Strengths: cost of living A+, housing A+; Watch: schools C-, health & safety C-, crime D+.
- Goshen County School District #1 (town): math 45% / reading 57% proficiency, ranked #28 of 41 in WY (top 68%) — acceptable for families but not a draw, mixed tenant base, ~2y average lease.
- Market conditions: 93 active listings in the ZIP; 3 units permitted in Goshen County in 2024 (0 in 5+ unit buildings).
- This rent is only 16% of the median local income ($61k/yr) — well below the 30% rent-burden line; pricing power to push rent on renewal without tenant pushback.
Forward outlook
- Local home prices are declining (-3.0%/yr); year-one equity from $310 of loan paydown is wiped out by about $1k of value loss. Plan a longer hold.
- Goshen County population projected at +12% by 2050 — modest demand growth; plan on rents tracking national, not racing it.
- At projected returns (-3.0% appreciation + 3.0% rent growth), your $13k cash investment doubles in ~4 years — after that, you're playing with house money.
Negotiation context
- It's been on market 162 days — a 12% lower offer ($40k) is reasonable based on typical stale-listing flexibility.
- 3 sale attempts since 5y ago; this cycle's ask has dropped $10k (18%) from the opening price — seller is motivated, your offer sets the floor, not the list.
Risks & watch-outs
- Watch-outs: built in 1930 — expect roof / HVAC / electrical / plumbing capex.
Questions for the listing agent
- It's been on market 162 days. Have you received any prior offers? Is the seller open to a 12% concession, seller financing, or rate buy-down credit?
- Built in 1930 — when were the roof, HVAC, electrical panel, plumbing, and water heater last replaced?
- Why hasn't it sold? Are there any deal-killer items the seller is aware of (foundation, flood, title, zoning, code violations)?
- Is there a deadline driving the sale (1031 exchange, divorce, estate, relocation)? That informs how much negotiation room exists.
- Crime grade is D in this area — have there been break-ins, vandalism, or insurance claims at this property in the last 3 years? What carrier currently insures it and at what premium?
- What's the average days-on-market for RENTAL listings here right now (not sales)? A rising rental-DOM trend means longer vacancies and softer asking-rent achievability than the comps imply.
- What's the recent tenant-quality profile in this submarket — average credit score on applications, eviction rate, late-payment / NSF rate, and stable-employment percentage? A property-management company in the area should have these aggregated.
- How much new for-sale + rental construction is in the pipeline within 1–3 miles? Heavy new supply typically softens prices + rents 12–24 months out; constrained supply supports both.
Investment metrics
- 1% rule
- 1.80% ✓
- Cap rate
- 16.24%
- Cash-on-cash
- 35.53%
- DSCR
- 2.58
- GRM
- 4.6
CMA / ARV
- ARV (on-the-fly)
- $95,472
- Comps found
- 3
Show comp detail 3 sales within ~0.75 mi
| Address | Dist | Beds/Ba | Sqft | Sold | Price | $/sf | Match |
|---|---|---|---|---|---|---|---|
| 1796 W C St | 0.32mi | 2/1.0 | 624 (-11%) | 3mo | $30,000 | $48 | 64 |
| 1834 E E St | 0.64mi | 2/1.0 | 792 (+13%) | 4mo | $139,000 | $176 | 45 |
| 2302 E B St | 0.70mi | 1/1.0 (-1) | 660 (-6%) | 9mo | $90,000 | $136 | 45 |
Match score weights: distance 35% · size 25% · config 20% · recency 20%. Top-matched comps best support the ARV.
Projected returns pro-forma
-3.0% appreciation · 3.0% rent growth · sell at horizon
- IRR
- 31.1%
- Equity multiple
- 2.31×
- Total profit
- $16,415
- Equity at exit
- $6,695
- IRR
- 38.3%
- Equity multiple
- 4.56×
- Total profit
- $44,755
- Equity at exit
- $3,882
Cash invested: $12,572 (down + closing). Projections, not guarantees.
Landlord ↔ Tenant lean methodology
- Overall (STATE)
- 90 Strongly Landlord-Friendly
- State Wyoming
- 90 Strongly Landlord-Friendly · R+25
- County
- — inherits STATE
- City
- — inherits STATE
ZIP-level market 82240
- Active inventory
- 93
- Price-to-rent
- 4.6×
Monthly cashflow live
- Estimated rent
- $807 medium interval (Pro) →
- Mortgage (P&I)
- −$235
- Tax from tax record
- −$11 /mo · $130/yr
- Insurance
- −$19
- HOA
- −$0
- Vacancy / Maint / Mgmt
- −$169
- Net cashflow
- $372
Break-even live
UW: 25.0% down · 7.5% · 30yr · 1.5% tax · 5.0% vac · 8.0% maint · 8.0% mgmt
Financing live
Cash to close
- Down payment
- $11,225
- Closing costs
- $1,347
- Reserves months
- —
- Total cash needed
- —
Loan-product check · same deal, 3 products live
Conventional
25% down · 7.5% · 30yr
- Down + closing
- —
- Monthly P&I
- —
- Monthly cashflow
- —
- DSCR
- —
- Eligible?
- —
Personal DTI + credit; lowest rate.
DSCR
20% down · 8.5% · 30yr
- Down + closing
- —
- Monthly P&I
- —
- Monthly cashflow
- —
- DSCR
- —
- Eligible?
- —
No personal income docs; deal must DSCR.
Hard money
10% down · 12.0% · 12mo
- Down + closing
- —
- Monthly P&I
- —
- Monthly cashflow
- —
- DSCR
- —
- Eligible?
- —
Short-term bridge; refi at stabilization.
Listing history 25 events
-
2026-06-19days on market $44,900 Active 162 DOM
-
2026-06-18days on market $44,900 Active 161 DOM
-
2026-06-17days on market $44,900 Active 160 DOM
-
2026-06-16days on market $44,900 Active 159 DOM
-
2026-06-15days on market $44,900 Active 158 DOM
-
2026-06-14days on market $44,900 Active 156 DOM
-
2026-06-13days on market $44,900 Active 155 DOM
-
2026-06-10days on market $44,900 Active 153 DOM
-
2026-06-09days on market $44,900 Active 152 DOM
-
2026-06-08days on market $44,900 Active 151 DOM
-
2026-06-07days on market $44,900 Active 150 DOM
-
2026-06-03days on market $44,900 Active 146 DOM
-
2026-06-02days on market $44,900 Active 145 DOM
-
2026-06-01days on market $44,900 Active 144 DOM
-
2026-05-31days on market $44,900 Active 143 DOM
-
2026-05-30days on market $44,900 Active 142 DOM
-
2026-01-27price $44,900
-
2026-01-05$54,900 Active
-
2025-02-10price $29,900
-
2024-05-18price $38,500
-
2023-06-27$39,500 Active
-
2022-06-30soldstatus
-
2022-06-30soldstatus
-
2021-07-28$12,000
-
2020-03-04soldstatus
ⓘ Source: listings_history table (triggers on properties + properties_extension) + one-shot
backfill from property_details.listing_events for pre-trigger history.
Tax reassessment forecast WY · Resets to sale price
- Current annual tax
- $130 · $11/mo
- Projected year-2 tax
- $274 · $23/mo
- Expected delta
- +$144/yr (+$12/mo · 111.2%)
ⓘ Screening estimate from a state-policy table — verify with the county assessor before closing.
Climate risk First Street
- Flood 1/10 Low FEMA zone X (unshaded) · 0% chance over 30 yrs
- Wildfire 2/10 Low
- Heat 3/10 Moderate 7 d/yr ≥94°F today · 20 d/yr by 30 yrs out
- Wind 1/10 Low
- Air quality 2/10 Low 1 unhealthy d/yr today · 2 by 30 yrs out
Nearby sold comps map
Loading sold comps map…
Walkable amenities ~0.75 mi
Loading nearby amenities…
Taxation est. · year 1
- Rental income
- $9,679
- − Mortgage interest
- −$2,515
- − Property taxes
- −$130
- − Insurance
- −$224
- − Repairs & maintenance
- −$774
- − Management
- −$774
- − Depreciation
- −$1,306
- Taxable income
- $3,955
- Est. tax owed @ 24.0%
- −$949
- After-tax cash flow
- $3,517/yr
For passive investors: Depreciation is non-cash, so a rental often shows a tax loss while cash-flowing — sheltering income. Rental losses are passive: they offset passive income freely, and up to $25,000/yr can offset ordinary (W-2) income if you actively participate and your MAGI is under $100k (phasing out to $0 by $150k); unused losses carry forward. On sale, claimed depreciation is recaptured at up to 25%, and gains may owe capital-gains tax (a 1031 exchange can defer both). Figures are a year-1 estimate at your 24.0% rate — not tax advice; consult a CPA.
Schools (NCES district)
- District
- Goshen County School District #1
- NCES district ID
- 5602990
- Math proficiency
- 45% ▼ -5.00%
- Reading proficiency
- 57% ▲ 2.00%
- Median HH income
- $44,003
- Composite
- 43.0/100
- National rank
- #3106
- State rank
- #28 of 41 in WY
Livability — Torrington
- Score
- 67/100
- State rank
- #66
- US rank
- #11066
Category grades
Schools grade is shown separately in the Schools card above.
Census & demographics
- Census place
- Torrington, WY
- County
- Goshen County · 9,667 people
- City population
- 9,667
- Metro
- nan
- Population (ZIP)
- 9,667
- Household income
- $60,766
- Rent vs Own
- Severe rent burden
- 253.0
Population outlook (Goshen County) Hauer SSP2
- Today (2025)
- 14,178 people
- By 2030
- 14,461 · +2.0%
- By 2040
- 15,052 · +6.2%
- By 2050
- 15,857 · +11.8%
- By 2075
- 18,921 · +33.5%
- By 2100
- 21,342 · +50.5%
Race, ethnicity, and origin ACS 2023
- Neighborhood character
- Predominantly White (84%)
- Race & ethnicity
- White 84% Hispanic / Latino 11% Two or more races 6%
- Hispanic origin (detail)
- Mexican 8%
- Common ancestry
- Slovak 3% Serbian 2% Iranian 2%
- Foreign-born
- 2% · Canada, Jamaica
- Languages at home
- 93% English-only · Spanish 7%
Political lean MEDSL · Goshen
- 2024 margin
- Solid R (+60.9) · D 18.9% · R 79.8% · Other 1.4%
- 2008→2024 swing
- -25.2pp toward R · 2008: -35.7pp · 2024: -60.9pp
- All cycles
- 2024: R+60.9 2020: R+58.9 2016: R+61.2 2012: R+47.2 2008: R+35.7
Not yet ingested
- Civics
- —
Market trends
- HPI YoY
- ▼ -95.75%
- Current HPI
- 176.949
- Rent YoY
- —
- Metro
- nan
- State GDP YoY
- —
- F500 in state
- 0
Price history
+274.2% since first listed9 events — show timeline
- 2026-01-27 Price Changed $44,900 WMLS
- 2026-01-05 Listed $54,900 WMLS
- 2025-02-10 Price Changed $29,900 CBR
- 2024-05-18 Price Changed $38,500 WMLS
- 2023-06-27 Listed $39,500 WMLS
- 2022-06-30 Sold (Public Records) — Public Records
- 2022-06-30 Sold (MLS) — WMLS
- 2021-07-28 Listed $12,000 WMLS
- 2020-03-04 Sold (Public Records) — Public Records
Property tax history
+2.4%/yrLatest (2025): $130 · -23.8% YoY. Source: county tax records.
Cash-flow waterfall
monthlySold comps — $/sqft
last 12 mo · ≤1 miLoading sold comps…