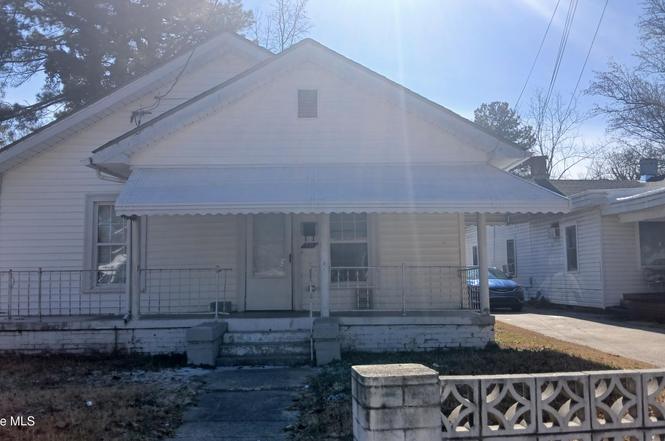
311 Paul St · Rocky Mount, NC
Flood risk 4/10 · Minor
- FEMA flood zone
- X (unshaded)
- Chance of flooding over 30 yrs
- 0.2%
- Est. flood insurance / yr
- $507 – $1,088
Fire risk 2/10 · Minimal
- Est. fire insurance / yr
- $906 – $1,684
Heat risk 8/10 · Major
- Hot days now (above 107°F)
- 7 days/yr
- Hot days in 30 yrs
- 16 days/yr
Wind risk 6/10 · Moderate
- Chance of severe wind over 30 yrs
- 72.0%
Air-quality risk 2/10 · Minimal
- Unhealthy air days now
- 1 days/yr
- Unhealthy air days in 30 yrs
- 2 days/yr
Risk factors via First Street. Map © Google.
Why this score? — see what drove the C+ grade
The composite is a weighted blend of 9 inputs, each scored 0–100. Each bar is that input's sub-score; the figure is the points it added to the 100-point composite (weight × sub-score).
- Cash flow +30.0/30.0
- 1% rule +10.0/10.0
- DSCR +10.0/10.0
- Rent growth +3.9/5.0
- Livability +3.5/5.0
- Condition / age +2.5/5.0
- Schools +2.2/10.0
- ARV discount +0.0/15.0
- Appreciation +0.0/10.0
$89,000
🖨 Deal sheet 📄 Offer letter ✓ Due diligence
Listing remarks MLS
Great opportunity to own a home! Spacious backyard. Detached carport. Hardwood flooring thourhgout the property. Separate dining area. Open kitchen and breakfast area. Choose FHA financing and ask us how you can purchase this home for only $100 down!
Key facts
- 7,405 sq ft lot
- Built 1925
- Listed 139 days
Property features AI
Finance
- HOA & community: No association amenities
Exterior
- Parking: Off-street parking
- Utilities: Sewer connected; Water connected
- Home design: Single-family residence; One story; Residential property; New construction; Has a view
- Construction: Vinyl siding; Composition roof
- Exterior features: Covered front porch; No additional exterior features listed; No pool
Interior
- Kitchen: Electric oven; Electric range; Electric water heater
- Bedrooms: 2 total rooms (includes living spaces and bedrooms)
- Flooring: Carpet; Vinyl
- Bathrooms: 1 full bathroom
- Heating & cooling: Heat pump heating; Electric heating; Central air conditioning; Heat pump cooling
- Interior features: Unfurnished; Crawl space or no basement
- Laundry & utility: Washer hookup
Neighborhood map
What this means for you Summary
Snapshot
- This is a 3-bed/1.0-bath single-family listed at $89k.
Deal economics
- At list price, monthly cash flow is $563 ($7k/yr) — positive.
- The deal already cash-flows at list — no discount required.
- Meets the 1% rule at list price ($1k rent vs $89k).
- Recommended offer: $78k (12.0% below list) — sets the bar for market timing.
- Cap rate 13.9% vs local median 4.5% in Rocky Mount — top-decile yield for the area; either an underpriced asset or a hidden risk that comps aren't pricing in. Stress-test before assuming the spread holds.
Location & tenants
- Location reads 70/100 on livability (#134 in NC) — a middle-class / working-renter tenant base. Strengths: cost of living A+, housing A+, health & safety A+; Watch: crime F, amenities F, employment F.
- Nash-Rocky Mount Schools (rural): math 20% / reading 32% proficiency, ranked #155 of 178 in NC (top 87%) — low school quality limits family demand, transient renter base, plan for 1-2y turnover.
- Zoned schools: Winstead Avenue Elementary (538 students, 80% FRL); Rocky Mount Middle (math 7% / reading 26%, grade F, #449 of 475 statewide, top 96%, 407 students, 97% FRL); Nash Central High (math 27% / reading 36%, grade F, #449 of 535 statewide, top 85%, 921 students, 64% FRL) — zoned schools average 80% FRL vs 59% district-wide (21 pts higher); higher-poverty schools than district average — tighter screening recommended.
- Market conditions: Rents rising fast (+5.5%/yr); 171 active listings in the ZIP; 500 units permitted in Nash County in 2024 (0 in 5+ unit buildings).
Forward outlook
- Local home prices are declining (-3.0%/yr); year-one equity from $615 of loan paydown is wiped out by about $3k of value loss. Plan a longer hold.
- Nash County population projected at -12% by 2050 — secular population decline; favor cash flow + early exit over multi-decade hold.
- At projected returns (-3.0% appreciation + 5.5% rent growth), your $25k cash investment doubles in ~5 years — after that, you're playing with house money.
Negotiation context
- It's been on market 140 days — a 12% lower offer ($78k) is reasonable based on typical stale-listing flexibility.
- 6 sale attempts since 11y ago with the ask held roughly flat each time — persistent listings suggest the price (not the market) is what's stuck; bring a comps-based counter.
- Current owner paid $10k; list at $89k implies a 790% gain — meaningful room to come down on a strong offer.
Risks & watch-outs
- Watch-outs: built in 1925 — expect roof / HVAC / electrical / plumbing capex.
- Climate carrying-cost: major wind risk, 72% chance of damaging wind over 30y; extreme-heat days projected 7→16/yr by 2055 (HVAC capex compounding) — expect insurance premiums to compound above CPI over the hold.
Questions for the listing agent
- It's been on market 140 days. Have you received any prior offers? Is the seller open to a 12% concession, seller financing, or rate buy-down credit?
- Built in 1925 — when were the roof, HVAC, electrical panel, plumbing, and water heater last replaced?
- Why hasn't it sold? Are there any deal-killer items the seller is aware of (foundation, flood, title, zoning, code violations)?
- Is there a deadline driving the sale (1031 exchange, divorce, estate, relocation)? That informs how much negotiation room exists.
- Schools are F-rated, which usually means shorter tenancies and higher turnover. Who's the typical renter profile here, and what's been the actual vacancy rate?
- Crime grade is F in this area — have there been break-ins, vandalism, or insurance claims at this property in the last 3 years? What carrier currently insures it and at what premium?
- What's the average days-on-market for RENTAL listings here right now (not sales)? A rising rental-DOM trend means longer vacancies and softer asking-rent achievability than the comps imply.
- What's the recent tenant-quality profile in this submarket — average credit score on applications, eviction rate, late-payment / NSF rate, and stable-employment percentage? A property-management company in the area should have these aggregated.
- How much new for-sale + rental construction is in the pipeline within 1–3 miles? Heavy new supply typically softens prices + rents 12–24 months out; constrained supply supports both.
Investment metrics
- 1% rule
- 1.54% ✓
- Cap rate
- 13.88%
- Cash-on-cash
- 27.11%
- DSCR
- 2.21
- GRM
- 5.4
CMA / ARV
- ARV (on-the-fly)
- $59,360
- Comps found
- 12
Show comp detail 12 sales within ~0.75 mi
| Address | Dist | Beds/Ba | Sqft | Sold | Price | $/sf | Match |
|---|---|---|---|---|---|---|---|
| 414 Dexter St | 0.17mi | 3/1.0 | 1,154 (+3%) | 8mo | $62,500 | $54 | 81 |
| 513 Mullins St | 0.21mi | 3/1.0 | 1,056 (-6%) | 4mo | $103,000 | $98 | 77 |
| 605 Dexter St | 0.31mi | 3/1.0 | 1,216 (+9%) | 2mo | $65,000 | $53 | 70 |
| 623 Henry St | 0.37mi | 3/1.0 | 1,188 (+6%) | 4mo | $21,000 | $18 | 70 |
| 1616 Davis St | 0.35mi | 2/1.0 (-1) | 1,050 (-6%) | 10mo | $23,000 | $22 | 60 |
| 225 Hendricks St | 0.48mi | 2/1.0 (-1) | 1,203 (+7%) | 2mo | $20,000 | $17 | 59 |
| 223 Renfrow St | 0.64mi | 3/1.0 | 1,176 (+5%) | 10mo | $37,000 | $31 | 54 |
| 1416 Betz St | 0.64mi | 3/1.5 | 1,064 (-5%) | 10mo | $100,000 | $94 | 52 |
| 1200 Calvary St | 0.64mi | 3/1.0 | 1,050 (-6%) | 10mo | $140,000 | $133 | 51 |
| 640 Beaman St | 0.42mi | 2/1.0 (-1) | 965 (-14%) | 5mo | $51,500 | $53 | 48 |
| 704 S Pine St | 0.71mi | 3/1.0 | 1,020 (-9%) | 7mo | $67,000 | $66 | 46 |
| 617 Pender St | 0.69mi | 3/1.0 | 1,232 (+10%) | 8mo | $42,000 | $34 | 44 |
Match score weights: distance 35% · size 25% · config 20% · recency 20%. Top-matched comps best support the ARV.
Projected returns pro-forma
-3.0% appreciation · 5.51% rent growth · sell at horizon
- IRR
- 23.6%
- Equity multiple
- 2.00×
- Total profit
- $24,950
- Equity at exit
- $13,270
- IRR
- 33.0%
- Equity multiple
- 4.33×
- Total profit
- $83,082
- Equity at exit
- $7,695
Cash invested: $24,920 (down + closing). Projections, not guarantees.
Landlord ↔ Tenant lean methodology
- Overall (STATE)
- 85 Strongly Landlord-Friendly
- State North Carolina
- 85 Strongly Landlord-Friendly · R+3
- County
- — inherits STATE
- City
- — inherits STATE
ZIP-level market 27803
- Rents YoY
- 5.5%
- Active inventory
- 171
- Price-to-rent
- 5.4×
Monthly cashflow live
- Estimated rent
- $1,371 medium interval (Pro) →
- Mortgage (P&I)
- −$467
- Tax from tax record
- −$16 /mo · $195/yr
- Insurance
- −$37
- HOA
- −$0
- Vacancy / Maint / Mgmt
- −$288
- Net cashflow
- $563
Break-even live
UW: 25.0% down · 7.5% · 30yr · 1.5% tax · 5.0% vac · 8.0% maint · 8.0% mgmt
Financing live
Cash to close
- Down payment
- $22,250
- Closing costs
- $2,670
- Reserves months
- —
- Total cash needed
- —
Loan-product check · same deal, 3 products live
Conventional
25% down · 7.5% · 30yr
- Down + closing
- —
- Monthly P&I
- —
- Monthly cashflow
- —
- DSCR
- —
- Eligible?
- —
Personal DTI + credit; lowest rate.
DSCR
20% down · 8.5% · 30yr
- Down + closing
- —
- Monthly P&I
- —
- Monthly cashflow
- —
- DSCR
- —
- Eligible?
- —
No personal income docs; deal must DSCR.
Hard money
10% down · 12.0% · 12mo
- Down + closing
- —
- Monthly P&I
- —
- Monthly cashflow
- —
- DSCR
- —
- Eligible?
- —
Short-term bridge; refi at stabilization.
Listing history 29 events
-
2026-06-19days on market $89,000 Active 140 DOM
-
2026-06-18days on market $89,000 Active 139 DOM
-
2026-06-17days on market $89,000 Active 138 DOM
-
2026-06-16days on market $89,000 Active 137 DOM
-
2026-06-15days on market $89,000 Active 136 DOM
-
2026-06-14days on market $89,000 Active 134 DOM
-
2026-06-13days on market $89,000 Active 133 DOM
-
2026-06-10days on market $89,000 Active 131 DOM
-
2026-06-09days on market $89,000 Active 130 DOM
-
2026-06-08days on market $89,000 Active 129 DOM
-
2026-06-07days on market $89,000 Active 128 DOM
-
2026-06-03days on market $89,000 Active 124 DOM
-
2026-06-02days on market $89,000 Active 123 DOM
-
2026-06-01days on market $89,000 Active 122 DOM
-
2026-05-31days on market $89,000 Active 121 DOM
-
2026-05-30days on market $89,000 Active 120 DOM
-
2026-02-11status Active
-
2026-02-11historical Active Under Contract
-
2026-01-29$89,000 Active
-
2022-05-11price $82,000
-
2022-04-11price $89,000
-
2022-03-04$99,000 Active
-
2015-09-04soldstatus $10,000 250-char remark
Show marketing remark (250 chars)
Great opportunity to own a home! Spacious backyard. Detached carport. Hardwood flooring thourhgout the property. Separate dining area. Open kitchen and breakfast area. Choose FHA financing and ask us how you can purchase this home for only $100 down!
-
2015-09-04soldstatus $10,000
Show marketing remark (250 chars)
Great opportunity to own a home! Spacious backyard. Detached carport. Hardwood flooring thourhgout the property. Separate dining area. Open kitchen and breakfast area. Choose FHA financing and ask us how you can purchase this home for only $100 down!
-
2015-05-29$10,000
-
2015-05-29$10,000
-
2015-05-26$10,000 250-char remark
Show marketing remark (250 chars)
Great opportunity to own a home! Spacious backyard. Detached carport. Hardwood flooring thourhgout the property. Separate dining area. Open kitchen and breakfast area. Choose FHA financing and ask us how you can purchase this home for only $100 down!
-
1989-01-27soldstatus $32,000
ⓘ Source: listings_history table (triggers on properties + properties_extension) + one-shot
backfill from property_details.listing_events for pre-trigger history.
Tax reassessment forecast NC · Resets to sale price
- Current annual tax
- $195 · $16/mo
- Projected year-2 tax
- $730 · $61/mo
- Expected delta
- +$535/yr (+$45/mo · 274.2%)
ⓘ Screening estimate from a state-policy table — verify with the county assessor before closing.
Climate risk First Street
- Flood 4/10 Moderate FEMA zone X (unshaded) · 20% chance over 30 yrs
- Wildfire 2/10 Low
- Heat 8/10 Severe 7 d/yr ≥107°F today · 16 d/yr by 30 yrs out
- Wind 6/10 Major 72% chance of damaging wind over 30 yrs
- Air quality 2/10 Low 1 unhealthy d/yr today · 2 by 30 yrs out
Nearby sold comps map
Loading sold comps map…
Walkable amenities ~0.75 mi
Loading nearby amenities…
Taxation est. · year 1
- Rental income
- $16,452
- − Mortgage interest
- −$4,985
- − Property taxes
- −$195
- − Insurance
- −$445
- − Repairs & maintenance
- −$1,316
- − Management
- −$1,316
- − Depreciation
- −$2,589
- Taxable income
- $5,605
- Est. tax owed @ 24.0%
- −$1,345
- After-tax cash flow
- $5,411/yr
For passive investors: Depreciation is non-cash, so a rental often shows a tax loss while cash-flowing — sheltering income. Rental losses are passive: they offset passive income freely, and up to $25,000/yr can offset ordinary (W-2) income if you actively participate and your MAGI is under $100k (phasing out to $0 by $150k); unused losses carry forward. On sale, claimed depreciation is recaptured at up to 25%, and gains may owe capital-gains tax (a 1031 exchange can defer both). Figures are a year-1 estimate at your 24.0% rate — not tax advice; consult a CPA.
Schools (NCES district)
- District
- Nash-Rocky Mount Schools
- NCES district ID
- 3703270
- Math proficiency
- 20% ▼ -3.00%
- Reading proficiency
- 32% ▲ 1.00%
- Median HH income
- $41,553
- Composite
- 22.04/100
- National rank
- #8198
- State rank
- #155 of 178 in NC
Livability — Rocky Mount
- Score
- 70/100
- State rank
- #134
- US rank
- #7692
Category grades
Schools grade is shown separately in the Schools card above.
Census & demographics
- Census place
- Rocky Mount, NC
- County
- Nash County · 50,768 people
- City population
- 70,300
- Metro
- Rocky Mount, NC
- Population (ZIP)
- 20,055
- Household income
- $60,124
- Rent vs Own
- Severe rent burden
- 641.0
Population outlook (Nash County) Hauer SSP2
- Today (2025)
- 91,107 people
- By 2030
- 89,193 · -2.1%
- By 2040
- 84,959 · -6.7%
- By 2050
- 80,517 · -11.6%
- By 2075
- 72,941 · -19.9%
- By 2100
- 63,602 · -30.2%
Race, ethnicity, and origin ACS 2023
- Neighborhood character
- Diverse neighborhood (Simpson 0.60)
- Race & ethnicity
- White 46% Black 44% Two or more races 6% Hispanic / Latino 5% Asian 1%
- Common ancestry
- Iranian 1% Italian 1% Slovak 1%
- Foreign-born
- 3% · Canada
- Languages at home
- 93% English-only · Spanish 5% Arabic 1% Other Indo-European 1%
Political lean MEDSL · Nash
- 2024 margin
- Toss-up / Even · D 48.7% · R 50.5%
- 2008→2024 swing
- -0.4pp no change · 2008: -1.3pp · 2024: -1.8pp
- All cycles
- 2024: R+1.8 2020: D+0.2 2016: R+0.2 2012: D+0.9 2008: R+1.3
Not yet ingested
- Civics
- —
Market trends
- HPI YoY
- ▼ -162.95%
- Current HPI
- 190.0204
- Rent YoY
- ▲ 5.51%
- Metro
- Rocky Mount, NC
- State GDP YoY
- ▲ 3.28%
- F500 in state
- 26
Industry mix (Fortune 500 HQ in NC)
| Industry | F500 HQs | Revenue |
|---|---|---|
| Financial Services | 2 | $213B |
|
||
| Retail | 2 | $95B |
|
||
| Industrial Conglomerate | 1 | $38B |
|
||
| Metals / Steel | 1 | $35B |
|
||
| Utilities | 1 | $30B |
|
||
| Industrial Machinery | 1 | $19B |
|
||
Price history
+178.1% since first listed13 events — show timeline
- 2026-02-11 Relisted — Hive MLS
- 2026-02-11 Contingent — Hive MLS
- 2026-01-29 Listed $89,000 Hive MLS
- 2022-05-11 Price Changed $82,000 CANOPYMLS as Distributed by MLS Grid
- 2022-04-11 Price Changed $89,000 CANOPYMLS as Distributed by MLS Grid
- 2022-03-04 Listed $99,000 CANOPYMLS as Distributed by MLS Grid
- 2015-09-04 Sold (MLS) $10,000 AMLSNC
- 2015-09-04 Sold (MLS) $10,000 TMLS
- 2015-09-04 Sold (MLS) $10,000 Hive MLS
- 2015-05-29 Listed $10,000 AMLSNC
- 2015-05-29 Listed $10,000 TMLS
- 2015-05-26 Listed $10,000 Hive MLS
- 1989-01-27 Sold (Public Records) $32,000 Public Records
Property tax history
-1.6%/yrLatest (2025): $195 · +0.0% YoY. Source: county tax records.
Cash-flow waterfall
monthlySold comps — $/sqft
last 12 mo · ≤1 miLoading sold comps…