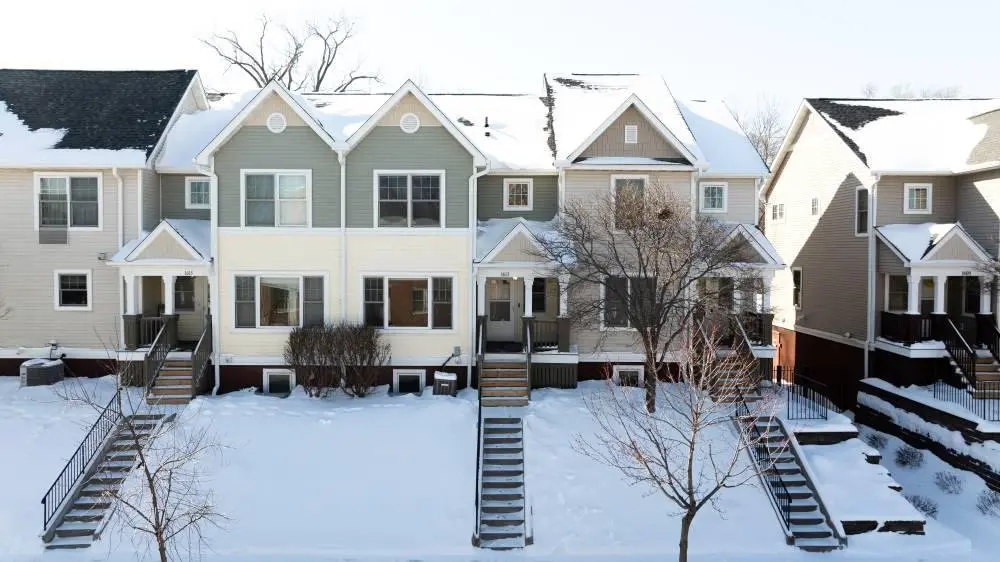
1613 E 24th St · Minneapolis, MN
Flood risk 1/10 · Minimal
- FEMA flood zone
- X (unshaded)
- Chance of flooding over 30 yrs
- 0.0%
- Est. flood insurance / yr
- $473 – $860
Fire risk 1/10 · Minimal
- Est. fire insurance / yr
- $888 – $1,650
Heat risk 2/10 · Minimal
- Hot days now (above 99°F)
- 7 days/yr
- Hot days in 30 yrs
- 14 days/yr
Wind risk 2/10 · Minimal
- Chance of severe wind over 30 yrs
- —
Air-quality risk 2/10 · Minimal
- Unhealthy air days now
- 1 days/yr
- Unhealthy air days in 30 yrs
- 1 days/yr
Risk factors via First Street. Map © Google.
Why this score? — see what drove the D+ grade
The composite is a weighted blend of 9 inputs, each scored 0–100. Each bar is that input's sub-score; the figure is the points it added to the 100-point composite (weight × sub-score).
- Cash flow +17.0/30.0
- ARV discount +7.5/15.0
- 1% rule +6.8/10.0
- DSCR +5.3/10.0
- Livability +3.9/5.0
- Schools +3.5/10.0
- Rent growth +2.8/5.0
- Condition / age +2.5/5.0
- Appreciation +0.0/10.0
$186,000
🖨 Deal sheet 📄 Offer letter ✓ Due diligence
Listing remarks
* Please note * Seller is Twin Cities Habitat for Humanity. Property is part of an affordable housing program and a Land Trust (CLCLT). Buyers must meet income and eligibility requirements with both TCHFH and CLCLT. Buyers must be first time homeowners and at 80% Area Median Income (AMI) or lower to qualify. Ask your agent to confirm with AMI chart included in supplement documents. All purchasers will be required to provide income documentation and obtain program approval. Property must be owner occupied. * * * Down Payment Assistance available for eligible buyers using TruePath TCHFH Lending for financing * * * Welcome home to this wonderful townhome in South Minneapolis! This home h
Key facts
- New furnace
- New paint
- New appliances
Tags
Property features AI
Finance
- Other: Above-grade finished area approximately 1,440; Main level finished area approximately 720; Total living area approximately 1,440
- HOA & community: HOA managed by Sharper Management; Monthly HOA fee of $352; HOA covers lawn care and grounds maintenance
Exterior
- Parking: Tuck-under garage; 1-car garage
- Utilities: City water connected; City sewer connected; Natural gas
- Home design: Attached residential property; Three-level split layout; Entry level information not provided; Facing direction not provided
- Construction: Block foundation; Roof older than 8 years
- Exterior features: Small lot (approximately 0.02 acres); Lot dimensions about 21 x 48
Interior
- Kitchen: Dishwasher; Microwave; Range; Refrigerator; Stainless steel appliances
- Bedrooms: 4 bedrooms
- Bathrooms: 1 full bath; 1 half bath
- Heating & cooling: Forced air heating; Central air conditioning
- Interior features: Ceiling fans; Balcony
- Laundry & utility: Washer and dryer included; Laundry located on upper level; Washer/Dryer hookup
Neighborhood map
What this means for you Summary
Snapshot
- This is a 4-bed/2.5-bath townhouse listed at $186k.
Deal economics
- At list price, monthly cash flow is $125 ($2k/yr) — positive.
- The deal already cash-flows at list — no discount required.
- Meets the 1% rule at list price ($2k rent vs $186k).
- Cap rate 7.1% vs local median 3.1% in Minneapolis — top-decile yield for the area; either an underpriced asset or a hidden risk that comps aren't pricing in. Stress-test before assuming the spread holds.
Location & tenants
- Location reads 78/100 on livability (#110 in MN, #2,525 nationally) — a middle-class / working-renter tenant base. Strengths: amenities A+, commute A+, housing A+; Watch: cost of living C-, crime F.
- Minneapolis Public School District (urban): math 35% / reading 46% proficiency, ranked #217 of 301 in MN (top 72%) — families likely to look elsewhere, expect single-tenant / working-renter base with shorter leases.
- Market conditions: Rents rising (+1.0%/yr); 103 active listings in the ZIP; 12 comparable units currently listed for rent nearby; rentals at typical pace (median 18d on market — plan ~3-4 weeks tenant-placement turnaround); lower-income renter base — watch delinquency; 4,651 units permitted in Hennepin County in 2024 (2,443 in 5+ unit buildings).
- At $2,202/mo this rent would consume 63% of the median local household income ($42k/yr) (locally 2999% of renters already pay >50% of income on rent) — very limited rent-growth headroom before tenants either downsize or default.
Forward outlook
- Local home prices are declining (-3.0%/yr); year-one equity from $1k of loan paydown is wiped out by about $6k of value loss. Plan a longer hold.
- Hennepin County population projected at +30% by 2050 — long-run rental-demand tailwind backs the buy-and-hold thesis.
Negotiation context
- Only 14 days on market — expect competitive offers; lowballing is unlikely to land.
Questions for the listing agent
- What does the HOA fee cover, when was the last increase, and are there any pending special assessments or reserve-fund shortfalls?
- Is there a deadline driving the sale (1031 exchange, divorce, estate, relocation)? That informs how much negotiation room exists.
- Crime grade is F in this area — have there been break-ins, vandalism, or insurance claims at this property in the last 3 years? What carrier currently insures it and at what premium?
- The area grade is low — what's the realistic commute time and amenity access for the typical tenant pool here? Any planned neighborhood developments (good or bad) we should know about?
- What's the average days-on-market for RENTAL listings here right now (not sales)? A rising rental-DOM trend means longer vacancies and softer asking-rent achievability than the comps imply.
- What's the recent tenant-quality profile in this submarket — average credit score on applications, eviction rate, late-payment / NSF rate, and stable-employment percentage? A property-management company in the area should have these aggregated.
- How much new for-sale + rental construction is in the pipeline within 1–3 miles? Heavy new supply typically softens prices + rents 12–24 months out; constrained supply supports both.
Investment metrics
- 1% rule
- 1.18% ✓
- Cap rate
- 7.10%
- Cash-on-cash
- 2.89%
- DSCR
- 1.13
- GRM
- 7.0
CMA / ARV
No comps found within radius.
Projected returns pro-forma
-3.0% appreciation · 1.0% rent growth · sell at horizon
- IRR
- -14.4%
- Equity multiple
- 0.50×
- Total profit
- $-26,272
- Equity at exit
- $27,733
- IRR
- -10.1%
- Equity multiple
- 0.45×
- Total profit
- $-28,773
- Equity at exit
- $16,082
Cash invested: $52,080 (down + closing). Projections, not guarantees.
Landlord ↔ Tenant lean methodology
- Overall (CITY)
- 34 Tenant-Leaning
- State Minnesota
- 46 Balanced · D+2
- County
- — inherits STATE
- City Minneapolis
- 34 Tenant-Leaning · D+50
ZIP-level market 55404
- Home prices YoY
- -33.3%
- Rents YoY
- 1.0%
- Active inventory
- 103
- Price-to-rent
- 7.0×
Monthly cashflow live
- Estimated rent
- $2,202 high interval (Pro) →
- Mortgage (P&I)
- −$975
- Tax from tax record
- −$209 /mo · $2,510/yr
- Insurance
- −$78
- HOA
- −$352
- Vacancy / Maint / Mgmt
- −$462
- Net cashflow
- $125
Break-even live
UW: 25.0% down · 7.5% · 30yr · 1.5% tax · 5.0% vac · 8.0% maint · 8.0% mgmt
Financing live
Cash to close
- Down payment
- $46,500
- Closing costs
- $5,580
- Reserves months
- —
- Total cash needed
- —
Loan-product check · same deal, 3 products live
Conventional
25% down · 7.5% · 30yr
- Down + closing
- —
- Monthly P&I
- —
- Monthly cashflow
- —
- DSCR
- —
- Eligible?
- —
Personal DTI + credit; lowest rate.
DSCR
20% down · 8.5% · 30yr
- Down + closing
- —
- Monthly P&I
- —
- Monthly cashflow
- —
- DSCR
- —
- Eligible?
- —
No personal income docs; deal must DSCR.
Hard money
10% down · 12.0% · 12mo
- Down + closing
- —
- Monthly P&I
- —
- Monthly cashflow
- —
- DSCR
- —
- Eligible?
- —
Short-term bridge; refi at stabilization.
Rent comps 12 comps
| Address | Beds | Baths | Sqft | Rent | $/sqft | DOM | Units | Dist |
|---|---|---|---|---|---|---|---|---|
| 1819 15th Ave S Minneapolis, MN | 3.0 | 1.5 | 1700 | $2,050 | $1.21 | 14d | 1 | 0.39mi |
| 2121 11th Ave S Unit 2 Minneapolis, MN | 4.0 | 1.0 | 1800 | $2,450 | $1.36 | 4d | 1 | 0.42mi |
| 2540 12th Ave S Apt 2 Minneapolis, MN | 5.0 | 2.0 | 1700 | $2,450 | $1.44 | 43d | 1 | 0.44mi |
| 2016 25th Ave S Minneapolis, MN | 4.0 | 2.0 | 1600 | $1,900 | $1.19 | 43d | 1 | 0.70mi |
| 739 E 27th St Unit 739 Minneapolis, MN | 4.0 | 1.0 | 1699 | $2,600 | $1.53 | 24d | 1 | 0.74mi |
| 735 E 16th St #2 Minneapolis, MN | 3.0 | 1.0 | 1296 | $1,650 | $1.27 | 24d | 1 | 0.86mi |
| 2730 Portland Ave Minneapolis, MN | 1.0–3.0 | 1.0–2.0 | 940 | $1,755 | $1.87 | 7d | 3 | 1.00mi |
| 220 E 27th St #1 Minneapolis, MN | 4.0 | 1.0 | 2516 | $3,100 | $1.23 | 17d | 1 | 1.18mi |
| 2916 30th Ave S Unit D Minneapolis, MN | 4.0 | 2.0 | 1853 | $2,497 | $1.35 | 43d | 1 | 1.23mi |
| 212 10th Ave S Minneapolis, MN | 3.0 | 1.0–2.5 | 1490 | $8,588 | $5.76 | 1d | 10 | 1.25mi |
| 1111 3rd Ave S Unit 1511914P Minneapolis, MN | 4.0 | 1.0–2.0 | 1081 | $11,990 | $11.09 | 2d | 2 | 1.33mi |
| 2821 1st Ave S Unit 2 Minneapolis, MN | 3.0 | 1.0 | 1743 | $1,600 | $0.92 | 2d | 1 | 1.40mi |
HOA detail
- Monthly dues
- $352 · $4,224/yr
Listing history 9 events
-
2026-06-18days on market $186,000 Active 14 DOM
-
2026-06-17days on market $186,000 Active 13 DOM
-
2026-06-16days on market $186,000 Active 12 DOM
-
2026-06-15days on market $186,000 Active 11 DOM
-
2026-06-13days on market $186,000 Active 9 DOM
-
2026-06-09days on market $186,000 Active 5 DOM
-
2026-06-08days on market $186,000 Active 4 DOM
-
2026-06-07remarks 699-char remark
-
2026-06-07$186,000 Active 3 DOM
ⓘ Source: listings_history table (triggers on properties + properties_extension) + one-shot
backfill from property_details.listing_events for pre-trigger history.
Tax reassessment forecast MN · Partial reset (capped growth)
- Current annual tax
- $2,510 · $209/mo
- Projected year-2 tax
- $2,510 · $209/mo
- Expected delta
- $0/yr ($0/mo · 0.0%)
ⓘ Screening estimate from a state-policy table — verify with the county assessor before closing.
Climate risk First Street
- Flood 1/10 Low FEMA zone X (unshaded) · 0% chance over 30 yrs
- Wildfire 1/10 Low
- Heat 2/10 Low 7 d/yr ≥99°F today · 14 d/yr by 30 yrs out
- Wind 2/10 Low
- Air quality 2/10 Low 1 unhealthy d/yr today · 1 by 30 yrs out
Nearby sold comps map
Loading sold comps map…
Walkable amenities ~0.75 mi
Loading nearby amenities…
Taxation est. · year 1
- Rental income
- $26,419
- − Mortgage interest
- −$10,419
- − Property taxes
- −$2,510
- − Insurance
- −$930
- − Repairs & maintenance
- −$2,114
- − Management
- −$2,114
- − HOA
- −$4,224
- − Depreciation
- −$5,411
- Taxable loss
- −$1,301
- Est. tax savings @ 24.0%
- +$312
- After-tax cash flow
- $1,815/yr
For passive investors: Depreciation is non-cash, so a rental often shows a tax loss while cash-flowing — sheltering income. Rental losses are passive: they offset passive income freely, and up to $25,000/yr can offset ordinary (W-2) income if you actively participate and your MAGI is under $100k (phasing out to $0 by $150k); unused losses carry forward. On sale, claimed depreciation is recaptured at up to 25%, and gains may owe capital-gains tax (a 1031 exchange can defer both). Figures are a year-1 estimate at your 24.0% rate — not tax advice; consult a CPA.
Schools (NCES district)
- District
- Minneapolis Public School District
- NCES district ID
- 2721240
- Math proficiency
- 35% ▼ -7.00%
- Reading proficiency
- 46% ▼ -1.00%
- Median HH income
- $50,521
- Composite
- 34.92/100
- National rank
- #5067
- State rank
- #217 of 301 in MN
Livability — Minneapolis
- Score
- 78/100
- State rank
- #110
- US rank
- #2525
Category grades
Schools grade is shown separately in the Schools card above.
Census & demographics
- Census place
- Minneapolis, MN
- County
- Hennepin County · 1,150,272 people
- City population
- 417,555
- Metro
- Minneapolis-St. Paul-Bloomington, MN-WI
- Population (ZIP)
- 28,920
- Household income
- $41,940
- Rent vs Own
- Severe rent burden
- 2999.0
Population outlook (Hennepin County) Hauer SSP2
- Today (2025)
- 1,405,227 people
- By 2030
- 1,492,650 · +6.2%
- By 2040
- 1,660,157 · +18.1%
- By 2050
- 1,823,498 · +29.8%
- By 2075
- 2,221,283 · +58.1%
- By 2100
- 2,509,976 · +78.6%
Race, ethnicity, and origin ACS 2023
- Neighborhood character
- Highly diverse neighborhood (Simpson 0.72)
- Race & ethnicity
- White 36% Black 32% Hispanic / Latino 20% Two or more races 10% Native American 5% Asian 4%
- Hispanic origin (detail)
- Mexican 8%
- Common ancestry
- Portuguese 5% Romanian 3% Lithuanian 3%
- Foreign-born
- 24% · Canada, China, United Kingdom
- Languages at home
- 63% English-only · Spanish 13% Other Asian/Pacific 2% French/Haitian/Cajun 1%
Political lean MEDSL · Hennepin
- 2024 margin
- Solid D (+42.6) · D 70.2% · R 27.5% · Other 2.3%
- 2008→2024 swing
- +14.0pp toward D · 2008: 28.6pp · 2024: 42.6pp
- All cycles
- 2024: D+42.6 2020: D+43.2 2016: D+35.3 2012: D+27.1 2008: D+28.6
Not yet ingested
- Civics
- —
Market trends
- HPI YoY
- ▼ -112.31%
- Current HPI
- 224.8886
- Rent YoY
- ▲ 1.00%
- Metro
- Minneapolis-St. Paul-Bloomington, MN-WI
- State GDP YoY
- ▲ 2.41%
- F500 in state
- 34
Industry mix (Fortune 500 HQ in MN)
| Industry | F500 HQs | Revenue |
|---|---|---|
| Healthcare | 2 | $407B |
|
||
| Retail | 2 | $150B |
|
||
| Consumer Goods | 2 | $32B |
|
||
| Industrial Machinery | 2 | $6B |
|
||
| Agriculture | 1 | $40B |
|
||
| Healthcare / Medical Devices | 1 | $32B |
|
||
Price history
+376.9% since first listed4 events — show timeline
- 2026-06-04 Listed $186,000 NORTHSTARMLS as Distributed by MLS Grid
- 2025-07-15 Sold (Public Records) $265,000 Public Records
- 2003-02-07 Sold (Public Records) $130,000 Public Records
- 1990-06-12 Sold (Public Records) $39,000 Public Records
Property tax history
+1.6%/yrLatest (2025): $2,510 · +36.8% YoY. Source: county tax records.
Cash-flow waterfall
monthlySold comps — $/sqft
last 12 mo · ≤1 miLoading sold comps…