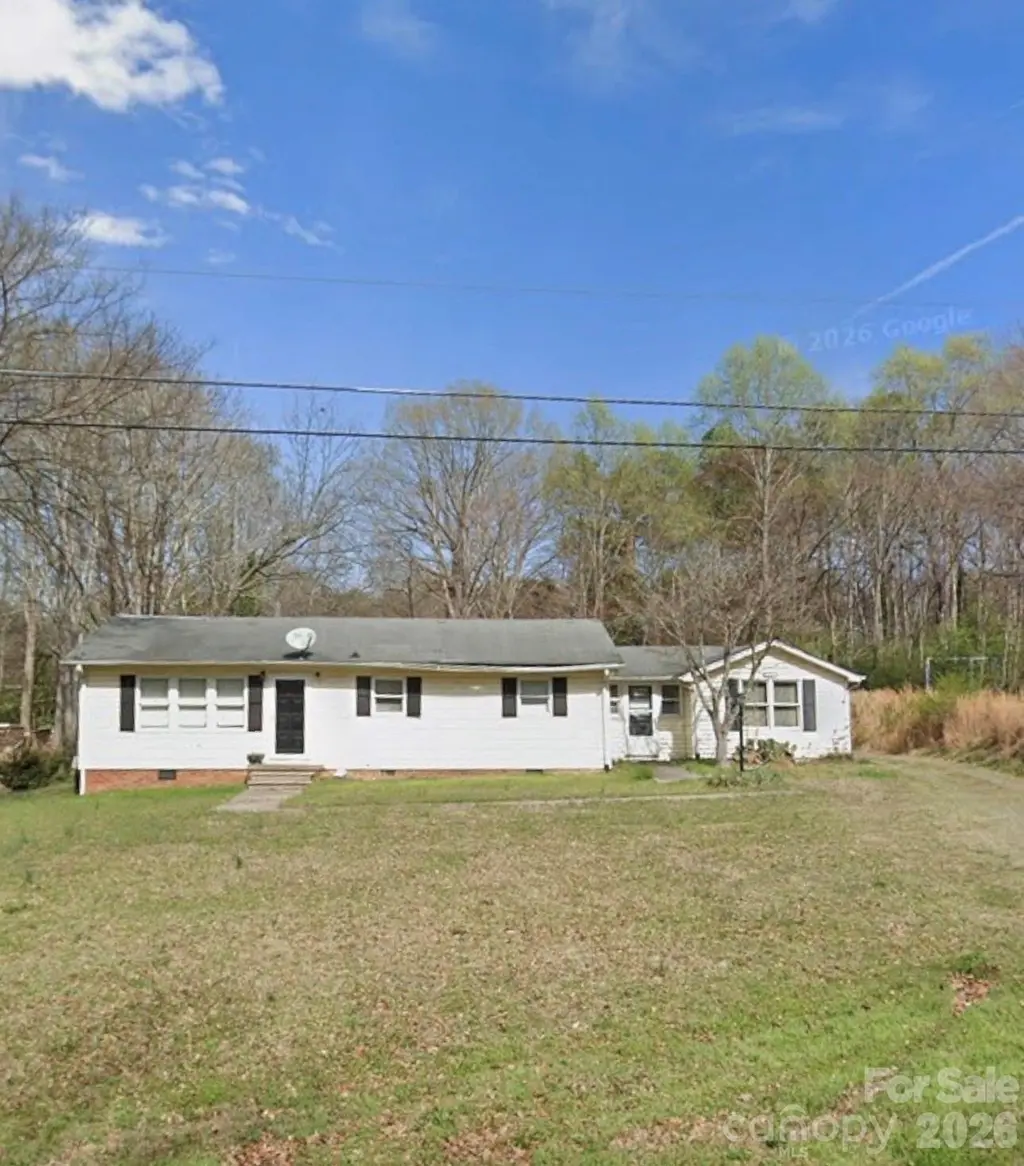
316 Meadow Creek Church Rd · Locust, NC
Flood risk 1/10 · Minimal
- FEMA flood zone
- X (unshaded)
- Chance of flooding over 30 yrs
- 0.0%
- Est. flood insurance / yr
- $507 – $1,088
Fire risk 4/10 · Minor
- Est. fire insurance / yr
- $906 – $1,684
Heat risk 6/10 · Moderate
- Hot days now (above 105°F)
- 7 days/yr
- Hot days in 30 yrs
- 16 days/yr
Wind risk 6/10 · Moderate
- Chance of severe wind over 30 yrs
- 27.0%
Air-quality risk 3/10 · Minor
- Unhealthy air days now
- 2 days/yr
- Unhealthy air days in 30 yrs
- 3 days/yr
Risk factors via First Street. Map © Google.
Why this score? — see what drove the B- grade
The composite is a weighted blend of 9 inputs, each scored 0–100. Each bar is that input's sub-score; the figure is the points it added to the 100-point composite (weight × sub-score).
- Cash flow +23.1/30.0
- Appreciation +10.0/10.0
- ARV discount +7.5/15.0
- DSCR +7.4/10.0
- 1% rule +5.8/10.0
- Schools +3.4/10.0
- Livability +3.1/5.0
- Rent growth +2.5/5.0
- Condition / age +2.5/5.0
$150,000
🖨 Deal sheet 📄 Offer letter ✓ Due diligence
Listing remarks
* HIGHEST AND BEST OFFERS BY MONDAY 5/3/2026 AT 12PM * Looking for your next flip or a high-potential rental? This is the one! Nestled in the growing and highly sought-after area of Locust, this property is a true "diamond in the rough" priced well below market value to SELL FAST and accommodate your vision and renovations. Home is being SOLD AS IS. Originally house was built with 2 bedrooms, but now has 4 Bedrooms
Key facts
- 0.5 acre lot
- 2 parking spots
- Built 1955
Property features AI
Finance
- HOA & community: No HOA
Exterior
- Parking: Detached carport; 2-car carport spaces; Has carport
- Utilities: Well water; Septic system
- Home design: Single-family residential property; Site-built construction; One story; Crawl space foundation
- Construction: Vinyl exterior
- Exterior features: Shed(s) on the property; Publicly maintained road access; Road surfaces are gravel and paved
Interior
- Kitchen: Electric cooktop
- Bedrooms: 2 bedrooms (both on the main level)
- Bathrooms: 1 full bathroom; 1 half bathroom
- Heating & cooling: Heat pump heating; Central air conditioning
- Interior features: Electric cooktop; 2 total rooms
- Laundry & utility: Laundry located in hall
Neighborhood map
What this means for you Summary
Snapshot
- This is a 2-bed/2.0-bath single-family listed at $150k.
Deal economics
- At list price, monthly cash flow is $269 ($3k/yr) — positive.
- The deal already cash-flows at list — no discount required.
- Meets the 1% rule at list price ($2k rent vs $150k).
- Cap rate 8.4% vs local median 2.6% in Locust — top-decile yield for the area; either an underpriced asset or a hidden risk that comps aren't pricing in. Stress-test before assuming the spread holds.
Location & tenants
- Location reads 62/100 on livability (#458 in NC) — a middle-class / working-renter tenant base. Strengths: cost of living A+, housing A+, crime A; Watch: schools D+, amenities F, commute F.
- Stanly County Schools (rural): math 38% / reading 42% proficiency, ranked #113 of 178 in NC (top 64%) — families likely to look elsewhere, expect single-tenant / working-renter base with shorter leases.
- Market conditions: 166 active listings in the ZIP; 367 units permitted in Stanly County in 2024 (0 in 5+ unit buildings).
Forward outlook
- In year one you build about $16k of equity ($1k loan paydown + $15k appreciation (10.0% local appreciation)).
- Stanly County population projected at -10% by 2050 — secular population decline; favor cash flow + early exit over multi-decade hold.
- At projected returns (10.0% appreciation + 3.0% rent growth), your $42k cash investment doubles in ~3 years — after that, you're playing with house money.
- By year 3, paydown + projected appreciation supports a ~$41k cash-out refi (75% LTV) — recoverable capital for the next deal without selling this one.
Negotiation context
- Only 3 days on market — expect competitive offers; lowballing is unlikely to land.
Risks & watch-outs
- Watch-outs: built in 1955 — expect roof / HVAC / electrical / plumbing capex.
- Climate carrying-cost: major wind risk, 27% chance of damaging wind over 30y; extreme-heat days projected 7→16/yr by 2055 (HVAC capex compounding) — expect insurance premiums to compound above CPI over the hold.
Questions for the listing agent
- Built in 1955 — when were the roof, HVAC, electrical panel, plumbing, and water heater last replaced?
- Is there a deadline driving the sale (1031 exchange, divorce, estate, relocation)? That informs how much negotiation room exists.
- Schools are D-rated, which usually means shorter tenancies and higher turnover. Who's the typical renter profile here, and what's been the actual vacancy rate?
- What's the average days-on-market for RENTAL listings here right now (not sales)? A rising rental-DOM trend means longer vacancies and softer asking-rent achievability than the comps imply.
- What's the recent tenant-quality profile in this submarket — average credit score on applications, eviction rate, late-payment / NSF rate, and stable-employment percentage? A property-management company in the area should have these aggregated.
- How much new for-sale + rental construction is in the pipeline within 1–3 miles? Heavy new supply typically softens prices + rents 12–24 months out; constrained supply supports both.
Investment metrics
- 1% rule
- 1.08% ✓
- Cap rate
- 8.44%
- Cash-on-cash
- 7.68%
- DSCR
- 1.34
- GRM
- 7.7
CMA / ARV
- ARV (on-the-fly)
- $424,084
- Comps found
- 8
Show comp detail 8 sales within ~0.75 mi
| Address | Dist | Beds/Ba | Sqft | Sold | Price | $/sf | Match |
|---|---|---|---|---|---|---|---|
| 306 Old Hickory Rd | 0.56mi | 3/2.0 (+1) | 1,940 (-11%) | 1mo | $485,000 | $250 | 49 |
| 218 Old Hickory Rd | 0.35mi | 3/2.5 (+1) | 2,024 (-7%) | 22mo | $550,000 | $272 | 46 |
| 146 Kerri Dawn Ln | 0.70mi | 3/2.5 (+1) | 2,033 (-7%) | 5mo | $359,900 | $177 | 44 |
| 207 Kerri Dawn Ln | 0.63mi | 3/3.0 (+1) | 2,416 (+10%) | 2mo | $450,000 | $186 | 42 |
| 134 Kerri Dawn Ln | 0.71mi | 3/2.5 (+1) | 1,975 (-10%) | 5mo | $370,000 | $187 | 40 |
| 101 Old Hickory Rd | 0.36mi | 3/2.0 (+1) | 2,500 (+14%) | 21mo | $450,000 | $180 | 37 |
| 130 Kerri Dawn Ln | 0.72mi | 3/2.5 (+1) | 1,885 (-14%) | 19mo | $365,000 | $194 | 20 |
| 225 Simpson Rd | 0.69mi | 3/2.0 (+1) | 1,883 (-14%) | 23mo | $435,000 | $231 | 20 |
Match score weights: distance 35% · size 25% · config 20% · recency 20%. Top-matched comps best support the ARV.
Projected returns pro-forma
10.0% appreciation · 3.0% rent growth · sell at horizon
- IRR
- 29.9%
- Equity multiple
- 3.35×
- Total profit
- $98,831
- Equity at exit
- $135,132
- IRR
- 25.9%
- Equity multiple
- 7.61×
- Total profit
- $277,584
- Equity at exit
- $291,417
Cash invested: $42,000 (down + closing). Projections, not guarantees.
Landlord ↔ Tenant lean methodology
- Overall (STATE)
- 85 Strongly Landlord-Friendly
- State North Carolina
- 85 Strongly Landlord-Friendly · R+3
- County
- — inherits STATE
- City
- — inherits STATE
ZIP-level market 28097
- Home prices YoY
- 7.0%
- Active inventory
- 166
- Price-to-rent
- 7.7×
Monthly cashflow live
- Estimated rent
- $1,617 medium interval (Pro) →
- Mortgage (P&I)
- −$787
- Tax from tax record
- −$160 /mo · $1,916/yr
- Insurance
- −$62
- HOA
- −$0
- Vacancy / Maint / Mgmt
- −$340
- Net cashflow
- $269
Break-even live
UW: 25.0% down · 7.5% · 30yr · 1.5% tax · 5.0% vac · 8.0% maint · 8.0% mgmt
Financing live
Cash to close
- Down payment
- $37,500
- Closing costs
- $4,500
- Reserves months
- —
- Total cash needed
- —
Loan-product check · same deal, 3 products live
Conventional
25% down · 7.5% · 30yr
- Down + closing
- —
- Monthly P&I
- —
- Monthly cashflow
- —
- DSCR
- —
- Eligible?
- —
Personal DTI + credit; lowest rate.
DSCR
20% down · 8.5% · 30yr
- Down + closing
- —
- Monthly P&I
- —
- Monthly cashflow
- —
- DSCR
- —
- Eligible?
- —
No personal income docs; deal must DSCR.
Hard money
10% down · 12.0% · 12mo
- Down + closing
- —
- Monthly P&I
- —
- Monthly cashflow
- —
- DSCR
- —
- Eligible?
- —
Short-term bridge; refi at stabilization.
Listing history 2 events
-
2026-05-04status Pending
-
2026-05-01$150,000 Active
ⓘ Source: listings_history table (triggers on properties + properties_extension) + one-shot
backfill from property_details.listing_events for pre-trigger history.
Tax reassessment forecast NC · Resets to sale price
- Current annual tax
- $1,916 · $160/mo
- Projected year-2 tax
- $1,916 · $160/mo
- Expected delta
- $0/yr ($0/mo · 0.0%)
ⓘ Screening estimate from a state-policy table — verify with the county assessor before closing.
Climate risk First Street
- Flood 1/10 Low FEMA zone X (unshaded) · 0% chance over 30 yrs
- Wildfire 4/10 Moderate
- Heat 6/10 Major 7 d/yr ≥105°F today · 16 d/yr by 30 yrs out
- Wind 6/10 Major 27% chance of damaging wind over 30 yrs
- Air quality 3/10 Moderate 2 unhealthy d/yr today · 3 by 30 yrs out
Nearby sold comps map
Loading sold comps map…
Walkable amenities ~0.75 mi
Loading nearby amenities…
Taxation est. · year 1
- Rental income
- $19,409
- − Mortgage interest
- −$8,402
- − Property taxes
- −$1,916
- − Insurance
- −$750
- − Repairs & maintenance
- −$1,553
- − Management
- −$1,553
- − Depreciation
- −$4,364
- Taxable income
- $871
- Est. tax owed @ 24.0%
- −$209
- After-tax cash flow
- $3,018/yr
For passive investors: Depreciation is non-cash, so a rental often shows a tax loss while cash-flowing — sheltering income. Rental losses are passive: they offset passive income freely, and up to $25,000/yr can offset ordinary (W-2) income if you actively participate and your MAGI is under $100k (phasing out to $0 by $150k); unused losses carry forward. On sale, claimed depreciation is recaptured at up to 25%, and gains may owe capital-gains tax (a 1031 exchange can defer both). Figures are a year-1 estimate at your 24.0% rate — not tax advice; consult a CPA.
Schools (NCES district)
- District
- Stanly County Schools
- NCES district ID
- 3704320
- Math proficiency
- 38% ▼ -1.00%
- Reading proficiency
- 42% ▲ 1.00%
- Median HH income
- $43,802
- Composite
- 33.9/100
- National rank
- #5343
- State rank
- #113 of 178 in NC
Livability — Locust
- Score
- 62/100
- State rank
- #458
- US rank
- #16792
Category grades
Schools grade is shown separately in the Schools card above.
Census & demographics
- Census place
- Locust, NC
- Population (ZIP)
- 7,976
Population outlook (Stanly County) Hauer SSP2
- Today (2025)
- 60,082 people
- By 2030
- 59,485 · -1.0%
- By 2040
- 57,407 · -4.5%
- By 2050
- 54,051 · -10.0%
- By 2075
- 45,384 · -24.5%
- By 2100
- 34,694 · -42.3%
Race, ethnicity, and origin ACS 2023
- Neighborhood character
- Predominantly White (94%)
- Race & ethnicity
- White 94% Hispanic / Latino 5% Two or more races 3%
- Common ancestry
- Serbian 4% Slovak 3% Romanian 2%
- Foreign-born
- 1% · Canada
- Languages at home
- 98% English-only · Spanish 1%
Political lean MEDSL · Stanly
- 2024 margin
- Solid R (+50.9) · D 24.2% · R 75.1%
- 2008→2024 swing
- -14.2pp toward R · 2008: -36.7pp · 2024: -50.9pp
- All cycles
- 2024: R+50.9 2020: R+51.1 2016: R+50.2 2012: R+40.4 2008: R+36.7
Not yet ingested
- Civics
- —
Market trends
- HPI YoY
- ▲ 26.92%
- Current HPI
- 409.27
- Rent YoY
- —
- Metro
- —
- State GDP YoY
- ▲ 3.28%
- F500 in state
- 26
Industry mix (Fortune 500 HQ in NC)
| Industry | F500 HQs | Revenue |
|---|---|---|
| Financial Services | 2 | $213B |
|
||
| Retail | 2 | $95B |
|
||
| Industrial Conglomerate | 1 | $38B |
|
||
| Metals / Steel | 1 | $35B |
|
||
| Utilities | 1 | $30B |
|
||
| Industrial Machinery | 1 | $19B |
|
||
Price history
2 events — show timeline
- 2026-05-04 Pending — CANOPYMLS as Distributed by MLS Grid
- 2026-05-01 Listed $150,000 CANOPYMLS as Distributed by MLS Grid
Property tax history
+1.8%/yrLatest (2025): $1,916 · +19.7% YoY. Source: county tax records.
Cash-flow waterfall
monthlySold comps — $/sqft
last 12 mo · ≤1 miLoading sold comps…