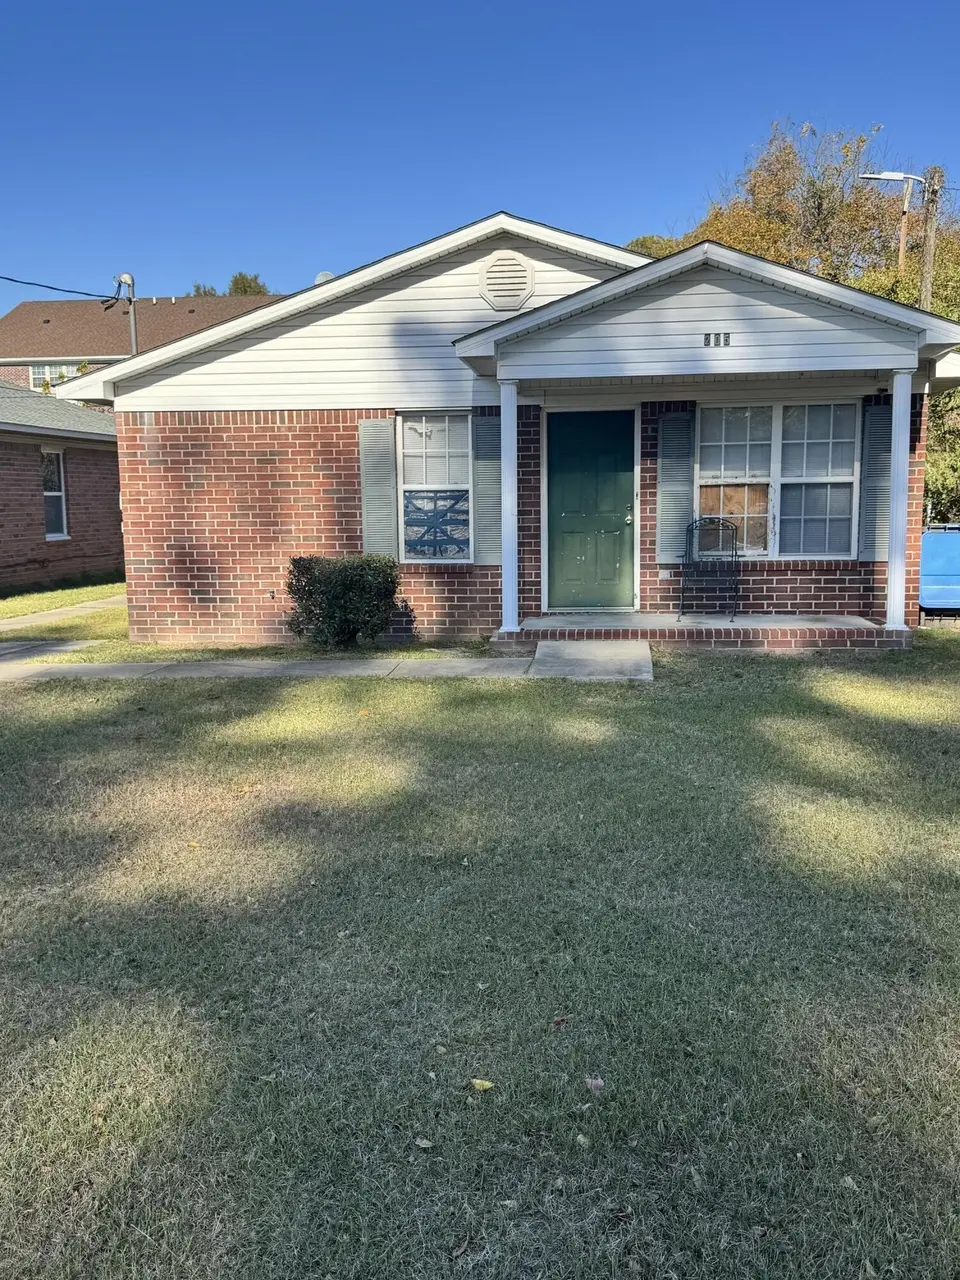
205 Japonica Ave · Augusta-Richmond County consolidated government (balance), GA
Flood risk 1/10 · Minimal
- FEMA flood zone
- X
- Chance of flooding over 30 yrs
- 0.0%
- Est. flood insurance / yr
- $507 – $1,088
Fire risk 1/10 · Minimal
- Est. fire insurance / yr
- $963 – $1,789
Heat risk 8/10 · Major
- Hot days now (above 108°F)
- 7 days/yr
- Hot days in 30 yrs
- 18 days/yr
Wind risk 6/10 · Moderate
- Chance of severe wind over 30 yrs
- 67.0%
Air-quality risk 3/10 · Minor
- Unhealthy air days now
- 3 days/yr
- Unhealthy air days in 30 yrs
- 4 days/yr
Risk factors via First Street. Map © Google.
Why this score? — see what drove the C- grade
The composite is a weighted blend of 9 inputs, each scored 0–100. Each bar is that input's sub-score; the figure is the points it added to the 100-point composite (weight × sub-score).
- Cash flow +17.1/30.0
- Appreciation +9.1/10.0
- DSCR +5.3/10.0
- ARV discount +5.3/15.0
- 1% rule +5.0/10.0
- Livability +2.5/5.0
- Condition / age +2.5/5.0
- Rent growth +2.2/5.0
- Schools +1.3/10.0
$105,000
🖨 Deal sheet 📄 Offer letter ✓ Due diligence
Listing remarks
This all-brick three-bedroom, one-bath home is full of potential and ready for a fresh start. With strong bones and classic charm, it's just waiting for the right buyer to bring it back to life. A few updates and repairs can easily transform this property into a beautiful home or a smart investment opportunity. Schedule your showing today through ShowingTime and see the possibilities for yourself.
Key facts
- 6,534 sq ft lot
- Built 2003
- Listed 38 days
Property features AI
Finance
- Other: Located in the Sunnydale Park subdivision
Exterior
- Parking: Parking pad
- Utilities: Public water; Public sewer
- Home design: Single-family residence; One level
- Construction: Brick construction
- Exterior features: No patio or porch listed; Composition roof
Interior
- Kitchen: Range
- Bedrooms: Total of 5 rooms (bedrooms included in room count)
- Flooring: Other
- Bathrooms: 1 full bathroom; 1 half bathroom
- Heating & cooling: Central air conditioning; Electric forced-air heating
- Interior features: Window coverings; Range (cooking appliance); Other flooring; Crawl space basement (no finished basement)
Neighborhood map
What this means for you Summary
Snapshot
- This is a 2-bed/2.0-bath single-family listed at $105k.
Deal economics
- At list price, monthly cash flow is $72 ($868/yr) — positive.
- The deal already cash-flows at list — no discount required.
- To meet the 1% rule (rent ≥ 1% of price), the offer needs to be $105k (0.5% below list).
- Recommended offer: $102k (3.0% below list) — sets the bar for market timing.
Location & tenants
- Location reads: area grade C — affects rentability + tenant quality, not the cash-flow math above.
- Richmond County (urban): math 12% / reading 20% proficiency, ranked #154 of 174 in GA (top 88%) — low school quality limits family demand, transient renter base, plan for 1-2y turnover; 72% free/reduced lunch — lower-income household profile, screen leases tightly.
- Zoned schools: W.S. Hornsby Elementary School (math 2% / reading 2%, grade F, #1,204 of 1,228 statewide, top 100%, 567 students, 98% FRL) — zoned schools average 98% FRL vs 72% district-wide (26 pts higher); higher-poverty schools than district average — tighter screening recommended.
- Zoned-school proficiency averages 2% at this address vs 16% district-wide (-14 pts) — the specific schools serving this property underperform the Richmond County average; the district grade overstates school quality for this exact location.
- Market conditions: Rents soft (-1.3%/yr); 129 active listings in the ZIP; 29 comparable units currently listed for rent nearby; rentals lingering (median 44d on market — plan ~5-8 weeks vacancy on turnover, expect pricing pressure); 52% of comp listings sitting > 30 days — soft ceiling on asking rent; lower-income renter base — watch delinquency; 561 units permitted in Richmond County in 2024 (0 in 5+ unit buildings).
Forward outlook
- In year one you build about $9k of equity ($726 loan paydown + $9k appreciation (8.2% local appreciation)).
- Richmond County population projected to shrink 5% by 2050 — rents likely to lag national; underwrite the cash flow, not the appreciation.
- At projected returns (8.2% appreciation + 0.0% rent growth), your $29k cash investment doubles in ~3 years — after that, you're playing with house money.
- By year 4, paydown + projected appreciation supports a ~$32k cash-out refi (75% LTV) — recoverable capital for the next deal without selling this one.
Negotiation context
- It's been on market 38 days — a 3% lower offer ($102k) is reasonable based on typical stale-listing flexibility.
- 3 sale attempts with the ask held roughly flat each time — persistent listings suggest the price (not the market) is what's stuck; bring a comps-based counter.
- Current owner paid $23k; list at $105k implies a 351% gain — meaningful room to come down on a strong offer.
Risks & watch-outs
- Climate carrying-cost: major wind risk, 67% chance of damaging wind over 30y; extreme-heat days projected 7→18/yr by 2055 (HVAC capex compounding) — expect insurance premiums to compound above CPI over the hold.
Questions for the listing agent
- It's been on market 38 days. Have you received any prior offers? Is the seller open to a 3% concession, seller financing, or rate buy-down credit?
- Is there a deadline driving the sale (1031 exchange, divorce, estate, relocation)? That informs how much negotiation room exists.
- What's the average days-on-market for RENTAL listings here right now (not sales)? A rising rental-DOM trend means longer vacancies and softer asking-rent achievability than the comps imply.
- What's the recent tenant-quality profile in this submarket — average credit score on applications, eviction rate, late-payment / NSF rate, and stable-employment percentage? A property-management company in the area should have these aggregated.
- How much new for-sale + rental construction is in the pipeline within 1–3 miles? Heavy new supply typically softens prices + rents 12–24 months out; constrained supply supports both.
Investment metrics
- 1% rule
- 1.00% ✗
- Cap rate
- 7.12%
- Cash-on-cash
- 2.95%
- DSCR
- 1.13
- GRM
- 8.4
CMA / ARV
- ARV (median comp)
- $100,174
- List price
- $105,000
- Delta
- 4.82%
- Verdict
- FAIR
- Comps
- 20 within 1.0 mi
Show comp detail 12 sales within ~0.75 mi
| Address | Dist | Beds/Ba | Sqft | Sold | Price | $/sf | Match |
|---|---|---|---|---|---|---|---|
| 109 E E Walker St | 0.20mi | 3/1.5 (+1) | 1,100 (-3%) | 1mo | $50,000 | $45 | 78 |
| 121 Greene St | 0.44mi | 2/2.0 | 1,164 (+3%) | 6mo | $187,500 | $161 | 70 |
| 419 Fairhope St | 0.57mi | 3/2.0 (+1) | 1,155 (+2%) | 1mo | $168,000 | $145 | 65 |
| 103 Ellis St | 0.42mi | 2/2.0 | 1,195 (+5%) | 9mo | $215,000 | $180 | 64 |
| 395 Azalea Ave | 0.10mi | 3/1.0 (+1) | 1,040 (-8%) | 15mo | $40,000 | $38 | 60 |
| 637 Sea Isle Dr | 0.44mi | 3/1.5 (+1) | 1,224 (+8%) | 9mo | $105,000 | $86 | 52 |
| 415 Aiken St | 0.32mi | 3/1.5 (+1) | 1,260 (+11%) | 10mo | $150,400 | $119 | 51 |
| 526 Laney Walker Blvd | 0.56mi | 3/2.0 (+1) | 1,160 (+2%) | 17mo | $58,900 | $51 | 51 |
| 301 E View Dr | 0.65mi | 3/1.5 (+1) | 1,260 (+11%) | 1mo | $45,000 | $36 | 44 |
| 119 Telfair St | 0.41mi | 2/1.0 | 968 (-15%) | 13mo | $45,000 | $46 | 42 |
| 615 Aiken St | 0.54mi | 3/1.5 (+1) | 1,300 (+15%) | 2mo | $144,000 | $111 | 41 |
| 257 Watkins St | 0.60mi | 3/1.0 (+1) | 973 (-14%) | 11mo | $69,900 | $72 | 30 |
Match score weights: distance 35% · size 25% · config 20% · recency 20%. Top-matched comps best support the ARV.
Projected returns pro-forma
8.18% appreciation · 0.0% rent growth · sell at horizon
- IRR
- 21.4%
- Equity multiple
- 2.57×
- Total profit
- $46,042
- Equity at exit
- $81,062
- IRR
- 18.8%
- Equity multiple
- 5.24×
- Total profit
- $124,674
- Equity at exit
- $162,155
Cash invested: $29,400 (down + closing). Projections, not guarantees.
Landlord ↔ Tenant lean methodology
- Overall (STATE)
- 90 Strongly Landlord-Friendly
- State Georgia
- 90 Strongly Landlord-Friendly · R+3
- County
- — inherits STATE
- City
- — inherits STATE
ZIP-level market 30901
- Home prices YoY
- 4.1%
- Rents YoY
- -1.3%
- Active inventory
- 129
- Price-to-rent
- 8.4×
Monthly cashflow live
- Estimated rent
- $1,045 high interval (Pro) →
- Mortgage (P&I)
- −$551
- Tax from tax record
- −$159 /mo · $1,907/yr
- Insurance
- −$44
- HOA
- −$0
- Vacancy / Maint / Mgmt
- −$219
- Net cashflow
- $72
Break-even live
UW: 25.0% down · 7.5% · 30yr · 1.5% tax · 5.0% vac · 8.0% maint · 8.0% mgmt
Financing live
Cash to close
- Down payment
- $26,250
- Closing costs
- $3,150
- Reserves months
- —
- Total cash needed
- —
Loan-product check · same deal, 3 products live
Conventional
25% down · 7.5% · 30yr
- Down + closing
- —
- Monthly P&I
- —
- Monthly cashflow
- —
- DSCR
- —
- Eligible?
- —
Personal DTI + credit; lowest rate.
DSCR
20% down · 8.5% · 30yr
- Down + closing
- —
- Monthly P&I
- —
- Monthly cashflow
- —
- DSCR
- —
- Eligible?
- —
No personal income docs; deal must DSCR.
Hard money
10% down · 12.0% · 12mo
- Down + closing
- —
- Monthly P&I
- —
- Monthly cashflow
- —
- DSCR
- —
- Eligible?
- —
Short-term bridge; refi at stabilization.
Rent comps 29 comps
| Address | Beds | Baths | Sqft | Rent | $/sqft | DOM | Units | Dist |
|---|---|---|---|---|---|---|---|---|
| 420 E Boundary Augusta, GA | 2.0 | 1.0 | 950 | $850 | $0.89 | 43d | 1 | 0.22mi |
| 106 Ellis St Augusta, GA | 1.0 | 1.0 | 850 | $975 | $1.15 | 43d | 1 | 0.45mi |
| 134 Broad St Augusta, GA | 2.0 | 1.0 | 1100 | $1,150 | $1.05 | 43d | 1 | 0.54mi |
| 136 Broad St Augusta, GA | 2.0 | 1.0 | 1200 | $1,100 | $0.92 | 43d | 1 | 0.55mi |
| 204 Ellis St Augusta, GA | 2.0 | 1.0 | 1029 | $1,350 | $1.31 | 14d | 1 | 0.56mi |
| 133 Broad St Unit A Augusta, GA | 2.0 | 2.0 | 1000 | $975 | $0.97 | 43d | 1 | 0.56mi |
| 133 Broad St Unit B Augusta, GA | 1.0 | 1.0 | 1000 | $800 | $0.80 | 43d | 1 | 0.56mi |
| 133 Broad St Unit A Augusta, GA | 2.0 | 2.0 | 1000 | $975 | $0.97 | 23d | 1 | 0.56mi |
| 211 Broad St Augusta, GA | 3.0 | 2.0 | 1200 | $1,350 | $1.12 | 43d | 1 | 0.61mi |
| 239 Greene St Augusta, GA | 1.0 | 1.0 | 700 | $825 | $1.18 | 43d | 1 | 0.61mi |
| 239 Greene St Unit A-3 Augusta, GA | 1.0 | 1.0 | 700 | $800 | $1.14 | 23d | 1 | 0.62mi |
| 329 E View Dr Augusta, GA | 3.0 | 1.5 | 1260 | $1,300 | $1.03 | 23d | 1 | 0.62mi |
| 240 Ellis St Unit B Augusta, GA | 1.0 | 1.0 | 800 | $925 | $1.16 | 23d | 1 | 0.66mi |
| 320 3rd St Augusta, GA | 2.0 | 1.0 | 1117 | $1,200 | $1.07 | 43d | 1 | 0.68mi |
| 821 Forsythe St Augusta, GA | 2.0 | 1.0 | 754 | $895 | $1.19 | 14d | 1 | 0.68mi |
| 305 Walker St Unit A Augusta, GA | 2.0 | 1.0 | 925 | $925 | $1.00 | 43d | 1 | 0.70mi |
| 305 Walker St Unit A Augusta, GA | 2.0 | 1.0 | 925 | $925 | $1.00 | 23d | 1 | 0.70mi |
| 112 3rd St Apt F Augusta, GA | 2.0 | 1.0 | 754 | $990 | $1.31 | 14d | 1 | 0.72mi |
| 110 3rd St Unit A Augusta, GA | 1.0 | 1.0 | 906 | $760 | $0.84 | 23d | 1 | 0.72mi |
| 110 3rd St Unit A Augusta, GA | 1.0 | 1.0 | 906 | $760 | $0.84 | 43d | 1 | 0.72mi |
| 108 3rd St Unit A Augusta, GA | 2.0 | 1.0 | 754 | $900 | $1.19 | 43d | 1 | 0.73mi |
| 108 3rd St Unit A Augusta, GA | 2.0 | 1.0 | 754 | $900 | $1.19 | 23d | 1 | 0.73mi |
| 410 4th St Unit A Augusta, GA | 2.0 | 1.5 | 925 | $985 | $1.06 | 23d | 1 | 0.80mi |
| 106 Tybee Ct Augusta, GA | 3.0–4.0 | 2.0 | 1336 | $1,071 | $0.80 | 43d | 4 | 0.84mi |
| 537 Watkins St Unit B Augusta, GA | 1.0 | 1.0 | 725 | $705 | $0.97 | 43d | 1 | 1.08mi |
| 212 7th St Unit 301 Augusta, GA | 1.0 | 1.0 | 830 | $1,095 | $1.32 | 23d | 1 | 1.27mi |
| 714 Broad St Augusta, GA | 1.0 | 1.0 | 1000 | $895 | $0.90 | 14d | 1 | 1.31mi |
| 828 Broad St Unit B Augusta, GA | 2.0 | 1.0 | 750 | $995 | $1.33 | 43d | 1 | 1.45mi |
| 828 Broad St Augusta, GA | 2.0 | 1.0 | 750 | $995 | $1.33 | 23d | 1 | 1.45mi |
Listing history 21 events
-
2026-06-18days on market $105,000 Active 38 DOM
-
2026-06-17days on market $105,000 Active 37 DOM
-
2026-06-16days on market $105,000 Active 36 DOM
-
2026-06-15days on market $105,000 Active 35 DOM
-
2026-06-14days on market $105,000 Active 33 DOM
-
2026-06-10days on market $105,000 Active 30 DOM
-
2026-06-09days on market $105,000 Active 29 DOM
-
2026-06-08days on market $105,000 Active 28 DOM
-
2026-06-07days on market $105,000 Active 27 DOM
-
2026-06-03days on market $105,000 Active 23 DOM
-
2026-06-02days on market $105,000 Active 22 DOM
-
2026-06-01days on market $105,000 Active 21 DOM
-
2026-05-31days on market $105,000 Active 20 DOM
-
2026-05-30days on market $105,000 Active 19 DOM
-
2026-04-13status Active
-
2026-04-13price $105,000
-
2026-03-30status Pending
-
2026-03-30historical
-
2025-11-13$110,000 Active
-
2025-11-13$105,000 Active 400-char remark
-
2001-08-06soldstatus $23,259
ⓘ Source: listings_history table (triggers on properties + properties_extension) + one-shot
backfill from property_details.listing_events for pre-trigger history.
Tax reassessment forecast GA · Resets to sale price
- Current annual tax
- $1,907 · $159/mo
- Projected year-2 tax
- $1,907 · $159/mo
- Expected delta
- $0/yr ($0/mo · -0.0%)
ⓘ Screening estimate from a state-policy table — verify with the county assessor before closing.
Climate risk First Street
- Flood 1/10 Low FEMA zone X · 0% chance over 30 yrs
- Wildfire 1/10 Low
- Heat 8/10 Severe 7 d/yr ≥108°F today · 18 d/yr by 30 yrs out
- Wind 6/10 Major 67% chance of damaging wind over 30 yrs
- Air quality 3/10 Moderate 3 unhealthy d/yr today · 4 by 30 yrs out
Nearby sold comps map
Loading sold comps map…
Walkable amenities ~0.75 mi
Loading nearby amenities…
Taxation est. · year 1
- Rental income
- $12,540
- − Mortgage interest
- −$5,882
- − Property taxes
- −$1,907
- − Insurance
- −$525
- − Repairs & maintenance
- −$1,003
- − Management
- −$1,003
- − Depreciation
- −$3,055
- Taxable loss
- −$834
- Est. tax savings @ 24.0%
- +$200
- After-tax cash flow
- $1,068/yr
For passive investors: Depreciation is non-cash, so a rental often shows a tax loss while cash-flowing — sheltering income. Rental losses are passive: they offset passive income freely, and up to $25,000/yr can offset ordinary (W-2) income if you actively participate and your MAGI is under $100k (phasing out to $0 by $150k); unused losses carry forward. On sale, claimed depreciation is recaptured at up to 25%, and gains may owe capital-gains tax (a 1031 exchange can defer both). Figures are a year-1 estimate at your 24.0% rate — not tax advice; consult a CPA.
Schools (NCES district)
- District
- Richmond County
- NCES district ID
- 1304380
- Math proficiency
- 12% ▼ -9.00%
- Reading proficiency
- 20% ▼ -6.00%
- Median HH income
- $38,069
- Composite
- 13.43/100
- National rank
- #9524
- State rank
- #154 of 174 in GA
Livability — Augusta-Richmond County consolidated government (balance)
No livability data for this city. (Only ~50 U.S. cities are tracked.)
Census & demographics
- Census place
- Augusta-Richmond County consolidated government (balance), GA
- County
- Richmond County · 190,917 people
- City population
- 154,035
- Metro
- Augusta-Richmond County, GA-SC
- Population (ZIP)
- 16,484
- Household income
- $25,163
- Rent vs Own
- Severe rent burden
- 2063.0
Population outlook (Richmond County) Hauer SSP2
- Today (2025)
- 200,753 people
- By 2030
- 200,232 · -0.3%
- By 2040
- 196,813 · -2.0%
- By 2050
- 190,347 · -5.2%
- By 2075
- 172,496 · -14.1%
- By 2100
- 146,284 · -27.1%
Race, ethnicity, and origin ACS 2023
- Neighborhood character
- Predominantly Black (78%)
- Race & ethnicity
- Black 78% White 15% Two or more races 4% Hispanic / Latino 2%
- Common ancestry
- Lithuanian 1% Slovak 1%
- Foreign-born
- 1% · Canada
- Languages at home
- 97% English-only · Spanish 1%
Political lean MEDSL · Richmond
- 2024 margin
- Solid D (+36.1) · D 67.8% · R 31.7%
- 2008→2024 swing
- +4.3pp toward D · 2008: 31.8pp · 2024: 36.1pp
- All cycles
- 2024: D+36.1 2020: D+37.2 2016: D+32.4 2012: D+33.8 2008: D+31.8
Not yet ingested
- Civics
- —
Market trends
- HPI YoY
- ▲ 8.18%
- Current HPI
- 206.3145
- Rent YoY
- ▼ -1.31%
- Metro
- Augusta-Richmond County, GA-SC
- State GDP YoY
- ▲ 2.66%
- F500 in state
- 28
Industry mix (Fortune 500 HQ in GA)
| Industry | F500 HQs | Revenue |
|---|---|---|
| Paper / Packaging | 2 | $29B |
|
||
| Retail | 1 | $160B |
|
||
| Transportation / Logistics | 1 | $91B |
|
||
| Airlines | 1 | $62B |
|
||
| Consumer Goods | 1 | $47B |
|
||
| Utilities | 1 | $25B |
|
||
Price history
+351.4% since first listed7 events — show timeline
- 2026-04-13 Relisted — Hive MLS
- 2026-04-13 Price Changed $105,000 Hive MLS
- 2026-03-30 Pending — Hive MLS
- 2026-03-30 Listing Removed — Hive MLS
- 2025-11-13 Listed $105,000 Hive MLS
- 2025-11-13 Listed $110,000 Hive MLS
- 2001-08-06 Sold (Public Records) $23,259 Public Records
Property tax history
+4.5%/yrLatest (2025): $1,907 · -11.1% YoY. Source: county tax records.
Cash-flow waterfall
monthlySold comps — $/sqft
last 12 mo · ≤1 miLoading sold comps…