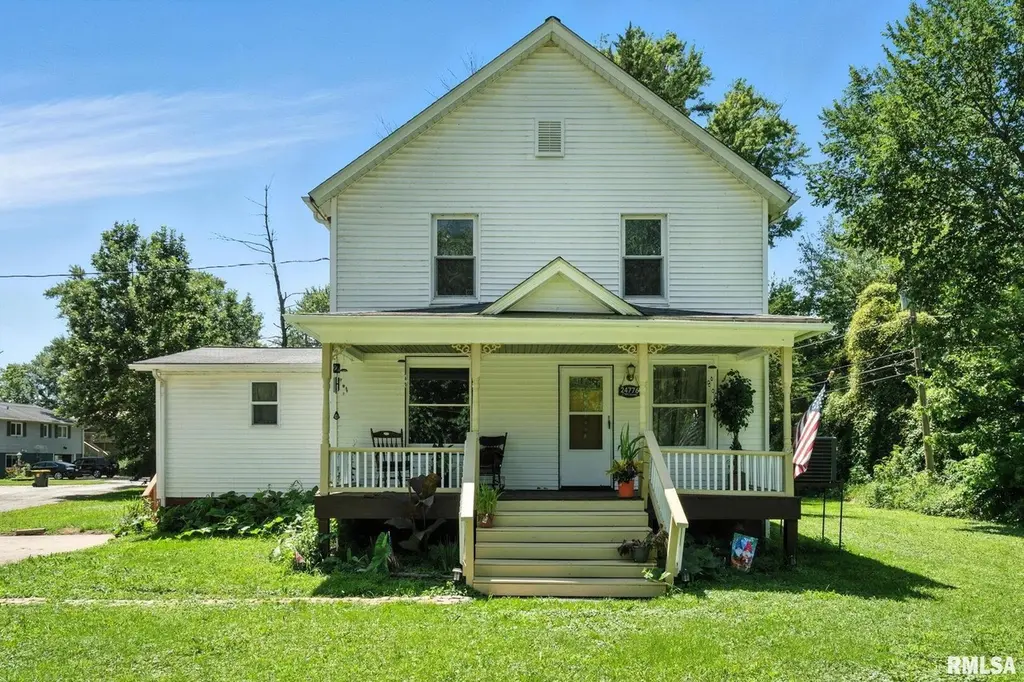
24776 178th St · Bettendorf, IA
Flood risk 10/10 · Severe
- FEMA flood zone
- AE
- Chance of flooding over 30 yrs
- 1.0%
- Est. flood insurance / yr
- $2,026 – $9,024
Fire risk 1/10 · Minimal
- Est. fire insurance / yr
- $902 – $1,676
Heat risk 3/10 · Minor
- Hot days now (above 103°F)
- 7 days/yr
- Hot days in 30 yrs
- 16 days/yr
Wind risk 2/10 · Minimal
- Chance of severe wind over 30 yrs
- —
Air-quality risk 2/10 · Minimal
- Unhealthy air days now
- 1 days/yr
- Unhealthy air days in 30 yrs
- 2 days/yr
Risk factors via First Street. Map © Google.
Why this score? — see what drove the A grade
The composite is a weighted blend of 9 inputs, each scored 0–100. Each bar is that input's sub-score; the figure is the points it added to the 100-point composite (weight × sub-score).
- Cash flow +30.0/30.0
- ARV discount +14.5/15.0
- 1% rule +10.0/10.0
- DSCR +10.0/10.0
- Schools +7.6/10.0
- Appreciation +7.3/10.0
- Livability +4.0/5.0
- Rent growth +2.5/5.0
- Condition / age +2.5/5.0
$184,000
🖨 Deal sheet 📄 Offer letter ✓ Due diligence
Listing remarks MLS
Come check out this 2-story, 3-bedroom, 2-full bath, 2-car Pleasant Valley home, located on a 3/4 acre lot. This charming home features a bright and cheery kitchen, living room, full bath, and laundry area on the main level, as well as 3 bedrooms and an additional full bath on the upper level. There is so much potential with the large unfinished attic! Updates per seller include: new doors, AC (2024). Enjoy the beautiful view while relaxing in your yard. Schedule your showing today!
Key facts
- Beautiful view
- Ac 2024
- New doors
Tags
Neighborhood map
What this means for you Summary
Snapshot
- This is a 4-bed/2.0-bath single-family listed at $184k.
Deal economics
- At list price, monthly cash flow is $958 ($11k/yr) — positive.
- The deal already cash-flows at list — no discount required.
- Meets the 1% rule at list price ($3k rent vs $184k).
- Recommended offer: $173k (6.0% below list) — sets the bar for market timing.
- Cap rate 15.5% vs local median 3.0% in Bettendorf — top-decile yield for the area; either an underpriced asset or a hidden risk that comps aren't pricing in. Stress-test before assuming the spread holds.
Location & tenants
- Location reads 81/100 on livability (#73 in IA, #1,579 nationally) — a professional / high-income tenant draw. Strengths: schools A+, crime A+, employment A+; Watch: amenities F, commute F.
- Pleasant Valley Community School District (suburban): math 87% / reading 85% proficiency, ranked #5 of 289 in IA (top 2%) — strong family-tenant draw, lease renewals of 3-5y typical; only 8% free/reduced lunch — higher-income household profile.
- Market conditions: 5 active listings in the ZIP; 1 comparable units currently listed for rent nearby; 805 units permitted in Scott County in 2024 (479 in 5+ unit buildings).
Forward outlook
- In year one you build about $10k of equity ($1k loan paydown + $8k appreciation (4.5% local appreciation)).
- Scott County population projected at +19% by 2050 — long-run rental-demand tailwind backs the buy-and-hold thesis.
- At projected returns (4.5% appreciation + 3.0% rent growth), your $52k cash investment doubles in ~3 years — after that, you're playing with house money.
- By year 4, paydown + projected appreciation supports a ~$32k cash-out refi (75% LTV) — recoverable capital for the next deal without selling this one.
Negotiation context
- It's been on market 71 days — a 6% lower offer ($173k) is reasonable based on typical stale-listing flexibility.
- 11 sale attempts since 10y ago with the ask held roughly flat each time — persistent listings suggest the price (not the market) is what's stuck; bring a comps-based counter.
Risks & watch-outs
- Watch-outs: flood insurance adds $460/mo; built in 1900 — expect roof / HVAC / electrical / plumbing capex.
- Climate carrying-cost: in FEMA flood zone AE (mandatory federal flood insurance) — expect insurance premiums to compound above CPI over the hold.
Questions for the listing agent
- It's been on market 71 days. Have you received any prior offers? Is the seller open to a 6% concession, seller financing, or rate buy-down credit?
- Built in 1900 — when were the roof, HVAC, electrical panel, plumbing, and water heater last replaced?
- What's the actual annual flood-insurance premium (NFIP or private), and is the property in a SFHA with mandatory coverage?
- Why hasn't it sold? Are there any deal-killer items the seller is aware of (foundation, flood, title, zoning, code violations)?
- Is there a deadline driving the sale (1031 exchange, divorce, estate, relocation)? That informs how much negotiation room exists.
- Schools are A-rated — typically a magnet for longer-tenancy family renters. What's the average tenant stay here, and is there a school-zone premium baked into asking?
- What's the average days-on-market for RENTAL listings here right now (not sales)? A rising rental-DOM trend means longer vacancies and softer asking-rent achievability than the comps imply.
- What's the recent tenant-quality profile in this submarket — average credit score on applications, eviction rate, late-payment / NSF rate, and stable-employment percentage? A property-management company in the area should have these aggregated.
- How much new for-sale + rental construction is in the pipeline within 1–3 miles? Heavy new supply typically softens prices + rents 12–24 months out; constrained supply supports both.
Investment metrics
- 1% rule
- 1.79% ✓
- Cap rate
- 15.54%
- Cash-on-cash
- 33.03%
- DSCR
- 2.47
- GRM
- 4.6
CMA / ARV
- ARV (median comp)
- $218,119
- List price
- $184,000
- Delta
- -15.64%
- Verdict
- UNDERPRICED
- Comps
- 19 within 1.0 mi
Show comp detail 1 sale within ~0.75 mi
| Address | Dist | Beds/Ba | Sqft | Sold | Price | $/sf | Match |
|---|---|---|---|---|---|---|---|
| 24784 Valley Dr | 0.33mi | 3/2.5 (-1) | 1,403 (-14%) | 3mo | $208,000 | $148 | 52 |
Match score weights: distance 35% · size 25% · config 20% · recency 20%. Top-matched comps best support the ARV.
Projected returns pro-forma
4.53% appreciation · 3.0% rent growth · sell at horizon
- IRR
- 31.5%
- Equity multiple
- 2.92×
- Total profit
- $98,771
- Equity at exit
- $99,042
- IRR
- 30.5%
- Equity multiple
- 5.83×
- Total profit
- $248,878
- Equity at exit
- $166,758
Cash invested: $51,520 (down + closing). Projections, not guarantees.
Landlord ↔ Tenant lean methodology
- Overall (STATE)
- 83 Strongly Landlord-Friendly
- State Iowa
- 83 Strongly Landlord-Friendly · R+6
- County
- — inherits STATE
- City
- — inherits STATE
ZIP-level market 52767
- Home prices YoY
- 2.7%
- Active inventory
- 5
- Price-to-rent
- 4.6×
Monthly cashflow live
- Estimated rent
- $3,300 medium interval (Pro) →
- Mortgage (P&I)
- −$965
- Tax from tax record
- −$147 /mo · $1,768/yr
- Insurance
- −$77
- Flood insurance flood zone
- −$460 /mo · $5,525/yr
- HOA
- −$0
- Vacancy / Maint / Mgmt
- −$693
- Net cashflow
- $958
Break-even live
UW: 25.0% down · 7.5% · 30yr · 1.5% tax · 5.0% vac · 8.0% maint · 8.0% mgmt
Financing live
Cash to close
- Down payment
- $46,000
- Closing costs
- $5,520
- Reserves months
- —
- Total cash needed
- —
Loan-product check · same deal, 3 products live
Conventional
25% down · 7.5% · 30yr
- Down + closing
- —
- Monthly P&I
- —
- Monthly cashflow
- —
- DSCR
- —
- Eligible?
- —
Personal DTI + credit; lowest rate.
DSCR
20% down · 8.5% · 30yr
- Down + closing
- —
- Monthly P&I
- —
- Monthly cashflow
- —
- DSCR
- —
- Eligible?
- —
No personal income docs; deal must DSCR.
Hard money
10% down · 12.0% · 12mo
- Down + closing
- —
- Monthly P&I
- —
- Monthly cashflow
- —
- DSCR
- —
- Eligible?
- —
Short-term bridge; refi at stabilization.
Rent comps 1 comps
| Address | Beds | Baths | Sqft | Rent | $/sqft | DOM | Units | Dist |
|---|---|---|---|---|---|---|---|---|
| 821 1st Ave Hampton, IL | 3.0 | 2.5 | 1750 | $3,300 | $1.89 | 13d | 1 | 0.58mi |
Listing history 50 events
-
2026-06-18days on market $184,000 Active 71 DOM
-
2026-06-17days on market $184,000 Active 70 DOM
-
2026-06-16days on market $184,000 Active 69 DOM
-
2026-06-15days on market $184,000 Active 68 DOM
-
2026-06-14days on market $184,000 Active 66 DOM
-
2026-06-13days on market $184,000 Active 65 DOM
-
2026-06-10days on market $184,000 Active 63 DOM
-
2026-06-09days on market $184,000 Active 62 DOM
-
2026-06-08days on market $184,000 Active 61 DOM
-
2026-06-07days on market $184,000 Active 60 DOM
-
2026-06-05days on market $184,000 Active 57 DOM
-
2026-06-03days on market $184,000 Active 56 DOM
-
2026-06-02days on market $184,000 Active 55 DOM
-
2026-06-01days on market $184,000 Active 54 DOM
-
2026-05-31days on market $184,000 Active 53 DOM
-
2026-05-30days on market $184,000 Active 52 DOM
-
2026-04-08$184,000 Active 488-char remark
Show marketing remark (488 chars)
Come check out this 2-story, 3-bedroom, 2-full bath, 2-car Pleasant Valley home, located on a 3/4 acre lot. This charming home features a bright and cheery kitchen, living room, full bath, and laundry area on the main level, as well as 3 bedrooms and an additional full bath on the upper level. There is so much potential with the large unfinished attic! Updates per seller include: new doors, AC (2024). Enjoy the beautiful view while relaxing in your yard. Schedule your showing today!
-
2026-04-06historical
-
2026-01-18status Active
-
2026-01-14historical
-
2026-01-08status Active
-
2026-01-06historical
-
2026-01-05historical
-
2025-12-17historical
-
2025-10-07historical
-
2025-10-06Active
-
2025-07-25Active
-
2024-08-23soldstatus $170,000
-
2024-08-20soldstatus $170,000 Closed
-
2024-08-20soldstatus $170,000
-
2024-06-03historical Under Contract
-
2024-04-14status Active
-
2024-03-22historical Under Contract
-
2024-02-01price $185,000
-
2024-02-01$195,000 Active
-
2024-02-01$185,000
-
2024-01-23historical
-
2024-01-23historical
-
2023-11-21price
-
2023-10-27Active
-
2021-08-06historical
-
2021-08-06historical
-
2021-08-06historical
-
2021-08-06historical
-
2021-08-06historical
-
2021-02-19soldstatus $20,500
-
2016-08-03soldstatus $76,500
-
2016-08-03soldstatus $76,500
-
2016-05-24$76,500
-
2016-05-24$76,500
ⓘ Source: listings_history table (triggers on properties + properties_extension) + one-shot
backfill from property_details.listing_events for pre-trigger history.
Tax reassessment forecast IA · Partial reset (capped growth)
- Current annual tax
- $1,768 · $147/mo
- Projected year-2 tax
- $2,328 · $194/mo
- Expected delta
- +$560/yr (+$47/mo · 31.7%)
ⓘ Screening estimate from a state-policy table — verify with the county assessor before closing.
Climate risk First Street
- Flood 10/10 Extreme FEMA zone AE · 100% chance over 30 yrs
- Wildfire 1/10 Low
- Heat 3/10 Moderate 7 d/yr ≥103°F today · 16 d/yr by 30 yrs out
- Wind 2/10 Low
- Air quality 2/10 Low 1 unhealthy d/yr today · 2 by 30 yrs out
Nearby sold comps map
Loading sold comps map…
Walkable amenities ~0.75 mi
Loading nearby amenities…
Taxation est. · year 1
- Rental income
- $39,600
- − Mortgage interest
- −$10,307
- − Property taxes
- −$1,768
- − Insurance
- −$6,445
- − Repairs & maintenance
- −$3,168
- − Management
- −$3,168
- − Depreciation
- −$5,353
- Taxable income
- $9,391
- Est. tax owed @ 24.0%
- −$2,254
- After-tax cash flow
- $9,238/yr
For passive investors: Depreciation is non-cash, so a rental often shows a tax loss while cash-flowing — sheltering income. Rental losses are passive: they offset passive income freely, and up to $25,000/yr can offset ordinary (W-2) income if you actively participate and your MAGI is under $100k (phasing out to $0 by $150k); unused losses carry forward. On sale, claimed depreciation is recaptured at up to 25%, and gains may owe capital-gains tax (a 1031 exchange can defer both). Figures are a year-1 estimate at your 24.0% rate — not tax advice; consult a CPA.
Schools (NCES district)
- District
- Pleasant Valley Community School District
- NCES district ID
- 1923110
- Math proficiency
- 87% ▼ -4.00%
- Reading proficiency
- 85% ▼ -2.00%
- Median HH income
- $80,716
- Composite
- 75.59/100
- National rank
- #130
- State rank
- #5 of 289 in IA
Livability — Bettendorf
- Score
- 81/100
- State rank
- #73
- US rank
- #1579
Category grades
Schools grade is shown separately in the Schools card above.
Census & demographics
- City population
- 41,264
- Population (ZIP)
- 287
Population outlook (Scott County) Hauer SSP2
- Today (2025)
- 188,878 people
- By 2030
- 196,648 · +4.1%
- By 2040
- 210,860 · +11.6%
- By 2050
- 224,359 · +18.8%
- By 2075
- 258,884 · +37.1%
- By 2100
- 286,447 · +51.7%
Race, ethnicity, and origin ACS 2023
- Neighborhood character
- Predominantly White (85%)
- Race & ethnicity
- White 85% Two or more races 12% Black 3% Hispanic / Latino 2%
- Common ancestry
- Romanian 7% Portuguese 2%
Political lean MEDSL · Scott
- 2024 margin
- Toss-up / Even · D 47.3% · R 51.2% · Other 1.4%
- 2008→2024 swing
- -18.4pp toward R · 2008: 14.6pp · 2024: -3.9pp
- All cycles
- 2024: R+3.9 2020: D+3.5 2016: D+1.4 2012: D+13.8 2008: D+14.6
Not yet ingested
- Civics
- —
Market trends
- HPI YoY
- ▲ 4.53%
- Current HPI
- 170.5405
- Rent YoY
- —
- Metro
- —
- State GDP YoY
- ▲ 2.48%
- F500 in state
- 4
Industry mix (Fortune 500 HQ in IA)
| Industry | F500 HQs | Revenue |
|---|---|---|
| Financial Services | 1 | $16B |
|
||
| Retail / Convenience | 1 | $15B |
|
||
Price history
+140.5% since first listed34 events — show timeline
- 2026-04-08 Listed $184,000 MRED as Distributed by MLS Grid
- 2026-04-06 Listing Removed — MRED as Distributed by MLS Grid
- 2026-01-18 Relisted — MRED as Distributed by MLS Grid
- 2026-01-14 Listing Removed — MRED as Distributed by MLS Grid
- 2026-01-08 Relisted — MRED as Distributed by MLS Grid
- 2026-01-06 Listing Removed — RMLSA as Distributed by MLS Grid
- 2026-01-05 Listing Removed — MRED as Distributed by MLS Grid
- 2025-12-17 Listing Removed — MRED as Distributed by MLS Grid
- 2025-10-07 Listing Removed — RMLSA as Distributed by MLS Grid
- 2025-10-06 Listed — RMLSA as Distributed by MLS Grid
- 2025-07-25 Listed — RMLSA as Distributed by MLS Grid
- 2024-08-23 Sold (Public Records) $170,000 Public Records
- 2024-08-20 Sold (MLS) $170,000 MRED as Distributed by MLS Grid
- 2024-08-20 Sold (MLS) $170,000 RMLSA as Distributed by MLS Grid
- 2024-06-03 Contingent — RMLSA as Distributed by MLS Grid
- 2024-04-14 Relisted — RMLSA as Distributed by MLS Grid
- 2024-03-22 Contingent — RMLSA as Distributed by MLS Grid
- 2024-02-01 Price Changed $185,000 RMLSA as Distributed by MLS Grid
- 2024-02-01 Listed $185,000 MRED as Distributed by MLS Grid
- 2024-02-01 Listed $195,000 RMLSA as Distributed by MLS Grid
- 2024-01-23 Listing Removed — RMLSA as Distributed by MLS Grid
- 2024-01-23 Listing Removed — MRED as Distributed by MLS Grid
- 2023-11-21 Price Changed — RMLSA as Distributed by MLS Grid
- 2023-10-27 Listed — RMLSA as Distributed by MLS Grid
- 2021-08-06 Listing Removed — RMLSA as Distributed by MLS Grid
- 2021-08-06 Listing Removed — RMLSA as Distributed by MLS Grid
- 2021-08-06 Listing Removed — RMLSA as Distributed by MLS Grid
- 2021-08-06 Listing Removed — RMLSA as Distributed by MLS Grid
- 2021-08-06 Listing Removed — RMLSA as Distributed by MLS Grid
- 2021-02-19 Sold (Public Records) $20,500 Public Records
- 2016-08-03 Sold (MLS) $76,500 MRED as Distributed by MLS Grid
- 2016-08-03 Sold (MLS) $76,500 RMLSA as Distributed by MLS Grid
- 2016-05-24 Listed $76,500 MRED as Distributed by MLS Grid
- 2016-05-24 Listed $76,500 RMLSA as Distributed by MLS Grid
Property tax history
+1.9%/yrLatest (2025): $1,768 · +17.9% YoY. Source: county tax records.
Cash-flow waterfall
monthlySold comps — $/sqft
last 12 mo · ≤1 miLoading sold comps…