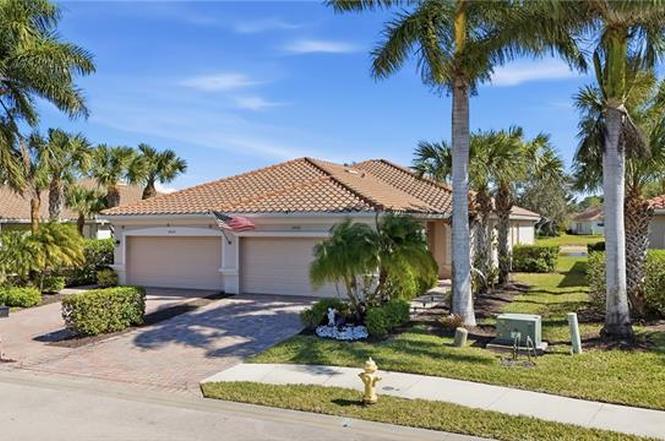
14536 Grapevine Dr · Winding Cypress, FL
Flood risk 6/10 · Moderate
- FEMA flood zone
- AE
- Chance of flooding over 30 yrs
- 0.71%
- Est. flood insurance / yr
- $1,737 – $8,500
Fire risk 5/10 · Moderate
- Est. fire insurance / yr
- $947 – $1,759
Heat risk 10/10 · Severe
- Hot days now (above 108°F)
- 7 days/yr
- Hot days in 30 yrs
- 31 days/yr
Wind risk 10/10 · Severe
- Chance of severe wind over 30 yrs
- 99.0%
Air-quality risk 3/10 · Minor
- Unhealthy air days now
- 3 days/yr
- Unhealthy air days in 30 yrs
- 3 days/yr
Risk factors via First Street. Map © Google.
Why this score? — see what drove the B+ grade
The composite is a weighted blend of 9 inputs, each scored 0–100. Each bar is that input's sub-score; the figure is the points it added to the 100-point composite (weight × sub-score).
- Cash flow +30.0/30.0
- 1% rule +10.0/10.0
- DSCR +10.0/10.0
- ARV discount +7.5/15.0
- Schools +5.0/10.0
- Appreciation +4.3/10.0
- Rent growth +3.3/5.0
- Livability +2.5/5.0
- Condition / age +2.5/5.0
$385,000
🖨 Deal sheet 📄 Offer letter ✓ Due diligence
Listing remarks
Welcome to your slice of paradise in the highly sought-after gated community of Reflection of Naples. This beautifully maintained attached villa offers serene lake views and a layout designed for comfort and relaxation. Featuring 3 spacious bedrooms, 2 full bathrooms, and a 2-car garage, this home is perfect for full-time living or a seasonal retreat. Enjoy a lifestyle of ease and leisure with resort-style amenities, including two sparkling pools, a kids’ splash pad, a full fitness center, community room, billiards, and a quiet library—all just steps from your door. Ideally located, the home provides easy access to Naples roads and Marco Island, making it simple to enjoy world-c
Key facts
- Gated community
- Full fitness center
- Two sparkling pools
Tags
Neighborhood map
What this means for you Summary
Snapshot
- This is a 3-bed/2.0-bath single-family listed at $385k.
Deal economics
- At list price, monthly cash flow is $2k ($19k/yr) — positive.
- The deal already cash-flows at list — no discount required.
- Meets the 1% rule at list price ($6k rent vs $385k).
- Recommended offer: $362k (6.0% below list) — sets the bar for market timing.
Location & tenants
- Location reads: area grade B — affects rentability + tenant quality, not the cash-flow math above.
- Collier (suburban): math 60% / reading 56% proficiency, ranked #16 of 73 in FL (top 22%) — acceptable for families but not a draw, mixed tenant base, ~2y average lease.
- Market conditions: Rents rising (+3.2%/yr); 900 active listings in the ZIP; 32 comparable units currently listed for rent nearby; rentals at typical pace (median 24d on market — plan ~3-4 weeks tenant-placement turnaround); solid renter incomes; 3,520 units permitted in Collier County in 2024 (959 in 5+ unit buildings).
- At $5,988/mo this rent would consume 80% of the median local household income ($89k/yr) (locally 550% of renters already pay >50% of income on rent) — very limited rent-growth headroom before tenants either downsize or default.
Forward outlook
- Local home prices are declining (-1.5%/yr); year-one equity from $3k of loan paydown is wiped out by about $6k of value loss. Plan a longer hold.
- Collier County population projected at +30% by 2050 — long-run rental-demand tailwind backs the buy-and-hold thesis.
- At projected returns (-1.5% appreciation + 3.2% rent growth), your $108k cash investment doubles in ~6 years — after that, you're playing with house money.
Negotiation context
- It's been on market 79 days — a 6% lower offer ($362k) is reasonable based on typical stale-listing flexibility.
Risks & watch-outs
- Watch-outs: flood insurance adds $427/mo.
- Climate carrying-cost: in FEMA flood zone AE (mandatory federal flood insurance); severe wind risk, 99% chance of damaging wind over 30y; moderate wildfire risk; extreme-heat days projected 7→31/yr by 2055 (HVAC capex compounding) — expect insurance premiums to compound above CPI over the hold.
Questions for the listing agent
- It's been on market 79 days. Have you received any prior offers? Is the seller open to a 6% concession, seller financing, or rate buy-down credit?
- What's the actual annual flood-insurance premium (NFIP or private), and is the property in a SFHA with mandatory coverage?
- What does the HOA fee cover, when was the last increase, and are there any pending special assessments or reserve-fund shortfalls?
- Why hasn't it sold? Are there any deal-killer items the seller is aware of (foundation, flood, title, zoning, code violations)?
- Is there a deadline driving the sale (1031 exchange, divorce, estate, relocation)? That informs how much negotiation room exists.
- What's the average days-on-market for RENTAL listings here right now (not sales)? A rising rental-DOM trend means longer vacancies and softer asking-rent achievability than the comps imply.
- What's the recent tenant-quality profile in this submarket — average credit score on applications, eviction rate, late-payment / NSF rate, and stable-employment percentage? A property-management company in the area should have these aggregated.
- How much new for-sale + rental construction is in the pipeline within 1–3 miles? Heavy new supply typically softens prices + rents 12–24 months out; constrained supply supports both.
Investment metrics
- 1% rule
- 1.56% ✓
- Cap rate
- 12.64%
- Cash-on-cash
- 22.67%
- DSCR
- 2.01
- GRM
- 5.4
CMA / ARV
No comps found within radius.
Projected returns pro-forma
-1.48% appreciation · 3.21% rent growth · sell at horizon
- IRR
- 14.1%
- Equity multiple
- 1.62×
- Total profit
- $66,897
- Equity at exit
- $84,128
- IRR
- 20.8%
- Equity multiple
- 3.04×
- Total profit
- $220,019
- Equity at exit
- $81,038
Cash invested: $107,800 (down + closing). Projections, not guarantees.
Landlord ↔ Tenant lean methodology
- Overall (STATE)
- 87 Strongly Landlord-Friendly
- State Florida
- 87 Strongly Landlord-Friendly · R+3
- County
- — inherits STATE
- City
- — inherits STATE
ZIP-level market 34114
- Home prices YoY
- -0.6%
- Rents YoY
- 3.2%
- Active inventory
- 900
- Price-to-rent
- 5.4×
Monthly cashflow live
- Estimated rent
- $5,988 high interval (Pro) →
- Mortgage (P&I)
- −$2,019
- Tax from tax record
- −$180 /mo · $2,154/yr
- Insurance
- −$160
- Flood insurance flood zone
- −$427 /mo · $5,118/yr
- HOA
- −$335
- Vacancy / Maint / Mgmt
- −$1,257
- Net cashflow
- $1,610
Break-even live
UW: 25.0% down · 7.5% · 30yr · 1.5% tax · 5.0% vac · 8.0% maint · 8.0% mgmt
Financing live
Cash to close
- Down payment
- $96,250
- Closing costs
- $11,550
- Reserves months
- —
- Total cash needed
- —
Loan-product check · same deal, 3 products live
Conventional
25% down · 7.5% · 30yr
- Down + closing
- —
- Monthly P&I
- —
- Monthly cashflow
- —
- DSCR
- —
- Eligible?
- —
Personal DTI + credit; lowest rate.
DSCR
20% down · 8.5% · 30yr
- Down + closing
- —
- Monthly P&I
- —
- Monthly cashflow
- —
- DSCR
- —
- Eligible?
- —
No personal income docs; deal must DSCR.
Hard money
10% down · 12.0% · 12mo
- Down + closing
- —
- Monthly P&I
- —
- Monthly cashflow
- —
- DSCR
- —
- Eligible?
- —
Short-term bridge; refi at stabilization.
Rent comps 32 comps
| Address | Beds | Baths | Sqft | Rent | $/sqft | DOM | Units | Dist |
|---|---|---|---|---|---|---|---|---|
| 14796 Canton Ct Naples, FL | 3.0 | 2.0 | 1677 | $7,000 | $4.17 | 23d | 1 | 0.24mi |
| 14214 Manchester Dr Naples, FL | 3.0 | 2.0 | 1560 | $2,700 | $1.73 | 21d | 1 | 0.33mi |
| 14214 Manchester Dr Naples, FL | 3.0 | 2.0 | 1560 | $2,800 | $1.79 | 23d | 1 | 0.33mi |
| 130 Grassy Key Ln #37 Naples, FL | 3.0 | 2.0 | 1248 | $1,795 | $1.44 | 13d | 1 | 0.34mi |
| 130 Grassy Key Ln Naples, FL | 3.0 | 2.0 | 1248 | $1,850 | $1.48 | 13d | 1 | 0.34mi |
| 14670 Catamaran Pl Naples, FL | 3.0 | 2.0 | 1816 | $7,000 | $3.85 | 23d | 1 | 0.54mi |
| 14162 Nautica Ct Naples, FL | 3.0 | 2.0 | 1684 | $3,800 | $2.26 | 23d | 1 | 0.71mi |
| 14103 Nautica Ct Naples, FL | 3.0 | 2.5 | 1850 | $3,650 | $1.97 | 23d | 1 | 0.74mi |
| 14827 Edgewater Cir Naples, FL | 2.0 | 2.0 | 1515 | $6,500 | $4.29 | 23d | 1 | 0.78mi |
| 14888 Edgewater Cir Naples, FL | 2.0 | 2.0 | 1515 | $6,200 | $4.09 | 23d | 1 | 0.84mi |
| 14940 Edgewater Cir Naples, FL | 2.0 | 2.0 | 1519 | $7,200 | $4.74 | 23d | 1 | 0.91mi |
| 2244 Yellowfin Cir Naples, FL | 3.0 | 2.0 | 1655 | $3,300 | $1.99 | 13d | 1 | 0.93mi |
| 2235 Yellowfin Cir Naples, FL | 2.0 | 2.0 | 1500 | $2,795 | $1.86 | 23d | 1 | 0.95mi |
| 14680 Edgewater Cir Naples, FL | 2.0 | 2.0 | 1515 | $3,195 | $2.11 | 23d | 1 | 0.96mi |
| 14672 Edgewater Cir Naples, FL | 2.0 | 2.0 | 1519 | $6,500 | $4.28 | 23d | 1 | 0.97mi |
| 14551 Edgewater Cir Naples, FL | 2.0 | 2.0 | 1515 | $6,000 | $3.96 | 23d | 1 | 0.97mi |
| 14558 Edgewater Cir Naples, FL | 2.0 | 2.0 | 1519 | $6,500 | $4.28 | 23d | 1 | 0.98mi |
| 14582 Edgewater Cir Naples, FL | 2.0 | 2.0 | 1515 | $7,500 | $4.95 | 23d | 1 | 0.99mi |
| 14567 Edgewater Cir Naples, FL | 2.0 | 2.0 | 1515 | $6,500 | $4.29 | 23d | 1 | 1.00mi |
| 14663 Edgewater Cir Naples, FL | 2.0 | 2.0 | 1519 | $7,000 | $4.61 | 23d | 1 | 1.00mi |
| 14644 Edgewater Cir Naples, FL | 2.0 | 2.0 | 1519 | $7,000 | $4.61 | 23d | 1 | 1.00mi |
| 14632 Edgewater Cir Unit 1049696P Naples, FL | 2.0 | 2.0 | 1506 | $6,237 | $4.14 | 13d | 1 | 1.00mi |
| 14639 Edgewater Cir Naples, FL | 2.0 | 2.0 | 1557 | $6,000 | $3.85 | 23d | 1 | 1.03mi |
| 14631 Edgewater Cir Naples, FL | 2.0 | 2.0 | 1515 | $2,795 | $1.84 | 13d | 1 | 1.04mi |
| 7674 Jacaranda Ln Naples, FL | 2.0 | 2.0 | 1554 | $3,800 | $2.45 | 23d | 1 | 1.04mi |
| 7662 Jacaranda Ln Naples, FL | 2.0 | 2.0 | 1555 | $3,500 | $2.25 | 13d | 1 | 1.06mi |
| 7631 Jacaranda Ln Naples, FL | 2.0 | 2.0 | 1542 | $7,000 | $4.54 | 23d | 1 | 1.13mi |
| 14541 Stern Way Naples, FL | 2.0 | 2.0 | 1819 | $8,000 | $4.40 | 23d | 1 | 1.15mi |
| 7567 Winding Cypress Dr Naples, FL | 3.0 | 2.0 | 1805 | $11,500 | $6.37 | 23d | 1 | 1.19mi |
| 14471 Stillwater Way Naples, FL | 3.0 | 2.0 | 1816 | $8,500 | $4.68 | 23d | 1 | 1.19mi |
| 14488 Stillwater Way Naples, FL | 3.0 | 2.0 | 1830 | $8,500 | $4.64 | 23d | 1 | 1.24mi |
| 15158 Tolmino St Naples, FL | 2.0 | 2.0 | 1676 | $3,000 | $1.79 | 13d | 1 | 1.42mi |
HOA detail
- Monthly dues
- $335 · $4,020/yr
- Likely covers
- poolgymsecurity
Listing history 4 events
-
2026-05-13status Pending
-
2026-04-27status Pending With Contingencies
-
2026-04-16price $385,000
-
2026-02-07$405,000 Active
ⓘ Source: listings_history table (triggers on properties + properties_extension) + one-shot
backfill from property_details.listing_events for pre-trigger history.
Tax reassessment forecast FL · Resets to sale price
- Current annual tax
- $2,154 · $180/mo
- Projected year-2 tax
- $3,196 · $266/mo
- Expected delta
- +$1,041/yr (+$87/mo · 48.3%)
ⓘ Screening estimate from a state-policy table — verify with the county assessor before closing.
Climate risk First Street
- Flood 6/10 Major FEMA zone AE · 71% chance over 30 yrs
- Wildfire 5/10 Major
- Heat 10/10 Extreme 7 d/yr ≥108°F today · 31 d/yr by 30 yrs out
- Wind 10/10 Extreme 99% chance of damaging wind over 30 yrs
- Air quality 3/10 Moderate 3 unhealthy d/yr today · 3 by 30 yrs out
Nearby sold comps map
Loading sold comps map…
Walkable amenities ~0.75 mi
Loading nearby amenities…
Taxation est. · year 1
- Rental income
- $71,851
- − Mortgage interest
- −$21,566
- − Property taxes
- −$2,154
- − Insurance
- −$7,044
- − Repairs & maintenance
- −$5,748
- − Management
- −$5,748
- − HOA
- −$4,020
- − Depreciation
- −$11,200
- Taxable income
- $14,371
- Est. tax owed @ 24.0%
- −$3,449
- After-tax cash flow
- $15,868/yr
For passive investors: Depreciation is non-cash, so a rental often shows a tax loss while cash-flowing — sheltering income. Rental losses are passive: they offset passive income freely, and up to $25,000/yr can offset ordinary (W-2) income if you actively participate and your MAGI is under $100k (phasing out to $0 by $150k); unused losses carry forward. On sale, claimed depreciation is recaptured at up to 25%, and gains may owe capital-gains tax (a 1031 exchange can defer both). Figures are a year-1 estimate at your 24.0% rate — not tax advice; consult a CPA.
Schools (NCES district)
- District
- Collier
- NCES district ID
- 1200330
- Math proficiency
- 60% ▼ -4.00%
- Reading proficiency
- 56% ▼ -2.00%
- Median HH income
- $58,275
- Composite
- 50.23/100
- National rank
- #1892
- State rank
- #16 of 73 in FL
Livability — Winding Cypress
No livability data for this city. (Only ~50 U.S. cities are tracked.)
Census & demographics
- County
- Collier County · 396,295 people
- Metro
- Naples-Marco Island, FL
- Population (ZIP)
- 23,559
- Household income
- $89,334
- Rent vs Own
- Severe rent burden
- 550.0
Population outlook (Collier County) Hauer SSP2
- Today (2025)
- 420,858 people
- By 2030
- 450,054 · +6.9%
- By 2040
- 502,232 · +19.3%
- By 2050
- 544,932 · +29.5%
- By 2075
- 627,203 · +49.0%
- By 2100
- 659,015 · +56.6%
Race, ethnicity, and origin ACS 2023
- Neighborhood character
- Predominantly White (72%)
- Race & ethnicity
- White 72% Hispanic / Latino 17% Two or more races 13% Black 7%
- Hispanic origin (detail)
- Mexican 7% Puerto Rican 1% Cuban 3%
- Common ancestry
- Hispanic 5% Romanian 4% Lithuanian 1%
- Foreign-born
- 21% · Canada, Jamaica
- Languages at home
- 75% English-only · Spanish 15% French/Haitian/Cajun 5% Other Indo-European 4%
Political lean MEDSL · Collier
- 2024 margin
- Solid R (+33.1) · D 33.1% · R 66.2%
- 2008→2024 swing
- -10.6pp toward R · 2008: -22.5pp · 2024: -33.1pp
- All cycles
- 2024: R+33.1 2020: R+24.7 2016: R+26.0 2012: R+30.1 2008: R+22.5
Not yet ingested
- Civics
- —
Market trends
- HPI YoY
- ▼ -1.48%
- Current HPI
- 266.5545
- Rent YoY
- ▲ 3.21%
- Metro
- Naples-Marco Island, FL
- State GDP YoY
- ▲ 3.28%
- F500 in state
- 36
Industry mix (Fortune 500 HQ in FL)
| Industry | F500 HQs | Revenue |
|---|---|---|
| Industrial Technology | 2 | $29B |
|
||
| Insurance | 2 | $17B |
|
||
| Retail | 1 | $60B |
|
||
| Technology Distribution | 1 | $58B |
|
||
| Homebuilding | 1 | $35B |
|
||
| Technology Manufacturing | 1 | $35B |
|
||
Price history
-4.9% since first listed4 events — show timeline
- 2026-05-13 Pending — NAPLESMLS
- 2026-04-27 Pending — NAPLESMLS
- 2026-04-16 Price Changed $385,000 NAPLESMLS
- 2026-02-07 Listed $405,000 NAPLESMLS
Property tax history
+20.5%/yrLatest (2025): $2,154 · +6.8% YoY. Source: county tax records.
Cash-flow waterfall
monthlySold comps — $/sqft
last 12 mo · ≤1 miLoading sold comps…