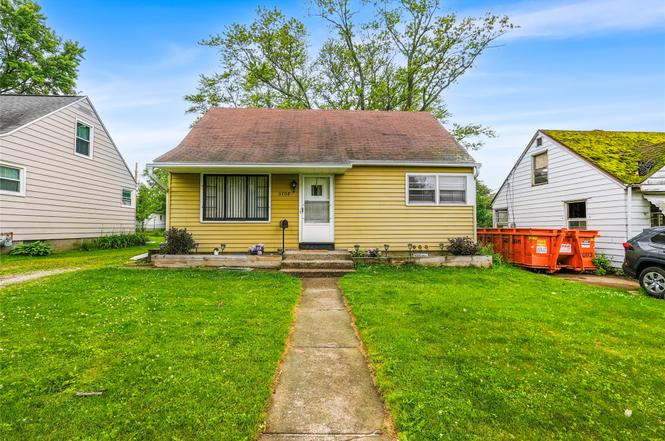
3708 Oakwood St · Erie, PA
Flood risk 1/10 · Minimal
- FEMA flood zone
- X (unshaded)
- Chance of flooding over 30 yrs
- 0.0%
- Est. flood insurance / yr
- $473 – $860
Fire risk 1/10 · Minimal
- Est. fire insurance / yr
- $511 – $949
Heat risk 2/10 · Minimal
- Hot days now (above 90°F)
- 7 days/yr
- Hot days in 30 yrs
- 16 days/yr
Wind risk 1/10 · Minimal
- Chance of severe wind over 30 yrs
- —
Air-quality risk 2/10 · Minimal
- Unhealthy air days now
- 1 days/yr
- Unhealthy air days in 30 yrs
- 3 days/yr
Risk factors via First Street. Map © Google.
Why this score? — see what drove the D grade
The composite is a weighted blend of 9 inputs, each scored 0–100. Each bar is that input's sub-score; the figure is the points it added to the 100-point composite (weight × sub-score).
- ARV discount +15.0/15.0
- Cash flow +9.9/30.0
- Livability +4.2/5.0
- 1% rule +3.7/10.0
- DSCR +2.8/10.0
- Rent growth +2.5/5.0
- Condition / age +2.5/5.0
- Schools +1.3/10.0
- Appreciation +0.0/10.0
$149,900
🖨 Deal sheet (PDF) 📄 Offer letter ✓ Due diligence
Listing remarks MLS
Pending will take back ups !Cute home with hardwood floors. Freshly painted first floor, two bedrooms and full bath on 1st level. Nice size back yard with a deck and two storage sheds. Basement has a small toilet room. Off street parking. HSA Home Warranty. Seller offering $2000 Seller assist.
Key facts
- Lush backyard
- Tool shed
- Eat-in kitchen
Tags
Property features AI
Exterior
- Parking: 2 parking spaces
- Utilities: Public water; Public sewer
- Home design: Single-family residence; One and one-half stories
- Construction: Aluminum siding
- Exterior features: Asphalt roof; Lot roughly 48 x 120 (R-1 zoning)
Interior
- Kitchen: Includes dishwasher, electric oven, and refrigerator
- Bedrooms: 7 total rooms (bedroom count not specified)
- Flooring: Hardwood and other
- Bathrooms: 1 full bathroom
- Heating & cooling: Forced air heating
- Interior features: Dishwasher; Electric oven; Refrigerator; Washer and dryer; Hardwood and other flooring; Full basement
- Laundry & utility: Washer and dryer included
Neighborhood map
What this means for you Summary
Snapshot
- This is a 2-bed/1.0-bath single-family listed at $150k.
Deal economics
- At list price, monthly cash flow is $-93 ($-1k/yr) — negative.
- To cash-flow at today's rent, offer at most $133k (11.0% below list).
- To meet the 1% rule (rent ≥ 1% of price), the offer needs to be $131k (12.5% below list).
- Recommended offer: $131k (12.5% below list) — sets the bar for 1% rule.
Location & tenants
- Location reads 83/100 on livability (#109 in PA, #840 nationally) — a professional / high-income tenant draw. Strengths: amenities A+, commute A+, cost of living A+; Watch: crime D+, employment F.
- Erie City SD (urban): math 12% / reading 19% proficiency, ranked #510 of 539 in PA (top 95%) — low school quality limits family demand, transient renter base, plan for 1-2y turnover; 81% free/reduced lunch — lower-income household profile, screen leases tightly.
- Zoned schools: Grover Cleveland El Sch (math 18% / reading 30%, grade F, #1,211 of 1,518 statewide, top 80%, 554 students, 100% FRL); Northwest Pa Collegiate Academy (math 82%, 753 students, 100% FRL) — zoned schools average 100% FRL vs 81% district-wide (19 pts higher); higher-poverty schools than district average — tighter screening recommended.
- Market conditions: 76 active listings in the ZIP; 9 comparable units currently listed for rent nearby; rentals lingering (median 46d on market — plan ~5-8 weeks vacancy on turnover, expect pricing pressure); 100% of comp listings sitting > 30 days — soft ceiling on asking rent; 364 units permitted in Erie County in 2024 (188 in 5+ unit buildings).
Forward outlook
- Local home prices are declining (-3.0%/yr); year-one equity from $1k of loan paydown is wiped out by about $4k of value loss. Plan a longer hold.
- Erie County population projected at -14% by 2050 — secular population decline; favor cash flow + early exit over multi-decade hold.
Negotiation context
- Only 7 days on market — expect competitive offers; lowballing is unlikely to land.
- 3 sale attempts since 4y ago with the ask held roughly flat each time — persistent listings suggest the price (not the market) is what's stuck; bring a comps-based counter.
- Current owner paid $127k; 18% above their basis — modest negotiation headroom, anchor on the comps not their cost.
Risks & watch-outs
- Watch-outs: built in 1950 — expect roof / HVAC / electrical / plumbing capex.
Questions for the listing agent
- What do current leases actually rent for vs. the listed asking? Can we see a recent rent roll and the last 12 months of T-12 income?
- Built in 1950 — when were the roof, HVAC, electrical panel, plumbing, and water heater last replaced?
- Is there a deadline driving the sale (1031 exchange, divorce, estate, relocation)? That informs how much negotiation room exists.
- Crime grade is D in this area — have there been break-ins, vandalism, or insurance claims at this property in the last 3 years? What carrier currently insures it and at what premium?
- The area grade is low — what's the realistic commute time and amenity access for the typical tenant pool here? Any planned neighborhood developments (good or bad) we should know about?
- What's the average days-on-market for RENTAL listings here right now (not sales)? A rising rental-DOM trend means longer vacancies and softer asking-rent achievability than the comps imply.
- What's the recent tenant-quality profile in this submarket — average credit score on applications, eviction rate, late-payment / NSF rate, and stable-employment percentage? A property-management company in the area should have these aggregated.
- How much new for-sale + rental construction is in the pipeline within 1–3 miles? Heavy new supply typically softens prices + rents 12–24 months out; constrained supply supports both.
Investment metrics
- 1% rule
- 0.87% ✗
- Cap rate
- 5.55%
- Cash-on-cash
- -2.67%
- DSCR
- 0.88
- GRM
- 9.5
CMA / ARV
- ARV (on-the-fly)
- $193,536
- Comps found
- 12
Show comp detail 12 sales within ~0.75 mi
| Address | Dist | Beds/Ba | Sqft | Sold | Price | $/sf | Match |
|---|---|---|---|---|---|---|---|
| 3220 Oakwood St | 0.29mi | 3/1.0 (+1) | 1,040 (+3%) | 6mo | $175,000 | $168 | 71 |
| 3203 Melrose Ave | 0.53mi | 2/1.0 | 960 (-5%) | 1mo | $192,400 | $200 | 66 |
| 3516 Elmwood Ave | 0.58mi | 2/1.0 | 1,056 (+5%) | 0mo | $187,000 | $177 | 64 |
| 2936 Rudolph Ave | 0.68mi | 2/1.5 | 996 (-1%) | 1mo | $191,500 | $192 | 64 |
| 1335 W 42 St | 0.60mi | 2/1.0 | 960 (-5%) | 4mo | $150,000 | $156 | 61 |
| 4004 Washington Ave | 0.35mi | 3/2.0 (+1) | 1,078 (+7%) | 3mo | $249,900 | $232 | 60 |
| 1361 W 35th St | 0.48mi | 2/1.0 | 1,112 (+10%) | 3mo | $185,000 | $166 | 58 |
| 1448 W 36th St | 0.36mi | 3/2.5 (+1) | 1,080 (+7%) | 6mo | $259,900 | $241 | 56 |
| 3309 Greengarden Blvd | 0.26mi | 3/2.0 (+1) | 1,146 (+14%) | 6mo | $235,000 | $205 | 51 |
| 1377 W 32 St | 0.54mi | 3/2.0 (+1) | 1,094 (+8%) | 2mo | $227,000 | $207 | 50 |
| 2114 Canton Ave | 0.63mi | 3/1.0 (+1) | 1,104 (+10%) | 1mo | $153,000 | $139 | 49 |
| 2016 W 37th St | 0.54mi | 3/1.0 (+1) | 864 (-14%) | 6mo | $125,000 | $145 | 41 |
Match score weights: distance 35% · size 25% · config 20% · recency 20%. Top-matched comps best support the ARV.
Projected returns pro-forma
-3.0% appreciation · 3.0% rent growth · sell at horizon
- IRR
- -20.7%
- Equity multiple
- 0.28×
- Total profit
- $-30,157
- Equity at exit
- $22,351
- IRR
- -13.8%
- Equity multiple
- 0.20×
- Total profit
- $-33,600
- Equity at exit
- $12,961
Cash invested: $41,972 (down + closing). Projections, not guarantees.
Landlord ↔ Tenant lean methodology
- Overall (STATE)
- 62 Landlord-Friendly
- State Pennsylvania
- 62 Landlord-Friendly · EVEN
- County
- — inherits STATE
- City
- — inherits STATE
ZIP-level market 16508
- Home prices YoY
- -22.8%
- Active inventory
- 76
- Price-to-rent
- 9.5×
Monthly cashflow live
- Estimated rent
- $1,312 high interval (Pro) →
- Mortgage (P&I)
- −$786
- Tax from tax record
- −$281 /mo · $3,370/yr
- Insurance
- −$62
- HOA
- −$0
- Vacancy / Maint / Mgmt
- −$275
- Net cashflow
- $-93
Break-even live
Sensitivity live
| Price | -10% $-8 | -5% $-51 | +0% $-93 | +5% $-136 | +10% $-178 |
|---|---|---|---|---|---|
| Rent | -10% $-197 | -5% $-145 | +0% $-93 | +5% $-42 | +10% $10 |
| Rate | -1.0pp $-18 | -0.5pp $-55 | base $-93 | +0.5pp $-132 | +1.0pp $-172 |
UW: 25.0% down · 7.5% · 30yr · 1.5% tax · 5.0% vac · 8.0% maint · 8.0% mgmt
Financing live
Cash to close
- Down payment
- $37,475
- Closing costs
- $4,497
- Reserves months
- —
- Total cash needed
- —
Loan-product check · same deal, 3 products live
Conventional
25% down · 7.5% · 30yr
- Down + closing
- —
- Monthly P&I
- —
- Monthly cashflow
- —
- DSCR
- —
- Eligible?
- —
Personal DTI + credit; lowest rate.
DSCR
20% down · 8.5% · 30yr
- Down + closing
- —
- Monthly P&I
- —
- Monthly cashflow
- —
- DSCR
- —
- Eligible?
- —
No personal income docs; deal must DSCR.
Hard money
10% down · 12.0% · 12mo
- Down + closing
- —
- Monthly P&I
- —
- Monthly cashflow
- —
- DSCR
- —
- Eligible?
- —
Short-term bridge; refi at stabilization.
Rent comps 9 comps
| Address | Beds | Baths | Sqft | Rent | $/sqft | DOM | Units | Dist |
|---|---|---|---|---|---|---|---|---|
| 1022 W 30th St Unit 2 Erie, PA | 2.0 | 1.0 | 1000 | $850 | $0.85 | 46d | 1 | 1.00mi |
| 1540 W 54th St Unit 156104 Erie, PA | 2.0 | 1.0 | 952 | $1,425 | $1.50 | 46d | 1 | 1.15mi |
| 811 W 30th St Unit 1 Erie, PA | 2.0 | 1.0 | 900 | $1,175 | $1.31 | 46d | 1 | 1.19mi |
| 3603 Maple St Erie, PA | 2.0 | 1.0 | 1200 | $1,000 | $0.83 | 46d | 1 | 1.32mi |
| 2619 Liberty St Apt 2 Erie, PA | 2.0 | 1.0 | 800 | $800 | $1.00 | 46d | 1 | 1.33mi |
| 4500 Hammocks Dr Erie, PA | 2.0–3.0 | 2.0 | 1312 | $1,945 | $1.48 | 46d | 7 | 1.49mi |
| 4536 Hammocks Dr Unit 536204 Erie, PA | 3.0 | 2.0 | 1416 | $2,275 | $1.61 | 46d | 1 | 1.50mi |
| 4536 Hammocks Dr Unit 542401 Erie, PA | 2.0 | 2.0 | 1327 | $2,160 | $1.63 | 46d | 1 | 1.50mi |
| 4536 Hammocks Dr Unit 536404 Erie, PA | 3.0 | 2.0 | 1416 | $2,290 | $1.62 | 46d | 1 | 1.50mi |
Listing history 8 events
-
2026-06-22status $149,900 Pending 7 DOM
-
2026-06-21days on market $149,900 Active 7 DOM
-
2026-06-19days on market $149,900 Active 5 DOM
-
2026-06-18days on market $149,900 Active 4 DOM
-
2026-06-17days on market $149,900 Active 3 DOM
-
2026-06-16days on market $149,900 Active 2 DOM
-
2026-06-15remarks 691-char remark
-
2026-06-15$149,900 Active 1 DOM
ⓘ Source: listings_history table (triggers on properties + properties_extension) + one-shot
backfill from property_details.listing_events for pre-trigger history.
Tax reassessment forecast PA · Partial reset (capped growth)
- Current annual tax
- $3,370 · $281/mo
- Projected year-2 tax
- $3,370 · $281/mo
- Expected delta
- $0/yr ($0/mo · 0.0%)
ⓘ Screening estimate from a state-policy table — verify with the county assessor before closing.
Climate risk First Street
- Flood 1/10 Low FEMA zone X (unshaded) · 0% chance over 30 yrs
- Wildfire 1/10 Low
- Heat 2/10 Low 7 d/yr ≥90°F today · 16 d/yr by 30 yrs out
- Wind 1/10 Low
- Air quality 2/10 Low 1 unhealthy d/yr today · 3 by 30 yrs out
Nearby sold comps map
Loading sold comps map…
Walkable amenities ~0.75 mi
Loading nearby amenities…
Taxation est. · year 1
- Rental income
- $15,738
- − Mortgage interest
- −$8,397
- − Property taxes
- −$3,370
- − Insurance
- −$750
- − Repairs & maintenance
- −$1,259
- − Management
- −$1,259
- − Depreciation
- −$4,361
- Taxable loss
- −$3,657
- Est. tax savings @ 24.0%
- +$878
- After-tax cash flow
- $-242/yr
For passive investors: Depreciation is non-cash, so a rental often shows a tax loss while cash-flowing — sheltering income. Rental losses are passive: they offset passive income freely, and up to $25,000/yr can offset ordinary (W-2) income if you actively participate and your MAGI is under $100k (phasing out to $0 by $150k); unused losses carry forward. On sale, claimed depreciation is recaptured at up to 25%, and gains may owe capital-gains tax (a 1031 exchange can defer both). Figures are a year-1 estimate at your 24.0% rate — not tax advice; consult a CPA.
Schools (NCES district)
- District
- Erie City SD
- NCES district ID
- 4209300
- Math proficiency
- 12% ▼ -11.00%
- Reading proficiency
- 19% ▼ -16.00%
- Median HH income
- $33,625
- Composite
- 12.59/100
- National rank
- #9617
- State rank
- #510 of 539 in PA
Livability — Erie
- Score
- 83/100
- State rank
- #109
- US rank
- #840
Category grades
Schools grade is shown separately in the Schools card above.
Census & demographics
- Census place
- Erie, PA
- County
- Erie County · 92,215 people
- City population
- 92,215
- Metro
- Erie, PA
- Population (ZIP)
- 14,958
- Household income
- $56,391
- Rent vs Own
- Severe rent burden
- 420.0
Population outlook (Erie County) Hauer SSP2
- Today (2025)
- 272,159 people
- By 2030
- 266,299 · -2.2%
- By 2040
- 250,987 · -7.8%
- By 2050
- 234,925 · -13.7%
- By 2075
- 199,164 · -26.8%
- By 2100
- 162,985 · -40.1%
Race, ethnicity, and origin ACS 2023
- Neighborhood character
- Predominantly White (80%)
- Race & ethnicity
- White 80% Two or more races 12% Black 5% Hispanic / Latino 4% Asian 1%
- Common ancestry
- Romanian 13% Lithuanian 2% Scotch-Irish 2%
- Foreign-born
- 3% · Canada
- Languages at home
- 95% English-only · Spanish 2% Russian/Polish/Slavic 1% Other Indo-European 1%
Political lean MEDSL · Erie
- 2024 margin
- Toss-up / Even · D 49.0% · R 50.0%
- 2008→2024 swing
- -20.9pp toward R · 2008: 19.9pp · 2024: -1.0pp
- All cycles
- 2024: R+1.0 2020: D+1.0 2016: R+2.0 2012: D+16.9 2008: D+19.9
Not yet ingested
- Civics
- —
Market trends
- HPI YoY
- ▼ -74.05%
- Current HPI
- 250.759
- Rent YoY
- —
- Metro
- Erie, PA
- State GDP YoY
- ▲ 1.68%
- F500 in state
- 34
Industry mix (Fortune 500 HQ in PA)
| Industry | F500 HQs | Revenue |
|---|---|---|
| Healthcare | 2 | $309B |
|
||
| Insurance | 2 | $27B |
|
||
| Telecommunications / Media | 1 | $124B |
|
||
| Industrial Distribution | 1 | $22B |
|
||
| Financial Services | 1 | $20B |
|
||
| Chemicals / Materials | 1 | $18B |
|
||
Price history
+53.7% since first listed10 events — show timeline
- 2026-06-14 Listed $149,900 GEBOR
- 2025-10-08 Sold (Public Records) $127,000 Public Records
- 2025-10-07 Sold (MLS) $127,000 GEBOR
- 2025-08-07 Pending — GEBOR
- 2025-07-30 Price Changed $135,000 GEBOR
- 2025-07-02 Listed $145,000 GEBOR
- 2022-09-30 Sold (Public Records) $100,575 Public Records
- 2022-09-30 Sold (MLS) $100,575 GEBOR
- 2022-08-20 Delisted — GEBOR
- 2022-08-16 Listed $97,500 GEBOR
Property tax history
+1.9%/yrLatest (2026): $3,370 · +3.4% YoY. Source: county tax records.
Cash-flow waterfall
monthlySold comps — $/sqft
last 12 mo · ≤1 miLoading sold comps…