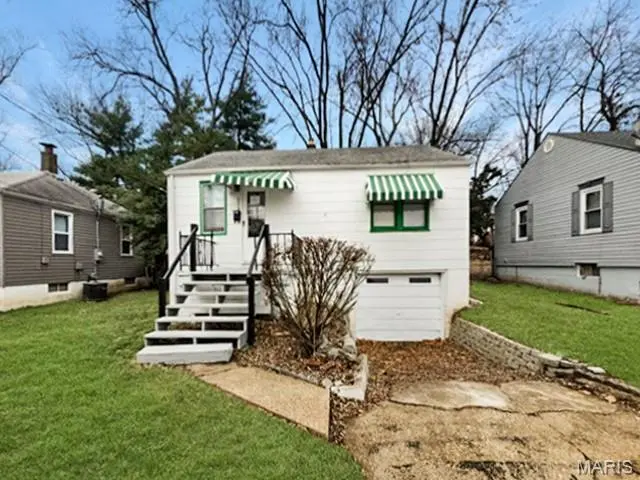
3219 Coles Ave · Breckenridge Hills, MO
Flood risk 1/10 · Minimal
- FEMA flood zone
- X (unshaded)
- Chance of flooding over 30 yrs
- 0.0%
- Est. flood insurance / yr
- $473 – $860
Fire risk 1/10 · Minimal
- Est. fire insurance / yr
- $1,054 – $1,958
Heat risk 4/10 · Minor
- Hot days now (above 106°F)
- 7 days/yr
- Hot days in 30 yrs
- 21 days/yr
Wind risk 2/10 · Minimal
- Chance of severe wind over 30 yrs
- 1.0%
Air-quality risk 2/10 · Minimal
- Unhealthy air days now
- 1 days/yr
- Unhealthy air days in 30 yrs
- 3 days/yr
Risk factors via First Street. Map © Google.
Why this score? — see what drove the B- grade
The composite is a weighted blend of 9 inputs, each scored 0–100. Each bar is that input's sub-score; the figure is the points it added to the 100-point composite (weight × sub-score).
- Cash flow +29.0/30.0
- DSCR +10.0/10.0
- ARV discount +9.2/15.0
- 1% rule +7.8/10.0
- Livability +3.4/5.0
- Rent growth +3.0/5.0
- Condition / age +2.5/5.0
- Schools +1.7/10.0
- Appreciation +0.0/10.0
$89,900
🖨 Deal sheet 📄 Offer letter ✓ Due diligence
Listing remarks MLS
This bungalow style home in Breckenridge Hills offers a refreshing feel with its style. The interior features updated flooring throughout, creating a bright and inviting living space. With 2 beds and 1 bath, this charming approximately 672 sqft is perfect for an owner occupant or an investor. Outside, you will find a generous, fully fenced backyard that includes a deck for relaxing and multiple sheds for extra storage. The property is rounded out with a convenient garage and a full unfinished basement, offering plenty of functional space for various needs.
Key facts
- Multiple sheds
- Deck
- Updated flooring
Tags
Neighborhood map
What this means for you Summary
Snapshot
- This is a 2-bed/1.0-bath single-family listed at $90k.
Deal economics
- At list price, monthly cash flow is $308 ($4k/yr) — positive.
- The deal already cash-flows at list — no discount required.
- Meets the 1% rule at list price ($1k rent vs $90k).
- Recommended offer: $82k (9.0% below list) — sets the bar for market timing.
Location & tenants
- Location reads 68/100 on livability (#193 in MO) — a middle-class / working-renter tenant base. Strengths: cost of living A+, housing A+; Watch: crime C-, employment D+, schools F.
- Ritenour (suburban): math 13% / reading 27% proficiency, ranked #304 of 324 in MO (top 94%) — low school quality limits family demand, transient renter base, plan for 1-2y turnover; 66% free/reduced lunch — lower-income household profile, screen leases tightly.
- Market conditions: Rents rising (+2.0%/yr); 118 active listings in the ZIP; 10 comparable units currently listed for rent nearby; rentals at typical pace (median 24d on market — plan ~3-4 weeks tenant-placement turnaround); 40% of comp listings sitting > 30 days — soft ceiling on asking rent; 920 units permitted in St. Louis County in 2024 (250 in 5+ unit buildings).
Forward outlook
- Local home prices are declining (-3.0%/yr); year-one equity from $622 of loan paydown is wiped out by about $3k of value loss. Plan a longer hold.
- At projected returns (-3.0% appreciation + 2.0% rent growth), your $25k cash investment doubles in ~9 years — after that, you're playing with house money.
Negotiation context
- It's been on market 111 days — a 9% lower offer ($82k) is reasonable based on typical stale-listing flexibility.
- 5 sale attempts since 3y ago; this cycle's ask has dropped $25k (22%) from the opening price — seller is motivated, your offer sets the floor, not the list.
Risks & watch-outs
- Watch-outs: built in 1949 — expect roof / HVAC / electrical / plumbing capex.
Questions for the listing agent
- It's been on market 111 days. Have you received any prior offers? Is the seller open to a 9% concession, seller financing, or rate buy-down credit?
- Built in 1949 — when were the roof, HVAC, electrical panel, plumbing, and water heater last replaced?
- Why hasn't it sold? Are there any deal-killer items the seller is aware of (foundation, flood, title, zoning, code violations)?
- Is there a deadline driving the sale (1031 exchange, divorce, estate, relocation)? That informs how much negotiation room exists.
- Schools are F-rated, which usually means shorter tenancies and higher turnover. Who's the typical renter profile here, and what's been the actual vacancy rate?
- What's the average days-on-market for RENTAL listings here right now (not sales)? A rising rental-DOM trend means longer vacancies and softer asking-rent achievability than the comps imply.
- What's the recent tenant-quality profile in this submarket — average credit score on applications, eviction rate, late-payment / NSF rate, and stable-employment percentage? A property-management company in the area should have these aggregated.
- How much new for-sale + rental construction is in the pipeline within 1–3 miles? Heavy new supply typically softens prices + rents 12–24 months out; constrained supply supports both.
Investment metrics
- 1% rule
- 1.28% ✓
- Cap rate
- 10.41%
- Cash-on-cash
- 14.70%
- DSCR
- 1.65
- GRM
- 6.5
CMA / ARV
- ARV (median comp)
- $93,359
- List price
- $89,900
- Delta
- -3.71%
- Verdict
- FAIR
- Comps
- 20 within 1.0 mi
Show comp detail 12 sales within ~0.75 mi
| Address | Dist | Beds/Ba | Sqft | Sold | Price | $/sf | Match |
|---|---|---|---|---|---|---|---|
| 3317 Royalton | 0.22mi | 2/1.0 | 700 (+4%) | 7mo | $107,000 | $153 | 77 |
| 3316 Edmundson Rd | 0.19mi | 2/1.0 | 633 (-6%) | 6mo | $80,000 | $126 | 76 |
| 3106 Quiet Ln | 0.25mi | 2/1.0 | 724 (+8%) | 3mo | $148,000 | $204 | 73 |
| 3212 W Tennyson Ave | 0.30mi | 2/1.0 | 612 (-9%) | 1mo | $99,000 | $162 | 70 |
| 3294 W Tennyson Ave | 0.29mi | 2/1.0 | 744 (+11%) | 6mo | $40,000 | $54 | 64 |
| 3510 Dix Ave | 0.38mi | 1/1.0 (-1) | 696 (+4%) | 9mo | $108,000 | $155 | 63 |
| 9440 Baltimore Ave | 0.40mi | 2/2.0 | 720 (+7%) | 4mo | $125,000 | $174 | 62 |
| 3362 Edmundson Rd | 0.28mi | 1/1.0 (-1) | 600 (-11%) | 6mo | $89,000 | $148 | 60 |
| 3534 Calvert Ave | 0.49mi | 2/1.0 | 720 (+7%) | 7mo | $150,000 | $208 | 59 |
| 9431 Edmund Dr | 0.57mi | 1/1.0 (-1) | 702 (+4%) | 10mo | $54,900 | $78 | 52 |
| 9594 Muriel Ave | 0.62mi | 2/1.0 | 729 (+8%) | 11mo | $103,000 | $141 | 48 |
| 9411 Muriel Ave | 0.68mi | 1/1.0 (-1) | 576 (-14%) | 10mo | $85,000 | $148 | 31 |
Match score weights: distance 35% · size 25% · config 20% · recency 20%. Top-matched comps best support the ARV.
Projected returns pro-forma
-3.0% appreciation · 2.04% rent growth · sell at horizon
- IRR
- 4.1%
- Equity multiple
- 1.16×
- Total profit
- $3,971
- Equity at exit
- $13,404
- IRR
- 12.7%
- Equity multiple
- 1.97×
- Total profit
- $24,330
- Equity at exit
- $7,773
Cash invested: $25,172 (down + closing). Projections, not guarantees.
Landlord ↔ Tenant lean methodology
- Overall (STATE)
- 81 Strongly Landlord-Friendly
- State Missouri
- 81 Strongly Landlord-Friendly · R+10
- County
- — inherits STATE
- City
- — inherits STATE
ZIP-level market 63114
- Rents YoY
- 2.0%
- Active inventory
- 118
- Price-to-rent
- 6.5×
Monthly cashflow live
- Estimated rent
- $1,149 high interval (Pro) →
- Mortgage (P&I)
- −$471
- Tax from tax record
- −$91 /mo · $1,090/yr
- Insurance
- −$37
- HOA
- −$0
- Vacancy / Maint / Mgmt
- −$241
- Net cashflow
- $308
Break-even live
UW: 25.0% down · 7.5% · 30yr · 1.5% tax · 5.0% vac · 8.0% maint · 8.0% mgmt
Financing live
Cash to close
- Down payment
- $22,475
- Closing costs
- $2,697
- Reserves months
- —
- Total cash needed
- —
Loan-product check · same deal, 3 products live
Conventional
25% down · 7.5% · 30yr
- Down + closing
- —
- Monthly P&I
- —
- Monthly cashflow
- —
- DSCR
- —
- Eligible?
- —
Personal DTI + credit; lowest rate.
DSCR
20% down · 8.5% · 30yr
- Down + closing
- —
- Monthly P&I
- —
- Monthly cashflow
- —
- DSCR
- —
- Eligible?
- —
No personal income docs; deal must DSCR.
Hard money
10% down · 12.0% · 12mo
- Down + closing
- —
- Monthly P&I
- —
- Monthly cashflow
- —
- DSCR
- —
- Eligible?
- —
Short-term bridge; refi at stabilization.
Rent comps 10 comps
| Address | Beds | Baths | Sqft | Rent | $/sqft | DOM | Units | Dist |
|---|---|---|---|---|---|---|---|---|
| 3208 Dix Ave Saint Louis, MO | 2.0 | 1.0 | 656 | $1,235 | $1.88 | 10d | 1 | 0.17mi |
| 3710 Geraldine Ave Apt 3 St Ann, MO | 1.0 | 1.0 | 400 | $675 | $1.69 | 43d | 1 | 0.81mi |
| 10214 Saint Anthony Ln Saint Ann, MO | 2.0 | 1.0 | 734 | $1,200 | $1.63 | 43d | 1 | 0.85mi |
| 2323 Woodson Rd Apt I Overland, MO | 1.0 | 1.0 | 650 | $875 | $1.35 | 7d | 1 | 1.10mi |
| 2323 Woodson Rd Apt J Overland, MO | 1.0 | 1.0 | 605 | $875 | $1.45 | 43d | 1 | 1.10mi |
| 8700 Crocus Ln Saint Louis, MO | 1.0 | 1.0 | 700 | $950 | $1.36 | 7d | 2 | 1.17mi |
| 3961 Jane Ave Unit 3963 St Ann, MO | 2.0 | 1.0 | 750 | $1,195 | $1.59 | 14d | 1 | 1.23mi |
| 2201 Gaebler Ave Unit A Overland, MO | 2.0 | 1.0 | 710 | $1,250 | $1.76 | 23d | 1 | 1.35mi |
| 4120 Geraldine Ave St Ann, MO | 1.0 | 1.0 | 540 | $875 | $1.62 | 43d | 1 | 1.48mi |
| 4120 Geraldine Ave St Ann, MO | 1.0 | 1.0 | 540 | $875 | $1.62 | 21d | 1 | 1.48mi |
Listing history 30 events
-
2026-06-18days on market $89,900 Active 111 DOM
-
2026-06-17days on market $89,900 Active 110 DOM
-
2026-06-16days on market $89,900 Active 109 DOM
-
2026-06-15days on market $89,900 Active 108 DOM
-
2026-06-13pricedays on market $89,900 Active 106 DOM
-
2026-06-09days on market $97,500 Active 102 DOM
-
2026-06-08days on market $97,500 Active 101 DOM
-
2026-06-07days on market $97,500 Active 100 DOM
-
2026-06-03days on market $97,500 Active 96 DOM
-
2026-06-02days on market $97,500 Active 95 DOM
-
2026-06-01days on market $97,500 Active 94 DOM
-
2026-05-31days on market $97,500 Active 93 DOM
-
2026-05-06price $97,500 565-char remark
Show marketing remark (565 chars)
This bungalow style home in Breckenridge Hills offers a refreshing feel with its style. The interior features updated flooring throughout, creating a bright and inviting living space. With 2 beds and 1 bath, this charming approximately 672 sqft is perfect for an owner occupant or an investor. Outside, you will find a generous, fully fenced backyard that includes a deck for relaxing and multiple sheds for extra storage. The property is rounded out with a convenient garage and a full unfinished basement, offering plenty of functional space for various needs.
-
2026-04-03price $107,500 565-char remark
Show marketing remark (565 chars)
This bungalow style home in Breckenridge Hills offers a refreshing feel with its style. The interior features updated flooring throughout, creating a bright and inviting living space. With 2 beds and 1 bath, this charming approximately 672 sqft is perfect for an owner occupant or an investor. Outside, you will find a generous, fully fenced backyard that includes a deck for relaxing and multiple sheds for extra storage. The property is rounded out with a convenient garage and a full unfinished basement, offering plenty of functional space for various needs.
-
2026-02-27$114,900 Active 565-char remark
Show marketing remark (565 chars)
This bungalow style home in Breckenridge Hills offers a refreshing feel with its style. The interior features updated flooring throughout, creating a bright and inviting living space. With 2 beds and 1 bath, this charming approximately 672 sqft is perfect for an owner occupant or an investor. Outside, you will find a generous, fully fenced backyard that includes a deck for relaxing and multiple sheds for extra storage. The property is rounded out with a convenient garage and a full unfinished basement, offering plenty of functional space for various needs.
-
2025-11-19price $109,900
-
2025-11-14price $114,900
-
2025-10-18price $122,900
-
2025-10-11$124,900 Active
-
2025-10-10historical
-
2025-02-06historical
-
2025-01-16historical Active Under Contract
-
2024-12-30$125,000 Active
-
2024-01-08historical
-
2023-11-07$124,900 Active
-
2023-08-02soldstatus Closed
-
2023-07-11status Pending
-
2023-06-11$49,900 Active
-
2003-06-26soldstatus
-
1996-11-20soldstatus
ⓘ Source: listings_history table (triggers on properties + properties_extension) + one-shot
backfill from property_details.listing_events for pre-trigger history.
Tax reassessment forecast MO · Resets to sale price
- Current annual tax
- $1,090 · $91/mo
- Projected year-2 tax
- $1,090 · $91/mo
- Expected delta
- $0/yr ($0/mo · 0.0%)
ⓘ Screening estimate from a state-policy table — verify with the county assessor before closing.
Climate risk First Street
- Flood 1/10 Low FEMA zone X (unshaded) · 0% chance over 30 yrs
- Wildfire 1/10 Low
- Heat 4/10 Moderate 7 d/yr ≥106°F today · 21 d/yr by 30 yrs out
- Wind 2/10 Low 100% chance of damaging wind over 30 yrs
- Air quality 2/10 Low 1 unhealthy d/yr today · 3 by 30 yrs out
Nearby sold comps map
Loading sold comps map…
Walkable amenities ~0.75 mi
Loading nearby amenities…
Taxation est. · year 1
- Rental income
- $13,792
- − Mortgage interest
- −$5,036
- − Property taxes
- −$1,090
- − Insurance
- −$450
- − Repairs & maintenance
- −$1,103
- − Management
- −$1,103
- − Depreciation
- −$2,615
- Taxable income
- $2,395
- Est. tax owed @ 24.0%
- −$575
- After-tax cash flow
- $3,124/yr
For passive investors: Depreciation is non-cash, so a rental often shows a tax loss while cash-flowing — sheltering income. Rental losses are passive: they offset passive income freely, and up to $25,000/yr can offset ordinary (W-2) income if you actively participate and your MAGI is under $100k (phasing out to $0 by $150k); unused losses carry forward. On sale, claimed depreciation is recaptured at up to 25%, and gains may owe capital-gains tax (a 1031 exchange can defer both). Figures are a year-1 estimate at your 24.0% rate — not tax advice; consult a CPA.
Schools (NCES district)
- District
- Ritenour
- NCES district ID
- 2926640
- Math proficiency
- 13% ▼ -14.00%
- Reading proficiency
- 27% ▼ -7.00%
- Median HH income
- $41,410
- Composite
- 17.04/100
- National rank
- #9125
- State rank
- #304 of 324 in MO
Livability — Breckenridge Hills
- Score
- 68/100
- State rank
- #193
- US rank
- #10013
Category grades
Schools grade is shown separately in the Schools card above.
Census & demographics
- Census place
- Breckenridge Hills, MO
- County
- Saint Louis County · 888,823 people
- Metro
- St. Louis, MO-IL
- Population (ZIP)
- 33,969
- Household income
- $55,870
- Rent vs Own
- Severe rent burden
- 1595.0
Population outlook (St. Louis County) Hauer SSP2
- Today (2025)
- 1,025,227 people
- By 2030
- 1,028,023 · +0.3%
- By 2040
- 1,020,940 · -0.4%
- By 2050
- 1,007,280 · -1.8%
- By 2075
- 987,277 · -3.7%
- By 2100
- 921,984 · -10.1%
Race, ethnicity, and origin ACS 2023
- Neighborhood character
- Diverse neighborhood (Simpson 0.64)
- Race & ethnicity
- White 50% Black 30% Hispanic / Latino 11% Two or more races 6% Asian 2%
- Hispanic origin (detail)
- Mexican 7%
- Common ancestry
- Lithuanian 3% Italian 2% Romanian 1%
- Foreign-born
- 9% · Canada, Vietnam
- Languages at home
- 84% English-only · Spanish 10% French/Haitian/Cajun 2% Tagalog/Filipino 1%
Political lean MEDSL · St. Louis
- 2024 margin
- Strong D (+23.4) · D 60.8% · R 37.4% · Other 1.7%
- 2008→2024 swing
- +3.5pp toward D · 2008: 19.9pp · 2024: 23.4pp
- All cycles
- 2024: D+23.4 2020: D+24.0 2016: D+16.2 2012: D+13.7 2008: D+19.9
Not yet ingested
- Civics
- —
Market trends
- HPI YoY
- ▼ -276.62%
- Current HPI
- 223.9305
- Rent YoY
- ▲ 2.04%
- Metro
- St. Louis, MO-IL
- State GDP YoY
- ▲ 1.84%
- F500 in state
- 20
Industry mix (Fortune 500 HQ in MO)
| Industry | F500 HQs | Revenue |
|---|---|---|
| Healthcare | 1 | $163B |
|
||
| Insurance | 1 | $21B |
|
||
| Industrial Technology | 1 | $17B |
|
||
| Retail | 1 | $16B |
|
||
| Industrial Distribution | 1 | $10B |
|
||
| Utilities | 1 | $9B |
|
||
Price history
+95.4% since first listed18 events — show timeline
- 2026-05-06 Price Changed $97,500 MARIS as Distributed by MLS Grid
- 2026-04-03 Price Changed $107,500 MARIS as Distributed by MLS Grid
- 2026-02-27 Listed $114,900 MARIS as Distributed by MLS Grid
- 2025-11-19 Price Changed $109,900 MARIS as Distributed by MLS Grid
- 2025-11-14 Price Changed $114,900 MARIS as Distributed by MLS Grid
- 2025-10-18 Price Changed $122,900 MARIS as Distributed by MLS Grid
- 2025-10-11 Listed $124,900 MARIS as Distributed by MLS Grid
- 2025-10-10 Coming Soon — MARIS as Distributed by MLS Grid
- 2025-02-06 Delisted — MARIS as Distributed by MLS Grid
- 2025-01-16 Contingent — MARIS as Distributed by MLS Grid
- 2024-12-30 Listed $125,000 MARIS as Distributed by MLS Grid
- 2024-01-08 Delisted — MARIS as Distributed by MLS Grid
- 2023-11-07 Listed $124,900 MARIS as Distributed by MLS Grid
- 2023-08-02 Sold (MLS) — MARIS as Distributed by MLS Grid
- 2023-07-11 Pending — MARIS as Distributed by MLS Grid
- 2023-06-11 Listed $49,900 MARIS as Distributed by MLS Grid
- 2003-06-26 Sold (Public Records) — Public Records
- 1996-11-20 Sold (Public Records) — Public Records
Property tax history
+1.6%/yrLatest (2022): $1,090 · +0.2% YoY. Source: county tax records.
Cash-flow waterfall
monthlySold comps — $/sqft
last 12 mo · ≤1 miLoading sold comps…