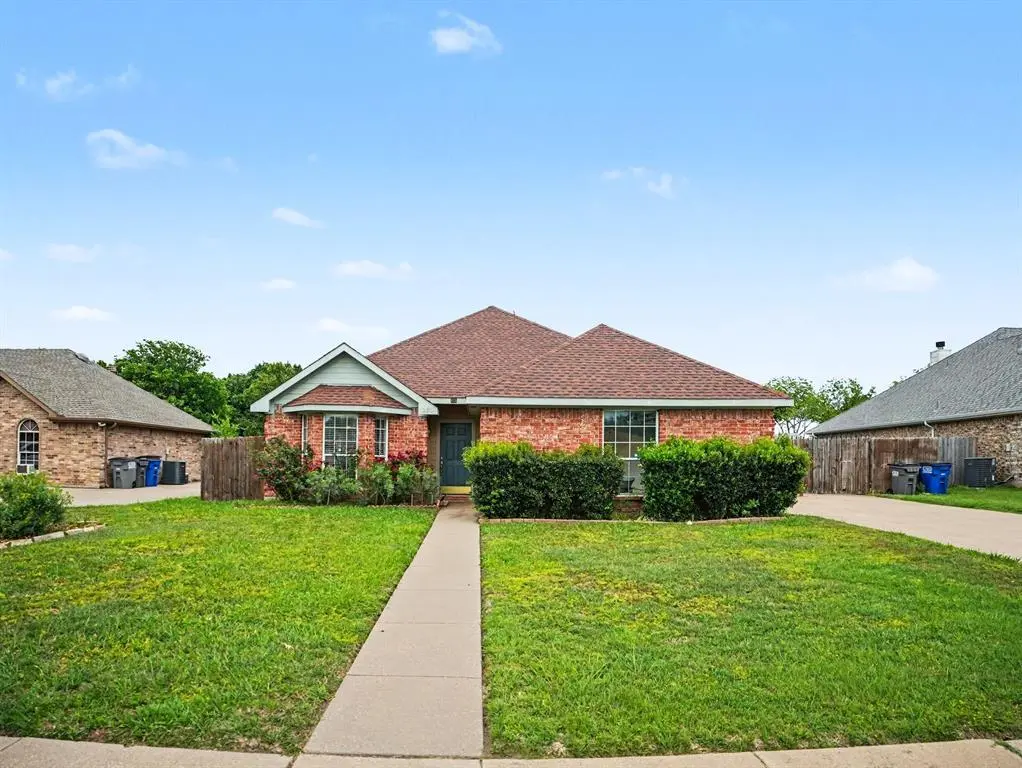
259 Cobblestone Cir · Red Oak, TX
Flood risk 1/10 · Minimal
- FEMA flood zone
- X (unshaded)
- Chance of flooding over 30 yrs
- 0.0%
- Est. flood insurance / yr
- $507 – $1,088
Fire risk 5/10 · Moderate
- Est. fire insurance / yr
- $1,222 – $2,270
Heat risk 7/10 · Major
- Hot days now (above 110°F)
- 7 days/yr
- Hot days in 30 yrs
- 25 days/yr
Wind risk 6/10 · Moderate
- Chance of severe wind over 30 yrs
- 27.0%
Air-quality risk 2/10 · Minimal
- Unhealthy air days now
- 1 days/yr
- Unhealthy air days in 30 yrs
- 2 days/yr
Risk factors via First Street. Map © Google.
Why this score? — see what drove the D- grade
The composite is a weighted blend of 9 inputs, each scored 0–100. Each bar is that input's sub-score; the figure is the points it added to the 100-point composite (weight × sub-score).
- ARV discount +11.0/15.0
- Cash flow +9.8/30.0
- Schools +3.5/10.0
- Livability +3.5/5.0
- 1% rule +3.2/10.0
- Rent growth +3.2/5.0
- DSCR +2.8/10.0
- Condition / age +2.5/5.0
- Appreciation +0.0/10.0
$299,000
🖨 Deal sheet 📄 Offer letter ✓ Due diligence
Listing remarks MLS
Charming single-story home located in the highly sought-after Red Oak ISD! This inviting property features a spacious combined living and dining area, perfect for entertaining or everyday living. Custom tile throughout home. The cozy living room is highlighted by a fireplace, creating a warm and welcoming atmosphere. The eat-in kitchen offers a comfortable space for casual meals and gatherings. The primary bedroom includes a private full bathroom, providing a relaxing retreat at the end of the day. Step outside to enjoy a large, fenced backyard—ideal for pets, play, or outdoor entertaining—complete with additional storage for your convenience. This home combines comfort, functionality, and great outdoor space—don’t miss the opportunity to make it yours!Discounted rate options and no lender fee future refinancing may be available for qualified buyers of this home.
Key facts
- Eat-in kitchen
- Single-story home
- Additional storage
Tags
Neighborhood map
What this means for you Summary
Snapshot
- This is a 3-bed/2.0-bath single-family listed at $299k.
Deal economics
- At list price, monthly cash flow is $-193 ($-2k/yr) — negative.
- To cash-flow at today's rent, offer at most $265k (11.4% below list).
- To meet the 1% rule (rent ≥ 1% of price), the offer needs to be $245k (18.2% below list).
- Recommended offer: $245k (18.2% below list) — sets the bar for 1% rule.
- Cap rate 5.5% vs local median 3.9% in Red Oak — top-decile yield for the area; either an underpriced asset or a hidden risk that comps aren't pricing in. Stress-test before assuming the spread holds.
Location & tenants
- Location reads 69/100 on livability (#435 in TX) — a middle-class / working-renter tenant base. Strengths: employment A+, housing A+, cost of living A; Watch: schools D, amenities F, commute F.
- Red Oak ISD (suburban): math 40% / reading 36% proficiency, ranked #384 of 826 in TX (top 46%) — families likely to look elsewhere, expect single-tenant / working-renter base with shorter leases.
- Market conditions: Rents rising (+3.0%/yr); 565 active listings in the ZIP; 8 comparable units currently listed for rent nearby; rentals at typical pace (median 24d on market — plan ~3-4 weeks tenant-placement turnaround); solid renter incomes; 3,016 units permitted in Ellis County in 2024 (20 in 5+ unit buildings).
Forward outlook
- Local home prices are declining (-3.0%/yr); year-one equity from $2k of loan paydown is wiped out by about $9k of value loss. Plan a longer hold.
- Ellis County population projected at +36% by 2050 — long-run rental-demand tailwind backs the buy-and-hold thesis.
Negotiation context
- It's been on market 55 days — a 3% lower offer ($290k) is reasonable based on typical stale-listing flexibility.
Risks & watch-outs
- Climate carrying-cost: major wind risk, 27% chance of damaging wind over 30y; moderate wildfire risk; extreme-heat days projected 7→25/yr by 2055 (HVAC capex compounding) — expect insurance premiums to compound above CPI over the hold.
Questions for the listing agent
- What do current leases actually rent for vs. the listed asking? Can we see a recent rent roll and the last 12 months of T-12 income?
- It's been on market 55 days. Have you received any prior offers? Is the seller open to a 18% concession, seller financing, or rate buy-down credit?
- Is there a deadline driving the sale (1031 exchange, divorce, estate, relocation)? That informs how much negotiation room exists.
- Schools are D-rated, which usually means shorter tenancies and higher turnover. Who's the typical renter profile here, and what's been the actual vacancy rate?
- The area grade is low — what's the realistic commute time and amenity access for the typical tenant pool here? Any planned neighborhood developments (good or bad) we should know about?
- What's the average days-on-market for RENTAL listings here right now (not sales)? A rising rental-DOM trend means longer vacancies and softer asking-rent achievability than the comps imply.
- What's the recent tenant-quality profile in this submarket — average credit score on applications, eviction rate, late-payment / NSF rate, and stable-employment percentage? A property-management company in the area should have these aggregated.
- How much new for-sale + rental construction is in the pipeline within 1–3 miles? Heavy new supply typically softens prices + rents 12–24 months out; constrained supply supports both.
Investment metrics
- 1% rule
- 0.82% ✗
- Cap rate
- 5.52%
- Cash-on-cash
- -2.77%
- DSCR
- 0.88
- GRM
- 10.2
CMA / ARV
- ARV (median comp)
- $324,078
- List price
- $299,000
- Delta
- -7.74%
- Verdict
- FAIR
- Comps
- 20 within 1.0 mi
Show comp detail 8 sales within ~0.75 mi
| Address | Dist | Beds/Ba | Sqft | Sold | Price | $/sf | Match |
|---|---|---|---|---|---|---|---|
| 225 Cobblestone Cir | 0.13mi | 3/2.0 | 1,564 (+9%) | 0mo | $330,000 | $211 | 79 |
| 120 Cole Rd | 0.62mi | 3/2.0 | 1,503 (+4%) | 5mo | $322,000 | $214 | 59 |
| 131 Stagecoach Dr | 0.58mi | 3/2.0 | 1,461 (+2%) | 14mo | $350,000 | $240 | 59 |
| 108 Deborde Cir | 0.67mi | 3/2.0 | 1,470 (+2%) | 22mo | $315,000 | $214 | 47 |
| 110 Troy Ln | 0.36mi | 3/2.0 | 1,607 (+12%) | 21mo | $294,900 | $184 | 46 |
| 118 Prairie View Ln | 0.73mi | 3/2.0 | 1,521 (+6%) | 14mo | $409,900 | $269 | 45 |
| 114 Anderson Rd | 0.66mi | 3/2.0 | 1,301 (-10%) | 12mo | $287,000 | $221 | 43 |
| 121 Prairie View Ln | 0.72mi | 3/2.0 | 1,256 (-13%) | 14mo | $325,000 | $259 | 34 |
Match score weights: distance 35% · size 25% · config 20% · recency 20%. Top-matched comps best support the ARV.
Projected returns pro-forma
-3.0% appreciation · 2.99% rent growth · sell at horizon
- IRR
- -20.9%
- Equity multiple
- 0.28×
- Total profit
- $-60,690
- Equity at exit
- $44,582
- IRR
- -14.2%
- Equity multiple
- 0.18×
- Total profit
- $-68,474
- Equity at exit
- $25,852
Cash invested: $83,720 (down + closing). Projections, not guarantees.
Landlord ↔ Tenant lean methodology
- Overall (STATE)
- 87 Strongly Landlord-Friendly
- State Texas
- 87 Strongly Landlord-Friendly · R+5
- County
- — inherits STATE
- City
- — inherits STATE
ZIP-level market 75154
- Home prices YoY
- -18.5%
- Rents YoY
- 3.0%
- Active inventory
- 565
- Price-to-rent
- 10.2×
Monthly cashflow live
- Estimated rent
- $2,446 high interval (Pro) →
- Mortgage (P&I)
- −$1,568
- Tax from tax record
- −$433 /mo · $5,191/yr
- Insurance
- −$125
- HOA
- −$0
- Vacancy / Maint / Mgmt
- −$514
- Net cashflow
- $-193
Break-even live
UW: 25.0% down · 7.5% · 30yr · 1.5% tax · 5.0% vac · 8.0% maint · 8.0% mgmt
Financing live
Cash to close
- Down payment
- $74,750
- Closing costs
- $8,970
- Reserves months
- —
- Total cash needed
- —
Loan-product check · same deal, 3 products live
Conventional
25% down · 7.5% · 30yr
- Down + closing
- —
- Monthly P&I
- —
- Monthly cashflow
- —
- DSCR
- —
- Eligible?
- —
Personal DTI + credit; lowest rate.
DSCR
20% down · 8.5% · 30yr
- Down + closing
- —
- Monthly P&I
- —
- Monthly cashflow
- —
- DSCR
- —
- Eligible?
- —
No personal income docs; deal must DSCR.
Hard money
10% down · 12.0% · 12mo
- Down + closing
- —
- Monthly P&I
- —
- Monthly cashflow
- —
- DSCR
- —
- Eligible?
- —
Short-term bridge; refi at stabilization.
Rent comps 8 comps
| Address | Beds | Baths | Sqft | Rent | $/sqft | DOM | Units | Dist |
|---|---|---|---|---|---|---|---|---|
| 628 Cherry Hill Rd Red Oak, TX | 4.0 | 2.0 | 1818 | $2,550 | $1.40 | 1d | 1 | 0.36mi |
| 240 Washington St Unit 201 Red Oak, TX | 2.0 | 2.0 | 1370 | $4,705 | $3.43 | 43d | 1 | 0.43mi |
| 103 Hollow Tree Dr Red Oak, TX | 3.0 | 2.0 | 1806 | $2,249 | $1.25 | 24d | 1 | 1.12mi |
| 306 Quail Run Rd Red Oak, TX | 3.0 | 2.0 | 1637 | $1,995 | $1.22 | 24d | 1 | 1.19mi |
| 214 Bob White Dr Red Oak, TX | 3.0 | 2.0 | 1533 | $2,299 | $1.50 | 22d | 1 | 1.33mi |
| 450 Lennox Rd Red Oak, TX | 3.0–4.0 | 2.5–3.5 | 1679 | $2,199 | $1.31 | 1d | 108 | 1.36mi |
| 112 Clover Leaf Ln Red Oak, TX | 3.0 | 2.0 | 1646 | $2,189 | $1.33 | 22d | 1 | 1.39mi |
| 213 Morningstar Ln Red Oak, TX | 4.0 | 2.0 | 1800 | $2,385 | $1.32 | 24d | 1 | 1.44mi |
Listing history 16 events
-
2026-06-16days on market $299,000 Active 55 DOM
-
2026-06-15days on market $299,000 Active 54 DOM
-
2026-06-13days on market $299,000 Active 52 DOM
-
2026-06-13days on market $299,000 Active 51 DOM
-
2026-06-09days on market $299,000 Active 48 DOM
-
2026-06-08days on market $299,000 Active 47 DOM
-
2026-06-07days on market $299,000 Active 46 DOM
-
2026-06-04days on market $299,000 Active 43 DOM
-
2026-06-03days on market $299,000 Active 42 DOM
-
2026-06-02days on market $299,000 Active 41 DOM
-
2026-06-01days on market $299,000 Active 40 DOM
-
2026-05-31days on market $299,000 Active 39 DOM
-
2026-05-18price $299,000 899-char remark
Show marketing remark (899 chars)
Charming single-story home located in the highly sought-after Red Oak ISD! This inviting property features a spacious combined living and dining area, perfect for entertaining or everyday living. Custom tile throughout home. The cozy living room is highlighted by a fireplace, creating a warm and welcoming atmosphere. The eat-in kitchen offers a comfortable space for casual meals and gatherings. The primary bedroom includes a private full bathroom, providing a relaxing retreat at the end of the day. Step outside to enjoy a large, fenced backyard—ideal for pets, play, or outdoor entertaining—complete with additional storage for your convenience. This home combines comfort, functionality, and great outdoor space—don’t miss the opportunity to make it yours!Discounted rate options and no lender fee future refinancing may be available for qualified buyers of this home.
-
2026-05-12price $303,000 899-char remark
Show marketing remark (899 chars)
Charming single-story home located in the highly sought-after Red Oak ISD! This inviting property features a spacious combined living and dining area, perfect for entertaining or everyday living. Custom tile throughout home. The cozy living room is highlighted by a fireplace, creating a warm and welcoming atmosphere. The eat-in kitchen offers a comfortable space for casual meals and gatherings. The primary bedroom includes a private full bathroom, providing a relaxing retreat at the end of the day. Step outside to enjoy a large, fenced backyard—ideal for pets, play, or outdoor entertaining—complete with additional storage for your convenience. This home combines comfort, functionality, and great outdoor space—don’t miss the opportunity to make it yours!Discounted rate options and no lender fee future refinancing may be available for qualified buyers of this home.
-
2026-04-22$315,000 Active 899-char remark
Show marketing remark (899 chars)
Charming single-story home located in the highly sought-after Red Oak ISD! This inviting property features a spacious combined living and dining area, perfect for entertaining or everyday living. Custom tile throughout home. The cozy living room is highlighted by a fireplace, creating a warm and welcoming atmosphere. The eat-in kitchen offers a comfortable space for casual meals and gatherings. The primary bedroom includes a private full bathroom, providing a relaxing retreat at the end of the day. Step outside to enjoy a large, fenced backyard—ideal for pets, play, or outdoor entertaining—complete with additional storage for your convenience. This home combines comfort, functionality, and great outdoor space—don’t miss the opportunity to make it yours!Discounted rate options and no lender fee future refinancing may be available for qualified buyers of this home.
-
2002-06-05soldstatus
ⓘ Source: listings_history table (triggers on properties + properties_extension) + one-shot
backfill from property_details.listing_events for pre-trigger history.
Tax reassessment forecast TX · Resets to sale price
- Current annual tax
- $5,191 · $433/mo
- Projected year-2 tax
- $5,472 · $456/mo
- Expected delta
- +$281/yr (+$23/mo · 5.4%)
ⓘ Screening estimate from a state-policy table — verify with the county assessor before closing.
Climate risk First Street
- Flood 1/10 Low FEMA zone X (unshaded) · 0% chance over 30 yrs
- Wildfire 5/10 Major
- Heat 7/10 Severe 7 d/yr ≥110°F today · 25 d/yr by 30 yrs out
- Wind 6/10 Major 27% chance of damaging wind over 30 yrs
- Air quality 2/10 Low 1 unhealthy d/yr today · 2 by 30 yrs out
Nearby sold comps map
Loading sold comps map…
Walkable amenities ~0.75 mi
Loading nearby amenities…
Taxation est. · year 1
- Rental income
- $29,350
- − Mortgage interest
- −$16,749
- − Property taxes
- −$5,191
- − Insurance
- −$1,495
- − Repairs & maintenance
- −$2,348
- − Management
- −$2,348
- − Depreciation
- −$8,698
- Taxable loss
- −$7,479
- Est. tax savings @ 24.0%
- +$1,795
- After-tax cash flow
- $-520/yr
For passive investors: Depreciation is non-cash, so a rental often shows a tax loss while cash-flowing — sheltering income. Rental losses are passive: they offset passive income freely, and up to $25,000/yr can offset ordinary (W-2) income if you actively participate and your MAGI is under $100k (phasing out to $0 by $150k); unused losses carry forward. On sale, claimed depreciation is recaptured at up to 25%, and gains may owe capital-gains tax (a 1031 exchange can defer both). Figures are a year-1 estimate at your 24.0% rate — not tax advice; consult a CPA.
Schools (NCES district)
- District
- Red Oak ISD
- NCES district ID
- 4836660
- Math proficiency
- 40% ▼ -12.00%
- Reading proficiency
- 36% ▼ -9.00%
- Median HH income
- $71,110
- Composite
- 34.88/100
- National rank
- #5084
- State rank
- #384 of 826 in TX
Livability — Red Oak
- Score
- 69/100
- State rank
- #435
- US rank
- #8931
Category grades
Schools grade is shown separately in the Schools card above.
Census & demographics
- Census place
- Red Oak, TX
- County
- Ellis County · 199,237 people
- City population
- 52,516
- Metro
- Dallas-Fort Worth-Arlington, TX
- Population (ZIP)
- 52,516
- Household income
- $100,388
- Rent vs Own
- Severe rent burden
- 1081.0
Population outlook (Ellis County) Hauer SSP2
- Today (2025)
- 194,556 people
- By 2030
- 209,679 · +7.8%
- By 2040
- 238,837 · +22.8%
- By 2050
- 265,451 · +36.4%
- By 2075
- 326,571 · +67.9%
- By 2100
- 362,156 · +86.1%
Race, ethnicity, and origin ACS 2023
- Neighborhood character
- Diverse neighborhood (Simpson 0.69)
- Race & ethnicity
- White 39% Black 30% Hispanic / Latino 27% Two or more races 12% Asian 1% Native American 1%
- Hispanic origin (detail)
- Mexican 25%
- Common ancestry
- Italian 2% Slovak 1%
- Foreign-born
- 9% · Canada, Jamaica
- Languages at home
- 80% English-only · Spanish 18%
Political lean MEDSL · Ellis
- 2024 margin
- Solid R (+31.1) · D 34.0% · R 65.1%
- 2008→2024 swing
- +11.2pp toward D · 2008: -42.2pp · 2024: -31.1pp
- All cycles
- 2024: R+31.1 2020: R+34.1 2016: R+45.4 2012: R+47.5 2008: R+42.2
Not yet ingested
- Civics
- —
Market trends
- HPI YoY
- ▼ -67.06%
- Current HPI
- 294.5836
- Rent YoY
- ▲ 2.99%
- Metro
- Dallas-Fort Worth-Arlington, TX
- State GDP YoY
- ▲ 3.95%
- F500 in state
- 110
Industry mix (Fortune 500 HQ in TX)
| Industry | F500 HQs | Revenue |
|---|---|---|
| Energy | 16 | $1,198B |
|
||
| Technology | 5 | $198B |
|
||
| Engineering / Construction | 4 | $72B |
|
||
| Energy Services | 3 | $60B |
|
||
| Utilities | 3 | $41B |
|
||
| Healthcare | 2 | $330B |
|
||
Price history
-5.1% since first listed4 events — show timeline
- 2026-05-18 Price Changed $299,000 NTREIS
- 2026-05-12 Price Changed $303,000 NTREIS
- 2026-04-22 Listed $315,000 NTREIS
- 2002-06-05 Sold (Public Records) — Public Records
Property tax history
+3.4%/yrLatest (2025): $5,191 · -2.5% YoY. Source: county tax records.
Cash-flow waterfall
monthlySold comps — $/sqft
last 12 mo · ≤1 miLoading sold comps…