903 Burnwood Rd · Downsville, NY
Flood risk 1/10 · Minimal
- FEMA flood zone
- X (unshaded)
- Chance of flooding over 30 yrs
- 0.0%
- Est. flood insurance / yr
- $473 – $860
Fire risk 1/10 · Minimal
- Est. fire insurance / yr
- $691 – $1,283
Heat risk 2/10 · Minimal
- Hot days now (above 89°F)
- 8 days/yr
- Hot days in 30 yrs
- 18 days/yr
Wind risk 2/10 · Minimal
- Chance of severe wind over 30 yrs
- 1.0%
Air-quality risk 2/10 · Minimal
- Unhealthy air days now
- 0 days/yr
- Unhealthy air days in 30 yrs
- 1 days/yr
Risk factors via First Street. Map © Google.
Why this score? — see what drove the C- grade
The composite is a weighted blend of 9 inputs, each scored 0–100. Each bar is that input's sub-score; the figure is the points it added to the 100-point composite (weight × sub-score).
- Cash flow +13.6/30.0
- Appreciation +10.0/10.0
- ARV discount +7.5/15.0
- DSCR +4.1/10.0
- 1% rule +4.0/10.0
- Schools +3.3/10.0
- Livability +3.0/5.0
- Rent growth +2.5/5.0
- Condition / age +2.5/5.0
$109,000
🖨 Deal sheet 📄 Offer letter ✓ Due diligence
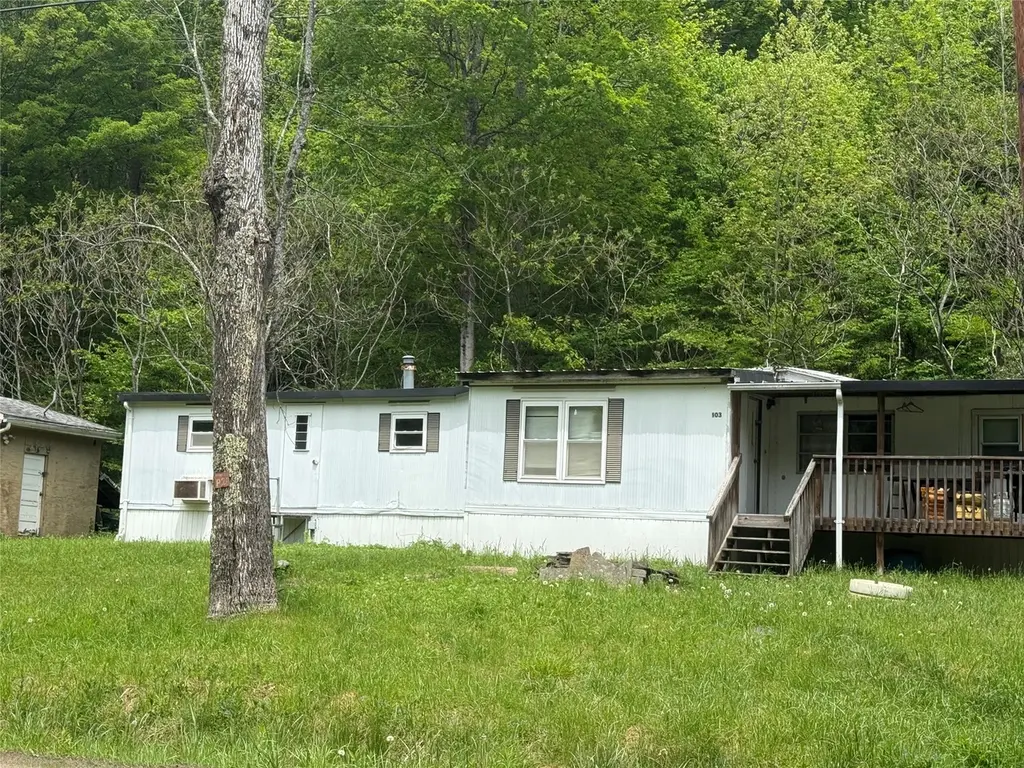
Listing remarks
Sitting on the outskirts of a river town. Enjoy your down time simply minutes from the East Branch of the river The home is tidy and has 2 bedrooms 1 bath. Simple hideaway at a simple price. Call today
Key facts
- 0.5 acre lot
- Built 1974
- Listed 23 days
Property features AI
Finance
- Financial info: Annual taxes listed
Exterior
- Parking: No designated parking
- Utilities: Well water; Septic tank; Cable available
- Home design: Manufactured single-wide home; Residential property
- Construction: Aluminum siding; Slab foundation; 856 above-grade finished area
- Exterior features: Wooded lot (approximately 0.5 acre)
Interior
- Flooring: Carpet; Vinyl
- Bathrooms: 1 full bathroom
- Heating & cooling: Propane heating
- Interior features: Carpet and vinyl flooring
Neighborhood map
What this means for you Summary
Snapshot
- This is a 1-bed/1.0-bath manufactured listed at $109k.
Deal economics
- At list price, monthly cash flow is $7 ($78/yr) — positive.
- The deal already cash-flows at list — no discount required.
- To meet the 1% rule (rent ≥ 1% of price), the offer needs to be $98k (10.0% below list).
- Recommended offer: $98k (10.0% below list) — sets the bar for 1% rule.
- Cap rate 6.4% vs local median 1.9% in Downsville — top-decile yield for the area; either an underpriced asset or a hidden risk that comps aren't pricing in. Stress-test before assuming the spread holds.
Location & tenants
- Location reads 60/100 on livability (#959 in NY) — a middle-class / working-renter tenant base. Strengths: cost of living A+, housing A+; Watch: employment D, schools F, crime F.
- Roscoe Central School District (rural): math 35% / reading 35% proficiency, ranked #689 of 755 in NY (top 91%) — families likely to look elsewhere, expect single-tenant / working-renter base with shorter leases.
- Market conditions: 57 active listings in the ZIP; 66 units permitted in Delaware County in 2024 (0 in 5+ unit buildings).
Forward outlook
- In year one you build about $12k of equity ($754 loan paydown + $11k appreciation (10.0% local appreciation)).
- Delaware County population projected at -27% by 2050 — secular population decline; favor cash flow + early exit over multi-decade hold.
- At projected returns (10.0% appreciation + 3.0% rent growth), your $31k cash investment doubles in ~3 years — after that, you're playing with house money.
- By year 4, paydown + projected appreciation supports a ~$41k cash-out refi (75% LTV) — recoverable capital for the next deal without selling this one.
Negotiation context
- It's been on market 24 days — a 2% lower offer ($107k) is reasonable based on typical stale-listing flexibility.
Questions for the listing agent
- Built in 1974 — when were the roof, HVAC, electrical panel, plumbing, and water heater last replaced?
- Is there a deadline driving the sale (1031 exchange, divorce, estate, relocation)? That informs how much negotiation room exists.
- Schools are F-rated, which usually means shorter tenancies and higher turnover. Who's the typical renter profile here, and what's been the actual vacancy rate?
- Crime grade is F in this area — have there been break-ins, vandalism, or insurance claims at this property in the last 3 years? What carrier currently insures it and at what premium?
- What's the average days-on-market for RENTAL listings here right now (not sales)? A rising rental-DOM trend means longer vacancies and softer asking-rent achievability than the comps imply.
- What's the recent tenant-quality profile in this submarket — average credit score on applications, eviction rate, late-payment / NSF rate, and stable-employment percentage? A property-management company in the area should have these aggregated.
- How much new for-sale + rental construction is in the pipeline within 1–3 miles? Heavy new supply typically softens prices + rents 12–24 months out; constrained supply supports both.
Investment metrics
- 1% rule
- 0.90% ✗
- Cap rate
- 6.36%
- Cash-on-cash
- 0.26%
- DSCR
- 1.01
- GRM
- 9.3
CMA / ARV
No comps found within radius.
Projected returns pro-forma
10.0% appreciation · 3.0% rent growth · sell at horizon
- IRR
- 24.5%
- Equity multiple
- 2.96×
- Total profit
- $59,802
- Equity at exit
- $98,196
- IRR
- 21.7%
- Equity multiple
- 6.76×
- Total profit
- $175,830
- Equity at exit
- $211,763
Cash invested: $30,520 (down + closing). Projections, not guarantees.
Landlord ↔ Tenant lean methodology
- Overall (STATE)
- 15 Strongly Tenant-Friendly
- State New York
- 15 Strongly Tenant-Friendly · D+10
- County
- — inherits STATE
- City
- — inherits STATE
ZIP-level market 13783
- Home prices YoY
- 2.9%
- Active inventory
- 57
- Price-to-rent
- 9.3×
Monthly cashflow live
- Estimated rent
- $981 medium interval (Pro) →
- Mortgage (P&I)
- −$572
- Tax from tax record
- −$151 /mo · $1,815/yr
- Insurance
- −$45
- HOA
- −$0
- Vacancy / Maint / Mgmt
- −$206
- Net cashflow
- $7
Break-even live
UW: 25.0% down · 7.5% · 30yr · 1.5% tax · 5.0% vac · 8.0% maint · 8.0% mgmt
Financing live
Cash to close
- Down payment
- $27,250
- Closing costs
- $3,270
- Reserves months
- —
- Total cash needed
- —
Loan-product check · same deal, 3 products live
Conventional
25% down · 7.5% · 30yr
- Down + closing
- —
- Monthly P&I
- —
- Monthly cashflow
- —
- DSCR
- —
- Eligible?
- —
Personal DTI + credit; lowest rate.
DSCR
20% down · 8.5% · 30yr
- Down + closing
- —
- Monthly P&I
- —
- Monthly cashflow
- —
- DSCR
- —
- Eligible?
- —
No personal income docs; deal must DSCR.
Hard money
10% down · 12.0% · 12mo
- Down + closing
- —
- Monthly P&I
- —
- Monthly cashflow
- —
- DSCR
- —
- Eligible?
- —
Short-term bridge; refi at stabilization.
Listing history 15 events
-
2026-06-18days on market $109,000 Active 24 DOM
-
2026-06-17days on market $109,000 Active 23 DOM
-
2026-06-16days on market $109,000 Active 22 DOM
-
2026-06-15days on market $109,000 Active 21 DOM
-
2026-06-13days on market $109,000 Active 19 DOM
-
2026-06-12days on market $109,000 Active 18 DOM
-
2026-06-09days on market $109,000 Active 15 DOM
-
2026-06-08days on market $109,000 Active 14 DOM
-
2026-06-07days on market $109,000 Active 13 DOM
-
2026-06-07days on market $109,000 Active 12 DOM
-
2026-06-04days on market $109,000 Active 9 DOM
-
2026-06-02days on market $109,000 Active 8 DOM
-
2026-06-01days on market $109,000 Active 7 DOM
-
2026-05-31days on market $109,000 Active 6 DOM
-
2026-05-26$109,000 Active
ⓘ Source: listings_history table (triggers on properties + properties_extension) + one-shot
backfill from property_details.listing_events for pre-trigger history.
Tax reassessment forecast NY · Partial reset (capped growth)
- Current annual tax
- $1,815 · $151/mo
- Projected year-2 tax
- $1,829 · $152/mo
- Expected delta
- +$14/yr (+$1/mo · 0.7%)
ⓘ Screening estimate from a state-policy table — verify with the county assessor before closing.
Climate risk First Street
- Flood 1/10 Low FEMA zone X (unshaded) · 0% chance over 30 yrs
- Wildfire 1/10 Low
- Heat 2/10 Low 8 d/yr ≥89°F today · 18 d/yr by 30 yrs out
- Wind 2/10 Low 100% chance of damaging wind over 30 yrs
- Air quality 2/10 Low 0 unhealthy d/yr today · 1 by 30 yrs out
Nearby sold comps map
Loading sold comps map…
Walkable amenities ~0.75 mi
Loading nearby amenities…
Taxation est. · year 1
- Rental income
- $11,769
- − Mortgage interest
- −$6,106
- − Property taxes
- −$1,815
- − Insurance
- −$545
- − Repairs & maintenance
- −$942
- − Management
- −$942
- − Depreciation
- −$3,171
- Taxable loss
- −$1,751
- Est. tax savings @ 24.0%
- +$420
- After-tax cash flow
- $498/yr
For passive investors: Depreciation is non-cash, so a rental often shows a tax loss while cash-flowing — sheltering income. Rental losses are passive: they offset passive income freely, and up to $25,000/yr can offset ordinary (W-2) income if you actively participate and your MAGI is under $100k (phasing out to $0 by $150k); unused losses carry forward. On sale, claimed depreciation is recaptured at up to 25%, and gains may owe capital-gains tax (a 1031 exchange can defer both). Figures are a year-1 estimate at your 24.0% rate — not tax advice; consult a CPA.
Schools (NCES district)
- District
- Roscoe Central School District
- NCES district ID
- 3625020
- Math proficiency
- 35% ▬ 0.00%
- Reading proficiency
- 35% ▬ 0.00%
- Median HH income
- $50,743
- Composite
- 33.05/100
- National rank
- #10658
- State rank
- #689 of 755 in NY
Livability — Downsville
- Score
- 60/100
- State rank
- #959
- US rank
- #18785
Category grades
Schools grade is shown separately in the Schools card above.
Census & demographics
- Population (ZIP)
- 2,200
Population outlook (Delaware County) Hauer SSP2
- Today (2025)
- 42,668 people
- By 2030
- 40,337 · -5.5%
- By 2040
- 35,514 · -16.8%
- By 2050
- 31,265 · -26.7%
- By 2075
- 24,455 · -42.7%
- By 2100
- 19,529 · -54.2%
Race, ethnicity, and origin ACS 2023
- Neighborhood character
- Predominantly White (91%)
- Race & ethnicity
- White 91% Hispanic / Latino 4% Asian 3% Two or more races 2% Black 1%
- Common ancestry
- Romanian 6% Serbian 3% Lithuanian 2%
- Foreign-born
- 9% · Canada
- Languages at home
- 97% English-only · Other Indo-European 2% Spanish 1% German/W. Germanic 1%
Political lean MEDSL · Delaware
- 2024 margin
- R (+19.8) · D 40.1% · R 59.9%
- 2008→2024 swing
- -14.6pp toward R · 2008: -5.2pp · 2024: -19.8pp
- All cycles
- 2024: R+19.8 2020: R+18.4 2016: R+29.2 2012: R+9.6 2008: R+5.2
Not yet ingested
- Civics
- —
Market trends
- HPI YoY
- ▲ 13.62%
- Current HPI
- 484.0977
- Rent YoY
- —
- Metro
- —
- State GDP YoY
- ▲ 2.60%
- F500 in state
- 92
Industry mix (Fortune 500 HQ in NY)
| Industry | F500 HQs | Revenue |
|---|---|---|
| Financial Services | 10 | $950B |
|
||
| Consumer Goods | 9 | $162B |
|
||
| Insurance | 4 | $225B |
|
||
| Telecommunications | 2 | $144B |
|
||
| Pharmaceuticals | 2 | $112B |
|
||
| Media / Entertainment | 2 | $69B |
|
||
Price history
1 event — show timeline
- 2026-05-26 Listed $109,000 GBAOR
Property tax history
+1.7%/yrLatest (2025): $1,815 · +3.2% YoY. Source: county tax records.
Cash-flow waterfall
monthlySold comps — $/sqft
last 12 mo · ≤1 miLoading sold comps…