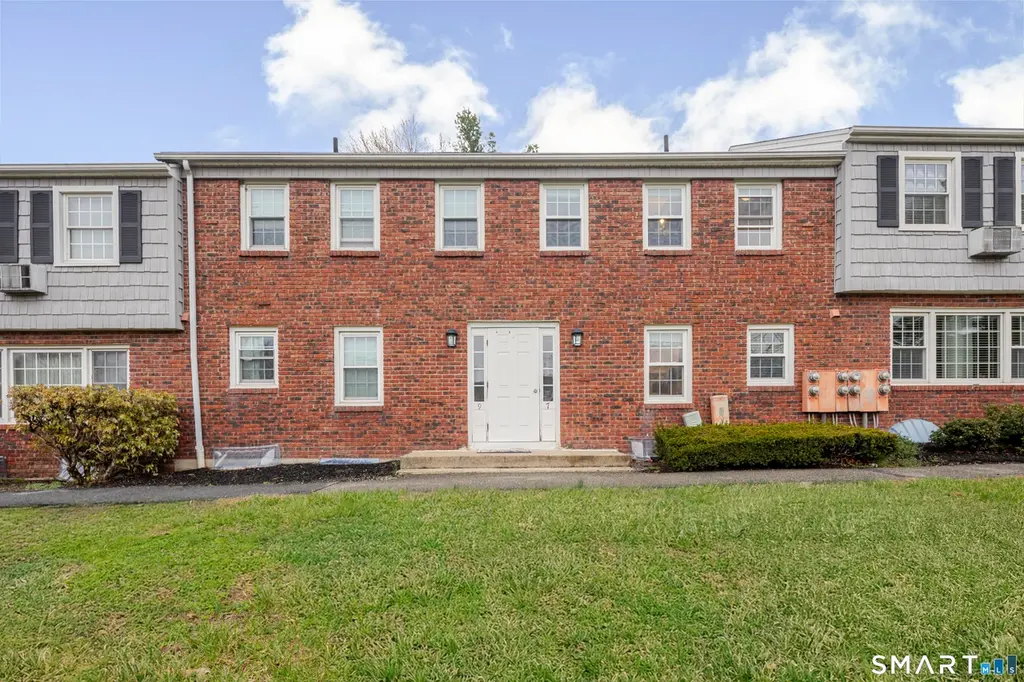
7 Old Farms Ln #7 · New Milford, CT
Flood risk No data
- FEMA flood zone
- —
- Chance of flooding over 30 yrs
- —
- Est. flood insurance / yr
- —
Fire risk No data
- Est. fire insurance / yr
- —
Heat risk No data
- Hot days now (above threshold)
- —
- Hot days in 30 yrs
- —
Wind risk No data
- Chance of severe wind over 30 yrs
- —
Air-quality risk No data
- Unhealthy air days now
- —
- Unhealthy air days in 30 yrs
- —
Risk factors via First Street. Map © Google.
Why this score? — see what drove the D grade
The composite is a weighted blend of 9 inputs, each scored 0–100. Each bar is that input's sub-score; the figure is the points it added to the 100-point composite (weight × sub-score).
- Cash flow +12.4/30.0
- ARV discount +7.5/15.0
- 1% rule +4.7/10.0
- Livability +4.3/5.0
- DSCR +3.7/10.0
- Schools +3.6/10.0
- Rent growth +2.5/5.0
- Condition / age +2.2/5.0
- Appreciation +0.0/10.0
$269,000
🖨 Deal sheet 📄 Offer letter ✓ Due diligence
Listing remarks MLS
Enjoy Community Gardens, Hiking Trails & Commuter Conveniences, Very Efficient Heating System, Both Fha & Va Ok, 16' Mbr Full Basement W/Laundry Hook-Ups, Carport Private Patio, Call L/O For Full Details.
Key facts
- Galley kitchen
- Blue-stone patio
- Lush yard
Tags
Property features AI
Finance
- Other: Pets allowed with restrictions (indoor cats only); Part of a multi-unit community (95 total units)
- HOA & community: Homeowner's association with monthly fee; HOA fee covers grounds maintenance, trash pickup, snow removal, water, sewer, property management and road maintenance
Exterior
- Parking: Carport; Unit garage; Detached garage (1 garage)
- Utilities: Public water connected; Septic sewer; Electric service for heat and hot water
- Home design: Condominium (Condo/Co-Op for sale); Part of the Old Farms complex
- Construction: Frame and brick construction
- Exterior features: Brick siding; Gutters; Exterior lighting; Patio; Level lot
Interior
- Kitchen: Electric range; Microwave; Refrigerator; Dishwasher
- Bedrooms: 2 bedrooms
- Bathrooms: 1 full bath; 1 half bath
- Heating & cooling: Radiant heat (electric); Ceiling fans; Wall unit cooling; Window unit cooling; Programmable thermostat; Electric domestic hot water
- Interior features: Open floor plan; Cable pre-wired; Full finished basement with interior access and storage — livable space; Foyer
- Laundry & utility: Washer and dryer included; Laundry located on the lower level
Neighborhood map
What this means for you Summary
Snapshot
- This is a 2-bed/1.5-bath condo listed at $269k. Condition is rated fair.
Deal economics
- At list price, monthly cash flow is $-43 ($-513/yr) — negative.
- To cash-flow at today's rent, offer at most $263k (2.3% below list).
- To meet the 1% rule (rent ≥ 1% of price), the offer needs to be $260k (3.2% below list).
- Recommended offer: $260k (3.2% below list) — sets the bar for 1% rule.
- Cap rate 6.1% vs local median 3.6% in New Milford — top-decile yield for the area; either an underpriced asset or a hidden risk that comps aren't pricing in. Stress-test before assuming the spread holds.
Location & tenants
- Location reads 86/100 on livability (#2 in CT, #371 nationally) — a professional / high-income tenant draw. Strengths: crime A+, commute A+, housing A+; Watch: cost of living C-, amenities D-.
- New Milford School District (suburban): math 29% / reading 47% proficiency, ranked #100 of 153 in CT (top 65%) — families likely to look elsewhere, expect single-tenant / working-renter base with shorter leases; only 15% free/reduced lunch — higher-income household profile.
- Zoned schools: New Milford High School (math 33% / reading 62%, grade D, #91 of 194 statewide, top 47%, 1,247 students, 31% FRL) — zoned schools average 31% FRL vs 15% district-wide (16 pts higher); higher-poverty schools than district average — tighter screening recommended.
- Market conditions: 147 active listings in the ZIP; 4 comparable units currently listed for rent nearby; rentals lingering (median 44d on market — plan ~5-8 weeks vacancy on turnover, expect pricing pressure); 100% of comp listings sitting > 30 days — soft ceiling on asking rent; solid renter incomes; 1,151 units permitted in Western Connecticut Planning Region in 2024 (714 in 5+ unit buildings).
- This rent runs 30% of the median local income ($104k/yr) — at the standard rent-burdened threshold; future hikes will face affordability resistance.
Forward outlook
- Local home prices are declining (-3.0%/yr); year-one equity from $2k of loan paydown is wiped out by about $8k of value loss. Plan a longer hold.
Negotiation context
- It's been on market 23 days — a 2% lower offer ($265k) is reasonable based on typical stale-listing flexibility.
- 3 sale attempts since 28y ago with the ask held roughly flat each time — persistent listings suggest the price (not the market) is what's stuck; bring a comps-based counter.
- Current owner paid $88k; list at $269k implies a 207% gain — meaningful room to come down on a strong offer.
Questions for the listing agent
- What do current leases actually rent for vs. the listed asking? Can we see a recent rent roll and the last 12 months of T-12 income?
- Have any recent inspections been done? Can we get a copy of the seller's disclosures and any deferred-maintenance estimates?
- Built in 1971 — when were the roof, HVAC, electrical panel, plumbing, and water heater last replaced?
- What does the HOA fee cover, when was the last increase, and are there any pending special assessments or reserve-fund shortfalls?
- Any open or pending special assessments — roof, HVAC, plumbing, elevator, façade? What's the per-unit balance and payoff schedule, and is the seller paying it off at close or rolling it to the buyer?
- Is there a deadline driving the sale (1031 exchange, divorce, estate, relocation)? That informs how much negotiation room exists.
- The area grade is low — what's the realistic commute time and amenity access for the typical tenant pool here? Any planned neighborhood developments (good or bad) we should know about?
- What's the average days-on-market for RENTAL listings here right now (not sales)? A rising rental-DOM trend means longer vacancies and softer asking-rent achievability than the comps imply.
- What's the recent tenant-quality profile in this submarket — average credit score on applications, eviction rate, late-payment / NSF rate, and stable-employment percentage? A property-management company in the area should have these aggregated.
- How much new apartment / multifamily construction is in the pipeline within 1–3 miles? Heavy new supply (>2% of stock underway) typically softens rents 12–24 months out; light construction supports rent growth.
Investment metrics
- 1% rule
- 0.97% ✗
- Cap rate
- 6.10%
- Cash-on-cash
- -0.68%
- DSCR
- 0.97
- GRM
- 8.6
CMA / ARV
No comps found within radius.
Projected returns pro-forma
-3.0% appreciation · 3.0% rent growth · sell at horizon
- IRR
- -17.3%
- Equity multiple
- 0.39×
- Total profit
- $-46,127
- Equity at exit
- $40,109
- IRR
- -9.2%
- Equity multiple
- 0.43×
- Total profit
- $-42,914
- Equity at exit
- $23,258
Cash invested: $75,320 (down + closing). Projections, not guarantees.
Landlord ↔ Tenant lean methodology
- Overall (STATE)
- 27 Tenant-Leaning
- State Connecticut
- 27 Tenant-Leaning · D+7
- County
- — inherits STATE
- City
- — inherits STATE
ZIP-level market 06776
- Active inventory
- 147
- Price-to-rent
- 8.6×
Monthly cashflow live
- Estimated rent
- $2,604 medium interval (Pro) →
- Mortgage (P&I)
- −$1,411
- Tax est. 1.5%
- −$336 /mo · $4,035/yr
- Insurance
- −$112
- HOA
- −$241
- Vacancy / Maint / Mgmt
- −$547
- Net cashflow
- $-43
Break-even live
UW: 25.0% down · 7.5% · 30yr · 1.5% tax · 5.0% vac · 8.0% maint · 8.0% mgmt
Financing live
Cash to close
- Down payment
- $67,250
- Closing costs
- $8,070
- Reserves months
- —
- Total cash needed
- —
Loan-product check · same deal, 3 products live
Conventional
25% down · 7.5% · 30yr
- Down + closing
- —
- Monthly P&I
- —
- Monthly cashflow
- —
- DSCR
- —
- Eligible?
- —
Personal DTI + credit; lowest rate.
DSCR
20% down · 8.5% · 30yr
- Down + closing
- —
- Monthly P&I
- —
- Monthly cashflow
- —
- DSCR
- —
- Eligible?
- —
No personal income docs; deal must DSCR.
Hard money
10% down · 12.0% · 12mo
- Down + closing
- —
- Monthly P&I
- —
- Monthly cashflow
- —
- DSCR
- —
- Eligible?
- —
Short-term bridge; refi at stabilization.
Rent comps 4 comps
| Address | Beds | Baths | Sqft | Rent | $/sqft | DOM | Units | Dist |
|---|---|---|---|---|---|---|---|---|
| 47 Old Farms Ln Unit 47 New Milford, CT | 2.0 | 1.5 | 1000 | $2,400 | $2.40 | 44d | 1 | 0.26mi |
| 15 Fordyce Ct #12 New Milford, CT | 3.0 | 1.0 | 950 | $1,850 | $1.95 | 44d | 1 | 0.55mi |
| 75 Lake Lillinonah Rd N Bridgewater, CT | 2.0 | 2.0 | 1344 | $7,500 | $5.58 | 44d | 1 | 1.17mi |
| 67 Lake Lillinonah Rd N Bridgewater, CT | 2.0 | 1.5 | 1152 | $3,500 | $3.04 | 44d | 1 | 1.21mi |
HOA detail condo
- Monthly dues
- $241 · $2,892/yr
- Assessments
- None detected in remarks — confirm with the listing agent.
Listing history 7 events
-
2026-04-30status Under Contract
-
2026-04-23historical Under Contract - Continue to Show
-
2026-04-06$269,000 Active
-
2005-11-15historical
-
2005-06-20$209,990
-
1998-09-10soldstatus $87,500 220-char remark
Show marketing remark (220 chars)
Enjoy Community Gardens, Hiking Trails & Commuter Conveniences, Very Efficient Heating System, Both Fha & Va Ok, 16' Mbr Full Basement W/Laundry Hook-Ups, Carport Private Patio, Call L/O For Full Details.
-
1998-07-23$89,900 220-char remark
Show marketing remark (220 chars)
Enjoy Community Gardens, Hiking Trails & Commuter Conveniences, Very Efficient Heating System, Both Fha & Va Ok, 16' Mbr Full Basement W/Laundry Hook-Ups, Carport Private Patio, Call L/O For Full Details.
ⓘ Source: listings_history table (triggers on properties + properties_extension) + one-shot
backfill from property_details.listing_events for pre-trigger history.
Nearby sold comps map
Loading sold comps map…
Walkable amenities ~0.75 mi
Loading nearby amenities…
Taxation est. · year 1
- Rental income
- $31,249
- − Mortgage interest
- −$15,068
- − Property taxes
- −$4,035
- − Insurance
- −$1,345
- − Repairs & maintenance
- −$2,500
- − Management
- −$2,500
- − HOA
- −$2,892
- − Depreciation
- −$7,825
- Taxable loss
- −$4,917
- Est. tax savings @ 24.0%
- +$1,180
- After-tax cash flow
- $667/yr
For passive investors: Depreciation is non-cash, so a rental often shows a tax loss while cash-flowing — sheltering income. Rental losses are passive: they offset passive income freely, and up to $25,000/yr can offset ordinary (W-2) income if you actively participate and your MAGI is under $100k (phasing out to $0 by $150k); unused losses carry forward. On sale, claimed depreciation is recaptured at up to 25%, and gains may owe capital-gains tax (a 1031 exchange can defer both). Figures are a year-1 estimate at your 24.0% rate — not tax advice; consult a CPA.
Condition & rehab AI · 2 photos
This tri-level brick townhome requires moderate repairs and maintenance, with potential for significant value increase through painting and updating the kitchen backsplash.
Repairs flagged
- Minor Exterior paint — Faded paint on exterior
- Minor Interior paint — Faded paint in some areas
- Minor Kitchen backsplash — Appears worn
Value-add opportunities
- Both Painting and updating kitchen backsplash — Enhances curb appeal and interior aesthetics
- Both Landscaping — Improves curb appeal and enhances property value
Renovation cost estimate screening
| Repair item | Severity | Est. cost |
|---|---|---|
| Exterior paint · Faded paint on exterior | Minor | $500–3,000 |
| Interior paint · Faded paint in some areas | Minor | $500–3,000 |
| Kitchen backsplash · Appears worn | Minor | $500–3,000 |
| Total estimated repair cost · 3 items | $1,500–9,000 |
Value-add ROI direction
- Both Painting and updating kitchen backsplash — Enhances curb appeal and interior aesthetics ↑
- Both Landscaping — Improves curb appeal and enhances property value ↑
ⓘ Cost ranges are severity-bucket heuristics (US national rule-of-thumb). Get contractor quotes + a written scope before underwriting a rehab budget.
Schools (NCES district)
- District
- New Milford School District
- NCES district ID
- 0902850
- Math proficiency
- 29% ▼ -22.00%
- Reading proficiency
- 47% ▼ -11.00%
- Median HH income
- $81,576
- Composite
- 35.78/100
- National rank
- #4839
- State rank
- #100 of 153 in CT
Livability — New Milford
- Score
- 86/100
- State rank
- #2
- US rank
- #371
Category grades
Schools grade is shown separately in the Schools card above.
Census & demographics
- Census place
- New Milford, CT
- County
- Litchfield County · 81,203 people
- City population
- 27,010
- Metro
- Torrington, CT
- Population (ZIP)
- 27,010
- Household income
- $104,112
- Rent vs Own
- Severe rent burden
- 627.0
Population outlook (Western Connecticut County) Hauer SSP2
- By 2040
- 685,031
Race, ethnicity, and origin ACS 2023
- Neighborhood character
- Predominantly White (77%)
- Race & ethnicity
- White 77% Hispanic / Latino 12% Two or more races 7% Black 4% Asian 4%
- Hispanic origin (detail)
- Puerto Rican 4% Dominican 2%
- Common ancestry
- Romanian 4% Lithuanian 3% Italian 2%
- Foreign-born
- 12% · Canada, China
- Languages at home
- 86% English-only · Spanish 6% Other Indo-European 3% Chinese 1%
Political lean MEDSL · Western Connecticut
- 2024 margin
- D (+19.1) · D 58.8% · R 39.7% · Other 1.6%
- All cycles
- 2024: D+19.1
Not yet ingested
- Civics
- —
Market trends
- HPI YoY
- ▼ -264.52%
- Current HPI
- 305.6036
- Rent YoY
- —
- Metro
- Torrington, CT
- State GDP YoY
- ▲ 1.06%
- F500 in state
- 38
Industry mix (Fortune 500 HQ in CT)
| Industry | F500 HQs | Revenue |
|---|---|---|
| Industrial Machinery | 4 | $38B |
|
||
| Insurance | 3 | $71B |
|
||
| Financial Services | 2 | $25B |
|
||
| Transportation / Logistics | 2 | $18B |
|
||
| Healthcare | 1 | $247B |
|
||
| Telecommunications | 1 | $55B |
|
||
Price history
+199.2% since first listed7 events — show timeline
- 2026-04-30 Pending — Smart MLS
- 2026-04-23 Contingent — Smart MLS
- 2026-04-06 Listed $269,000 Smart MLS
- 2005-11-15 Listing Removed — Smart MLS
- 2005-06-20 Listed $209,990 Smart MLS
- 1998-09-10 Sold (MLS) $87,500 Smart MLS
- 1998-07-23 Listed $89,900 Smart MLS
Cash-flow waterfall
monthlySold comps — $/sqft
last 12 mo · ≤1 miLoading sold comps…