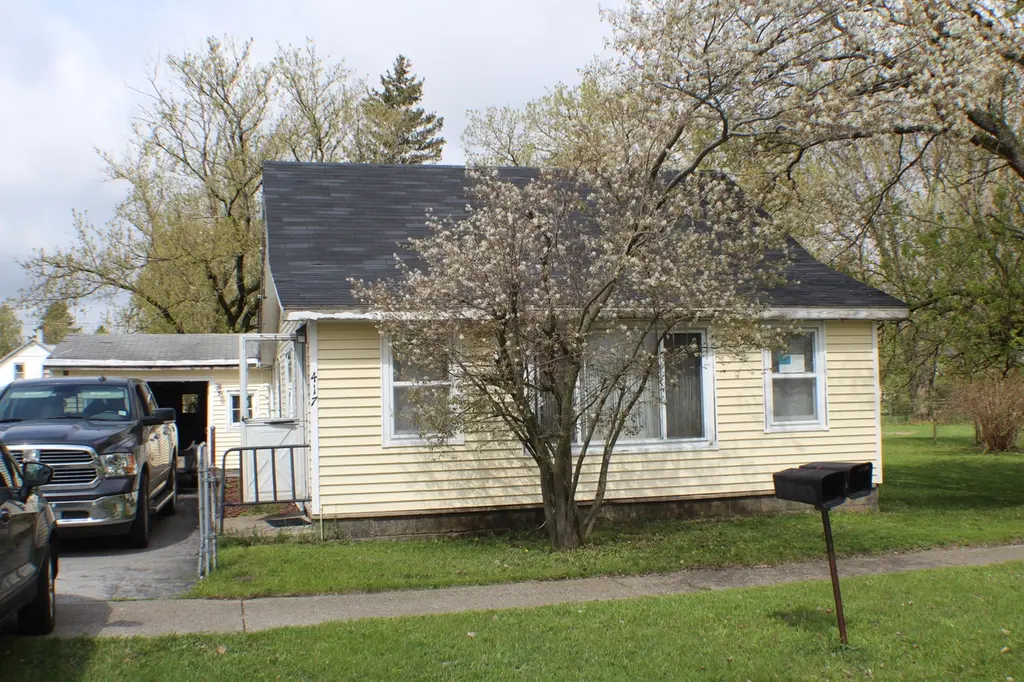
417 Elm St · Mancelona, MI
Flood risk 1/10 · Minimal
- FEMA flood zone
- —
- Chance of flooding over 30 yrs
- 0.0%
- Est. flood insurance / yr
- —
Fire risk 4/10 · Minor
- Est. fire insurance / yr
- $784 – $1,456
Heat risk 1/10 · Minimal
- Hot days now (above 92°F)
- 7 days/yr
- Hot days in 30 yrs
- 13 days/yr
Wind risk 1/10 · Minimal
- Chance of severe wind over 30 yrs
- —
Air-quality risk 2/10 · Minimal
- Unhealthy air days now
- 0 days/yr
- Unhealthy air days in 30 yrs
- 1 days/yr
Risk factors via First Street. Map © Google.
Why this score? — see what drove the B- grade
The composite is a weighted blend of 9 inputs, each scored 0–100. Each bar is that input's sub-score; the figure is the points it added to the 100-point composite (weight × sub-score).
- Cash flow +24.7/30.0
- ARV discount +15.0/15.0
- DSCR +8.0/10.0
- 1% rule +5.7/10.0
- Livability +3.9/5.0
- Schools +2.9/10.0
- Rent growth +2.5/5.0
- Condition / age +2.5/5.0
- Appreciation +0.0/10.0
$110,000
🖨 Deal sheet 📄 Offer letter ✓ Due diligence
Listing remarks MLS
Here is an opportunity to finish it your way It has a newer roof and updated electrical panel and bathroom. come check it out and see it for yourself , great way to build some sweat equity Cash or conventional terms, property is being sold AS IS with no repairs from the sellers.
Key facts
- Newer roof
- Updated bathroom
- 8,024 sq ft lot
Tags
Property features AI
Exterior
- Parking: Attached garage (1 car)
- Utilities: Public water; Electric water heater
- Home design: Ranch-style single family residence; Built in 1940
- Construction: Vinyl siding; Asphalt roof; Crawl space/partial basement
- Exterior features: Paved road access
Interior
- Kitchen: Range
- Bedrooms: Primary bedroom; Bedroom 2; Bedroom 3
- Bathrooms: One full bathroom
- Heating & cooling: Forced air heating
- Interior features: Seven total rooms; Crawl space/partial basement
- Laundry & utility: Electric water heater
Neighborhood map
What this means for you Summary
Snapshot
- This is a 3-bed/1.0-bath single-family listed at $110k.
Deal economics
- At list price, monthly cash flow is $231 ($3k/yr) — positive.
- The deal already cash-flows at list — no discount required.
- Meets the 1% rule at list price ($1k rent vs $110k).
- Recommended offer: $107k (3.0% below list) — sets the bar for market timing.
- Cap rate 8.8% vs local median 3.3% in Mancelona — top-decile yield for the area; either an underpriced asset or a hidden risk that comps aren't pricing in. Stress-test before assuming the spread holds.
Location & tenants
- Location reads 78/100 on livability (#105 in MI, #2,568 nationally) — a middle-class / working-renter tenant base. Strengths: cost of living A+, housing A+, health & safety A+; Watch: schools D-, amenities F, commute F.
- Mancelona Public Schools (rural): math 28% / reading 41% proficiency, ranked #310 of 540 in MI (top 57%) — families likely to look elsewhere, expect single-tenant / working-renter base with shorter leases; 60% free/reduced lunch — lower-income household profile, screen leases tightly.
- Market conditions: 151 active listings in the ZIP; 101 units permitted in Antrim County in 2024 (0 in 5+ unit buildings).
Forward outlook
- Local home prices are declining (-3.0%/yr); year-one equity from $761 of loan paydown is wiped out by about $3k of value loss. Plan a longer hold.
- Antrim County population projected at -27% by 2050 — secular population decline; favor cash flow + early exit over multi-decade hold.
Negotiation context
- It's been on market 32 days — a 3% lower offer ($107k) is reasonable based on typical stale-listing flexibility.
- 3 sale attempts; this cycle's ask has dropped $15k (12%) from the opening price — seller is motivated, your offer sets the floor, not the list.
Risks & watch-outs
- Watch-outs: built in 1940 — expect roof / HVAC / electrical / plumbing capex.
Questions for the listing agent
- It's been on market 32 days. Have you received any prior offers? Is the seller open to a 3% concession, seller financing, or rate buy-down credit?
- Built in 1940 — when were the roof, HVAC, electrical panel, plumbing, and water heater last replaced?
- Is there a deadline driving the sale (1031 exchange, divorce, estate, relocation)? That informs how much negotiation room exists.
- Schools are D-rated, which usually means shorter tenancies and higher turnover. Who's the typical renter profile here, and what's been the actual vacancy rate?
- What's the average days-on-market for RENTAL listings here right now (not sales)? A rising rental-DOM trend means longer vacancies and softer asking-rent achievability than the comps imply.
- What's the recent tenant-quality profile in this submarket — average credit score on applications, eviction rate, late-payment / NSF rate, and stable-employment percentage? A property-management company in the area should have these aggregated.
- How much new for-sale + rental construction is in the pipeline within 1–3 miles? Heavy new supply typically softens prices + rents 12–24 months out; constrained supply supports both.
Investment metrics
- 1% rule
- 1.07% ✓
- Cap rate
- 8.81%
- Cash-on-cash
- 8.98%
- DSCR
- 1.40
- GRM
- 7.8
CMA / ARV
- ARV (on-the-fly)
- $190,624
- Comps found
- 8
Show comp detail 8 sales within ~0.75 mi
| Address | Dist | Beds/Ba | Sqft | Sold | Price | $/sf | Match |
|---|---|---|---|---|---|---|---|
| 401 Monroe St | 0.17mi | 3/1.5 | 1,408 (+9%) | 8mo | $231,000 | $164 | 68 |
| 8431 N Maple Ave | 0.27mi | 2/2.0 (-1) | 1,284 (-0%) | 13mo | $231,000 | $180 | 67 |
| 219 E Main St | 0.39mi | 4/1.0 (+1) | 1,345 (+4%) | 6mo | $125,000 | $93 | 64 |
| 208 S Washington St Lot : 20 | 0.51mi | 3/1.5 | 1,260 (-2%) | 18mo | $222,450 | $177 | 55 |
| 8934 Roberts Rd | 0.62mi | 3/1.0 | 1,180 (-8%) | 9mo | $175,000 | $148 | 50 |
| 8869 Townview Dr | 0.72mi | 3/2.0 | 1,305 (+1%) | 12mo | $159,500 | $122 | 50 |
| 510 S Maple St | 0.60mi | 2/1.0 (-1) | 1,192 (-8%) | 8mo | $135,200 | $113 | 48 |
| 8324 Us-131 | 0.48mi | 3/1.0 | 1,150 (-11%) | 22mo | $159,000 | $138 | 42 |
Match score weights: distance 35% · size 25% · config 20% · recency 20%. Top-matched comps best support the ARV.
Projected returns pro-forma
-3.0% appreciation · 3.0% rent growth · sell at horizon
- IRR
- -2.7%
- Equity multiple
- 0.90×
- Total profit
- $-3,165
- Equity at exit
- $16,401
- IRR
- 6.9%
- Equity multiple
- 1.52×
- Total profit
- $16,061
- Equity at exit
- $9,511
Cash invested: $30,800 (down + closing). Projections, not guarantees.
Landlord ↔ Tenant lean methodology
- Overall (STATE)
- 62 Landlord-Friendly
- State Michigan
- 62 Landlord-Friendly · EVEN
- County
- — inherits STATE
- City
- — inherits STATE
ZIP-level market 49659
- Home prices YoY
- -29.7%
- Active inventory
- 151
- Price-to-rent
- 7.8×
Monthly cashflow live
- Estimated rent
- $1,173 medium interval (Pro) →
- Mortgage (P&I)
- −$577
- Tax from tax record
- −$73 /mo · $882/yr
- Insurance
- −$46
- HOA
- −$0
- Vacancy / Maint / Mgmt
- −$246
- Net cashflow
- $231
Break-even live
UW: 25.0% down · 7.5% · 30yr · 1.5% tax · 5.0% vac · 8.0% maint · 8.0% mgmt
Financing live
Cash to close
- Down payment
- $27,500
- Closing costs
- $3,300
- Reserves months
- —
- Total cash needed
- —
Loan-product check · same deal, 3 products live
Conventional
25% down · 7.5% · 30yr
- Down + closing
- —
- Monthly P&I
- —
- Monthly cashflow
- —
- DSCR
- —
- Eligible?
- —
Personal DTI + credit; lowest rate.
DSCR
20% down · 8.5% · 30yr
- Down + closing
- —
- Monthly P&I
- —
- Monthly cashflow
- —
- DSCR
- —
- Eligible?
- —
No personal income docs; deal must DSCR.
Hard money
10% down · 12.0% · 12mo
- Down + closing
- —
- Monthly P&I
- —
- Monthly cashflow
- —
- DSCR
- —
- Eligible?
- —
Short-term bridge; refi at stabilization.
Listing history 18 events
-
2026-06-18days on market $110,000 Active 32 DOM
-
2026-06-17days on market $110,000 Active 31 DOM
-
2026-06-16days on market $110,000 Active 30 DOM
-
2026-06-15days on market $110,000 Active 29 DOM
-
2026-06-13days on market $110,000 Active 27 DOM
-
2026-06-12pricedays on market $110,000 Active 26 DOM
-
2026-06-09days on market $118,000 Active 23 DOM
-
2026-06-08days on market $118,000 Active 22 DOM
-
2026-06-07days on market $118,000 Active 21 DOM
-
2026-06-05days on market $118,000 Active 19 DOM
-
2026-06-04pricedays on market $118,000 Active 17 DOM
-
2026-06-02days on market $125,000 Active 16 DOM
-
2026-06-01days on market $125,000 Active 15 DOM
-
2026-05-31days on market $125,000 Active 14 DOM
-
2026-05-31days on market $125,000 Active 13 DOM
-
2026-05-16$125,000 Active
Show marketing remark (279 chars)
Here is an opportunity to finish it your way It has a newer roof and updated electrical panel and bathroom. come check it out and see it for yourself , great way to build some sweat equity Cash or conventional terms, property is being sold AS IS with no repairs from the sellers.
-
2026-05-16$125,000 Active 280-char remark
Show marketing remark (279 chars)
Here is an opportunity to finish it your way It has a newer roof and updated electrical panel and bathroom. come check it out and see it for yourself , great way to build some sweat equity Cash or conventional terms, property is being sold AS IS with no repairs from the sellers.
-
2026-05-16$125,000 Active 279-char remark
Show marketing remark (279 chars)
Here is an opportunity to finish it your way It has a newer roof and updated electrical panel and bathroom. come check it out and see it for yourself , great way to build some sweat equity Cash or conventional terms, property is being sold AS IS with no repairs from the sellers.
ⓘ Source: listings_history table (triggers on properties + properties_extension) + one-shot
backfill from property_details.listing_events for pre-trigger history.
Tax reassessment forecast MI · Partial reset (capped growth)
- Current annual tax
- $882 · $73/mo
- Projected year-2 tax
- $1,288 · $107/mo
- Expected delta
- +$406/yr (+$34/mo · 46.1%)
ⓘ Screening estimate from a state-policy table — verify with the county assessor before closing.
Climate risk First Street
- Flood 1/10 Low 0% chance over 30 yrs
- Wildfire 4/10 Moderate
- Heat 1/10 Low 7 d/yr ≥92°F today · 13 d/yr by 30 yrs out
- Wind 1/10 Low
- Air quality 2/10 Low 0 unhealthy d/yr today · 1 by 30 yrs out
Nearby sold comps map
Loading sold comps map…
Walkable amenities ~0.75 mi
Loading nearby amenities…
Taxation est. · year 1
- Rental income
- $14,076
- − Mortgage interest
- −$6,162
- − Property taxes
- −$882
- − Insurance
- −$550
- − Repairs & maintenance
- −$1,126
- − Management
- −$1,126
- − Depreciation
- −$3,200
- Taxable income
- $1,031
- Est. tax owed @ 24.0%
- −$247
- After-tax cash flow
- $2,519/yr
For passive investors: Depreciation is non-cash, so a rental often shows a tax loss while cash-flowing — sheltering income. Rental losses are passive: they offset passive income freely, and up to $25,000/yr can offset ordinary (W-2) income if you actively participate and your MAGI is under $100k (phasing out to $0 by $150k); unused losses carry forward. On sale, claimed depreciation is recaptured at up to 25%, and gains may owe capital-gains tax (a 1031 exchange can defer both). Figures are a year-1 estimate at your 24.0% rate — not tax advice; consult a CPA.
Schools (NCES district)
- District
- Mancelona Public Schools
- NCES district ID
- 2622350
- Math proficiency
- 28% ▼ -5.00%
- Reading proficiency
- 41% ▼ -9.00%
- Median HH income
- $39,613
- Composite
- 28.89/100
- National rank
- #6639
- State rank
- #310 of 540 in MI
Livability — Mancelona
- Score
- 78/100
- State rank
- #105
- US rank
- #2568
Category grades
Schools grade is shown separately in the Schools card above.
Census & demographics
- Census place
- Mancelona, MI
- Population (ZIP)
- 7,226
Population outlook (Antrim County) Hauer SSP2
- Today (2025)
- 21,804 people
- By 2030
- 20,814 · -4.5%
- By 2040
- 18,394 · -15.6%
- By 2050
- 15,981 · -26.7%
- By 2075
- 11,712 · -46.3%
- By 2100
- 7,651 · -64.9%
Race, ethnicity, and origin ACS 2023
- Neighborhood character
- Predominantly White (93%)
- Race & ethnicity
- White 93% Two or more races 4% Hispanic / Latino 3%
- Common ancestry
- Lithuanian 7% Romanian 5% Italian 4%
- Foreign-born
- 1% · Canada
Political lean MEDSL · Antrim
- 2024 margin
- Strong R (+23.8) · D 37.5% · R 61.2% · Other 1.2%
- 2008→2024 swing
- -13.4pp toward R · 2008: -10.3pp · 2024: -23.8pp
- All cycles
- 2024: R+23.8 2020: R+23.8 2016: R+29.6 2012: R+21.3 2008: R+10.3
Not yet ingested
- Civics
- —
Market trends
- HPI YoY
- ▼ -103.79%
- Current HPI
- 245.5937
- Rent YoY
- —
- Metro
- —
- State GDP YoY
- ▲ 1.37%
- F500 in state
- 28
Industry mix (Fortune 500 HQ in MI)
| Industry | F500 HQs | Revenue |
|---|---|---|
| Automotive Parts | 3 | $48B |
|
||
| Automotive | 2 | $372B |
|
||
| Chemicals | 1 | $45B |
|
||
| Automotive Retail | 1 | $29B |
|
||
| Healthcare / Medical Devices | 1 | $23B |
|
||
| Automotive Technology | 1 | $20B |
|
||
Price history
+0.0% since first listed3 events — show timeline
- 2026-05-16 Listed $125,000 MiRealSource-MiMLS
- 2026-05-16 Listed $125,000 REALCOMP
- 2026-05-16 Listed $125,000 SW Michigan MLS
Property tax history
+0.8%/yrLatest (2025): $882 · -12.4% YoY. Source: county tax records.
Cash-flow waterfall
monthlySold comps — $/sqft
last 12 mo · ≤1 miLoading sold comps…