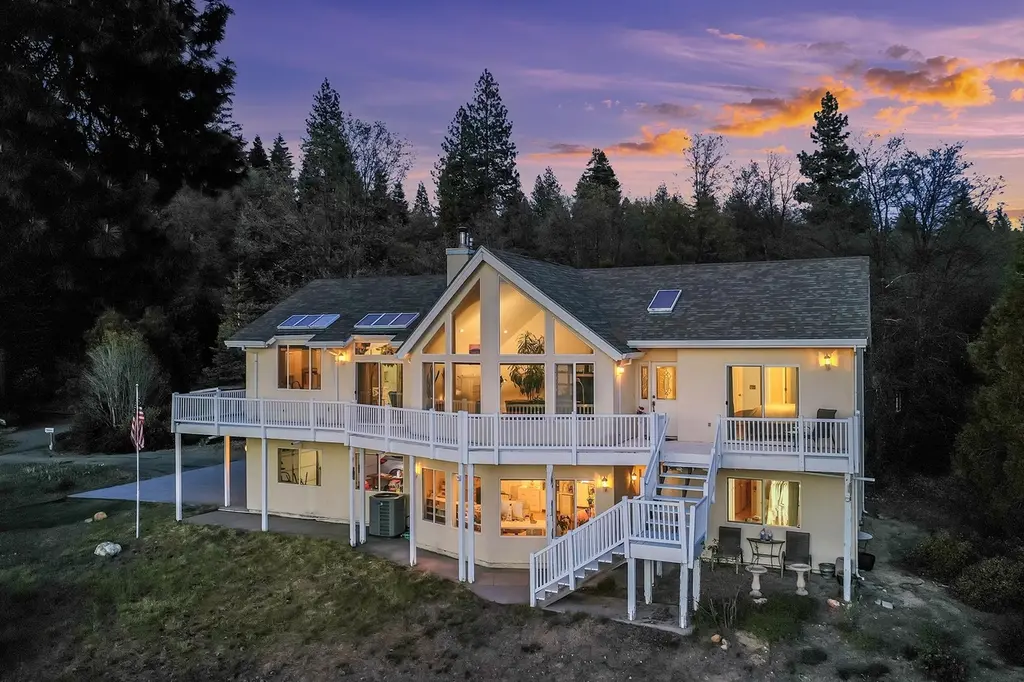
1812 Shasta Acres Rd · Mount Shasta, CA
Flood risk 1/10 · Minimal
- FEMA flood zone
- X (unshaded)
- Chance of flooding over 30 yrs
- 0.0%
- Est. flood insurance / yr
- $507 – $1,088
Fire risk 5/10 · Moderate
- Est. fire insurance / yr
- $659 – $1,223
Heat risk 3/10 · Minor
- Hot days now (above 92°F)
- 7 days/yr
- Hot days in 30 yrs
- 17 days/yr
Wind risk 1/10 · Minimal
- Chance of severe wind over 30 yrs
- —
Air-quality risk 10/10 · Severe
- Unhealthy air days now
- 34 days/yr
- Unhealthy air days in 30 yrs
- 34 days/yr
Risk factors via First Street. Map © Google.
Why this score? — see what drove the B- grade
The composite is a weighted blend of 9 inputs, each scored 0–100. Each bar is that input's sub-score; the figure is the points it added to the 100-point composite (weight × sub-score).
- Cash flow +26.9/30.0
- ARV discount +15.0/15.0
- DSCR +9.3/10.0
- 1% rule +6.5/10.0
- Schools +3.6/10.0
- Livability +3.2/5.0
- Rent growth +2.5/5.0
- Condition / age +2.5/5.0
- Appreciation +0.0/10.0
$698,000
🖨 Deal sheet 📄 Offer letter ✓ Due diligence
Listing remarks
Just minutes from downtown, come experience spectacular views from this spacious, light-filled 2,590+/- sq. ft. home on the slopes of Mt. Shasta. Upstairs, you'll find vaulted ceilings, large windows with auto-blinds, bamboo flooring, and an open kitchen, dining, & living area offering a welcoming space. There is also a laundry room, office with two built-in desks, a service elevator, two bedrooms and bathrooms, including an expansive master suite with a jetted tub and walk-in shower. Downstairs are two more bedrooms, a bathroom, and a spacious family room. This home's floor plan is perfect for guests, or flexible living. The large garage includes a work area, or it could be used as a
Key facts
- Large windows
- Bamboo flooring
- Vaulted ceilings
Tags
Property features AI
Exterior
- Parking: Attached garage with 2 spaces
- Utilities: Private well water; Propane; Septic tank
- Home design: Single family residence; 2 stories; Residential zoning (Res1)
- Construction: Stucco exterior; Composition roof
- Exterior features: Garden; Deck; Shed(s)
Interior
- Kitchen: Cooktop; Electric oven; Electric range; Microwave; Dishwasher; Garbage disposal; Refrigerator
- Bedrooms: Walk-in closet(s) in bedroom(s)
- Flooring: Carpet; Laminate; Tile; Vinyl; Wood
- Heating & cooling: Fireplace insert heating
- Interior features: Vaulted ceilings; Walk-in closets; Kitchen island; Skylight(s); Two fireplaces (family room and living room)
- Laundry & utility: Washer; Dryer
Neighborhood map
What this means for you Summary
Snapshot
- This is a 4-bed/3.0-bath single-family listed at $698k.
Deal economics
- At list price, monthly cash flow is $2k ($23k/yr) — positive.
- The deal already cash-flows at list — no discount required.
- Meets the 1% rule at list price ($8k rent vs $698k).
- Recommended offer: $677k (3.0% below list) — sets the bar for market timing.
- Cap rate 9.6% vs local median 4.8% in Mount Shasta — top-decile yield for the area; either an underpriced asset or a hidden risk that comps aren't pricing in. Stress-test before assuming the spread holds.
Location & tenants
- Location reads 64/100 on livability (#405 in CA) — a middle-class / working-renter tenant base. Strengths: health & safety A+; Watch: housing C-, employment D+, crime F.
- Siskiyou Union High (rural): math 25% / reading 55% proficiency, ranked #763 of 1,400 in CA (top 54%) — families likely to look elsewhere, expect single-tenant / working-renter base with shorter leases; only 12% free/reduced lunch — higher-income household profile.
- Market conditions: 273 active listings in the ZIP; 1 comparable units currently listed for rent nearby; 50 units permitted in Siskiyou County in 2024 (0 in 5+ unit buildings).
Forward outlook
- Local home prices are declining (-3.0%/yr); year-one equity from $5k of loan paydown is wiped out by about $21k of value loss. Plan a longer hold.
- Siskiyou County population projected at -26% by 2050 — secular population decline; favor cash flow + early exit over multi-decade hold.
- At projected returns (-3.0% appreciation + 3.0% rent growth), your $195k cash investment doubles in ~10 years — after that, you're playing with house money.
Negotiation context
- It's been on market 49 days — a 3% lower offer ($677k) is reasonable based on typical stale-listing flexibility.
- 2 sale attempts since 8y ago with the ask held roughly flat each time — persistent listings suggest the price (not the market) is what's stuck; bring a comps-based counter.
- Current owner paid $425k; list at $698k implies a 64% gain — meaningful room to come down on a strong offer.
Risks & watch-outs
- Climate carrying-cost: moderate wildfire risk — expect insurance premiums to compound above CPI over the hold.
Questions for the listing agent
- It's been on market 49 days. Have you received any prior offers? Is the seller open to a 3% concession, seller financing, or rate buy-down credit?
- Is there a deadline driving the sale (1031 exchange, divorce, estate, relocation)? That informs how much negotiation room exists.
- Crime grade is F in this area — have there been break-ins, vandalism, or insurance claims at this property in the last 3 years? What carrier currently insures it and at what premium?
- What's the average days-on-market for RENTAL listings here right now (not sales)? A rising rental-DOM trend means longer vacancies and softer asking-rent achievability than the comps imply.
- What's the recent tenant-quality profile in this submarket — average credit score on applications, eviction rate, late-payment / NSF rate, and stable-employment percentage? A property-management company in the area should have these aggregated.
- How much new for-sale + rental construction is in the pipeline within 1–3 miles? Heavy new supply typically softens prices + rents 12–24 months out; constrained supply supports both.
Investment metrics
- 1% rule
- 1.15% ✓
- Cap rate
- 9.63%
- Cash-on-cash
- 11.93%
- DSCR
- 1.53
- GRM
- 7.3
CMA / ARV
- ARV (on-the-fly)
- $950,530
- Comps found
- 3
Show comp detail 3 sales within ~0.75 mi
| Address | Dist | Beds/Ba | Sqft | Sold | Price | $/sf | Match |
|---|---|---|---|---|---|---|---|
| 1901 Shasta Acres Rd | 0.13mi | 3/3.0 (-1) | 2,206 (-15%) | 11mo | $810,000 | $367 | 55 |
| 611 Monroe Way | 0.47mi | 3/2.0 (-1) | 2,729 (+5%) | 12mo | $925,000 | $339 | 51 |
| 1726 Cold Creek Cir | 0.29mi | 4/2.5 | 2,240 (-14%) | 23mo | $1,145,000 | $511 | 42 |
Match score weights: distance 35% · size 25% · config 20% · recency 20%. Top-matched comps best support the ARV.
Projected returns pro-forma
-3.0% appreciation · 3.0% rent growth · sell at horizon
- IRR
- 1.4%
- Equity multiple
- 1.05×
- Total profit
- $10,464
- Equity at exit
- $104,074
- IRR
- 11.0%
- Equity multiple
- 1.86×
- Total profit
- $167,802
- Equity at exit
- $60,350
Cash invested: $195,440 (down + closing). Projections, not guarantees.
Landlord ↔ Tenant lean methodology
- Overall (STATE)
- 18 Strongly Tenant-Friendly
- State California
- 18 Strongly Tenant-Friendly · D+13
- County
- — inherits STATE
- City
- — inherits STATE
ZIP-level market 96094
- Active inventory
- 273
- Price-to-rent
- 7.3×
Monthly cashflow live
- Estimated rent
- $8,000 medium interval (Pro) →
- Mortgage (P&I)
- −$3,660
- Tax from tax record
- −$426 /mo · $5,114/yr
- Insurance
- −$291
- HOA
- −$0
- Vacancy / Maint / Mgmt
- −$1,680
- Net cashflow
- $1,943
Break-even live
UW: 25.0% down · 7.5% · 30yr · 1.5% tax · 5.0% vac · 8.0% maint · 8.0% mgmt
Financing live
Cash to close
- Down payment
- $174,500
- Closing costs
- $20,940
- Reserves months
- —
- Total cash needed
- —
Loan-product check · same deal, 3 products live
Conventional
25% down · 7.5% · 30yr
- Down + closing
- —
- Monthly P&I
- —
- Monthly cashflow
- —
- DSCR
- —
- Eligible?
- —
Personal DTI + credit; lowest rate.
DSCR
20% down · 8.5% · 30yr
- Down + closing
- —
- Monthly P&I
- —
- Monthly cashflow
- —
- DSCR
- —
- Eligible?
- —
No personal income docs; deal must DSCR.
Hard money
10% down · 12.0% · 12mo
- Down + closing
- —
- Monthly P&I
- —
- Monthly cashflow
- —
- DSCR
- —
- Eligible?
- —
Short-term bridge; refi at stabilization.
Rent comps 1 comps
| Address | Beds | Baths | Sqft | Rent | $/sqft | DOM | Units | Dist |
|---|---|---|---|---|---|---|---|---|
| 1726 Cold Creek Cir Mount Shasta, CA | 3.0 | 3.0 | 2403 | $8,000 | $3.33 | 21d | 1 | 0.30mi |
Listing history 21 events
-
2026-06-19days on market $698,000 Active 49 DOM
-
2026-06-18days on market $698,000 Active 48 DOM
-
2026-06-17days on market $698,000 Active 47 DOM
-
2026-06-16days on market $698,000 Active 46 DOM
-
2026-06-15days on market $698,000 Active 45 DOM
-
2026-06-14days on market $698,000 Active 43 DOM
-
2026-06-12days on market $698,000 Active 42 DOM
-
2026-06-09days on market $698,000 Active 39 DOM
-
2026-06-08days on market $698,000 Active 38 DOM
-
2026-06-07days on market $698,000 Active 37 DOM
-
2026-06-07days on market $698,000 Active 36 DOM
-
2026-06-04days on market $698,000 Active 33 DOM
-
2026-06-02days on market $698,000 Active 32 DOM
-
2026-06-01days on market $698,000 Active 31 DOM
-
2026-05-31days on market $698,000 Active 30 DOM
-
2026-05-31days on market $698,000 Active 29 DOM
-
2026-05-01$709,000 Active
-
2025-08-12price $769,000
-
2018-06-21soldstatus $425,000
-
2018-06-21soldstatus $425,000
-
2018-02-26$429,000
ⓘ Source: listings_history table (triggers on properties + properties_extension) + one-shot
backfill from property_details.listing_events for pre-trigger history.
Tax reassessment forecast CA · Resets to sale price
- Current annual tax
- $5,114 · $426/mo
- Projected year-2 tax
- $5,305 · $442/mo
- Expected delta
- +$190/yr (+$16/mo · 3.7%)
ⓘ Screening estimate from a state-policy table — verify with the county assessor before closing.
Climate risk First Street
- Flood 1/10 Low FEMA zone X (unshaded) · 0% chance over 30 yrs
- Wildfire 5/10 Major
- Heat 3/10 Moderate 7 d/yr ≥92°F today · 17 d/yr by 30 yrs out
- Wind 1/10 Low
- Air quality 10/10 Extreme 34 unhealthy d/yr today · 34 by 30 yrs out
Nearby sold comps map
Loading sold comps map…
Walkable amenities ~0.75 mi
Loading nearby amenities…
Taxation est. · year 1
- Rental income
- $96,000
- − Mortgage interest
- −$39,099
- − Property taxes
- −$5,114
- − Insurance
- −$3,490
- − Repairs & maintenance
- −$7,680
- − Management
- −$7,680
- − Depreciation
- −$20,305
- Taxable income
- $12,631
- Est. tax owed @ 24.0%
- −$3,031
- After-tax cash flow
- $20,279/yr
For passive investors: Depreciation is non-cash, so a rental often shows a tax loss while cash-flowing — sheltering income. Rental losses are passive: they offset passive income freely, and up to $25,000/yr can offset ordinary (W-2) income if you actively participate and your MAGI is under $100k (phasing out to $0 by $150k); unused losses carry forward. On sale, claimed depreciation is recaptured at up to 25%, and gains may owe capital-gains tax (a 1031 exchange can defer both). Figures are a year-1 estimate at your 24.0% rate — not tax advice; consult a CPA.
Schools (NCES district)
- District
- Siskiyou Union High
- NCES district ID
- 0636940
- Math proficiency
- 25% ▲ 5.00%
- Reading proficiency
- 55% ▲ 5.00%
- Median HH income
- $39,293
- Composite
- 35.84/100
- National rank
- #9605
- State rank
- #763 of 1400 in CA
Livability — Mount Shasta
- Score
- 64/100
- State rank
- #405
- US rank
- #13833
Category grades
Schools grade is shown separately in the Schools card above.
Census & demographics
- City population
- 7,800
- Population (ZIP)
- 6,674
Population outlook (Siskiyou County) Hauer SSP2
- Today (2025)
- 39,337 people
- By 2030
- 36,930 · -6.1%
- By 2040
- 32,367 · -17.7%
- By 2050
- 29,030 · -26.2%
- By 2075
- 23,534 · -40.2%
- By 2100
- 19,312 · -50.9%
Race, ethnicity, and origin ACS 2023
- Neighborhood character
- Predominantly White (69%)
- Race & ethnicity
- White 69% Hispanic / Latino 16% Two or more races 8% Black 4% Asian 4% Native American 2%
- Hispanic origin (detail)
- Mexican 13%
- Common ancestry
- Russian 4% Lithuanian 3% Italian 3%
- Foreign-born
- 6% · Canada, China
- Languages at home
- 88% English-only · Spanish 9% Other Asian/Pacific 1% German/W. Germanic 1%
Political lean MEDSL · Siskiyou
- 2024 margin
- R (+19.2) · D 38.8% · R 58.0% · Other 3.2%
- 2008→2024 swing
- -8.8pp toward R · 2008: -10.4pp · 2024: -19.2pp
- All cycles
- 2024: R+19.2 2020: R+15.8 2016: R+20.7 2012: R+15.6 2008: R+10.4
Not yet ingested
- Civics
- —
Market trends
- HPI YoY
- ▼ -170.11%
- Current HPI
- 152.605
- Rent YoY
- —
- Metro
- —
- State GDP YoY
- ▲ 3.21%
- F500 in state
- 116
Industry mix (Fortune 500 HQ in CA)
| Industry | F500 HQs | Revenue |
|---|---|---|
| Technology | 27 | $1,492B |
|
||
| Financial Services | 3 | $174B |
|
||
| Retail | 3 | $44B |
|
||
| Insurance | 3 | $26B |
|
||
| Media / Entertainment | 2 | $115B |
|
||
| Pharmaceuticals / Biotech | 2 | $62B |
|
||
Price history
+65.3% since first listed5 events — show timeline
- 2026-05-01 Listed $709,000 SMLS
- 2025-08-12 Price Changed $769,000 SMLS
- 2018-06-21 Sold (Public Records) $425,000 Public Records
- 2018-06-21 Sold (MLS) $425,000 SMLS
- 2018-02-26 Listed $429,000 SMLS
Property tax history
+3.3%/yrLatest (2025): $5,114 · +1.7% YoY. Source: county tax records.
Cash-flow waterfall
monthlySold comps — $/sqft
last 12 mo · ≤1 miLoading sold comps…