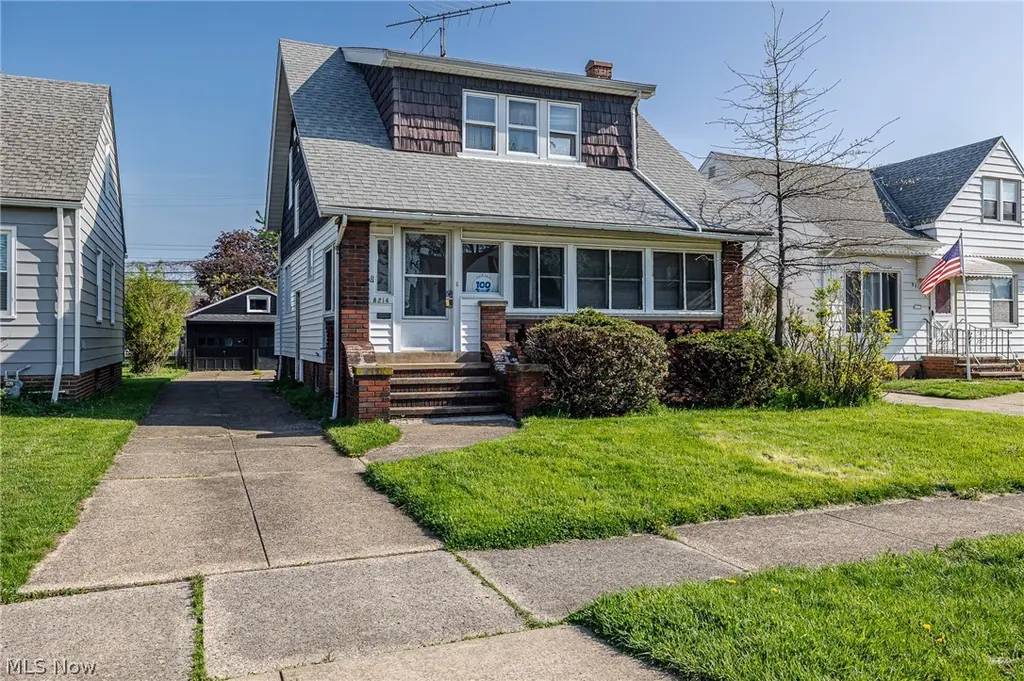
8214 Essen Ave · Parma, OH
Flood risk 1/10 · Minimal
- FEMA flood zone
- X (unshaded)
- Chance of flooding over 30 yrs
- 0.0%
- Est. flood insurance / yr
- $473 – $860
Fire risk 1/10 · Minimal
- Est. fire insurance / yr
- $713 – $1,323
Heat risk 3/10 · Minor
- Hot days now (above 95°F)
- 7 days/yr
- Hot days in 30 yrs
- 17 days/yr
Wind risk 1/10 · Minimal
- Chance of severe wind over 30 yrs
- —
Air-quality risk 3/10 · Minor
- Unhealthy air days now
- 2 days/yr
- Unhealthy air days in 30 yrs
- 4 days/yr
Risk factors via First Street. Map © Google.
Why this score? — see what drove the B grade
The composite is a weighted blend of 9 inputs, each scored 0–100. Each bar is that input's sub-score; the figure is the points it added to the 100-point composite (weight × sub-score).
- Cash flow +25.1/30.0
- ARV discount +15.0/15.0
- DSCR +8.2/10.0
- 1% rule +7.9/10.0
- Schools +4.1/10.0
- Livability +4.1/5.0
- Rent growth +3.6/5.0
- Condition / age +2.5/5.0
- Appreciation +0.0/10.0
$125,000
🖨 Deal sheet 📄 Offer letter ✓ Due diligence
Listing remarks
The best deal in Parma! Investors. .. COME AND GET IT! Love and imagination is all you need to restore this classic Western Bungalow! It's solid, but been through a lot. Well distributed space throughout, with 3 bedrooms, 2 bathrooms, and a 2 car garage. It's ready for you to roll up your sleeves and help realize its potential.
Key facts
- 5,227 sq ft lot
- 2 garage spots
- Built 1925
Property features AI
Exterior
- Parking: Detached garage (2-car)
- Utilities: Public water; Public sewer
- Home design: 2-story single family home; Home faces south; Property listed as fixer
- Construction: Shake and vinyl siding; Asphalt fiberglass roof; Block foundation; Built per public records
- Exterior features: Covered, enclosed front porch; Patio/porch
Interior
- Kitchen: Kitchen on first level
- Bedrooms: Bedrooms located on second level (2 bedrooms)
- Flooring: Carpeted living areas and bedrooms
- Bathrooms: 2 full bathrooms
- Heating & cooling: Forced air heating (gas)
- Interior features: Full basement
Neighborhood map
What this means for you Summary
Snapshot
- This is a 3-bed/1.0-bath single-family listed at $125k.
Deal economics
- At list price, monthly cash flow is $275 ($3k/yr) — positive.
- The deal already cash-flows at list — no discount required.
- Meets the 1% rule at list price ($2k rent vs $125k).
- Cap rate 8.9% vs local median 5.0% in Parma — top-decile yield for the area; either an underpriced asset or a hidden risk that comps aren't pricing in. Stress-test before assuming the spread holds.
Location & tenants
- Location reads 82/100 on livability (#84 in OH, #1,232 nationally) — a professional / high-income tenant draw. Strengths: crime A+, amenities A+, cost of living A+; Watch: employment C-, commute F.
- Parma City (suburban): math 43% / reading 52% proficiency, ranked #469 of 656 in OH (top 72%) — families likely to look elsewhere, expect single-tenant / working-renter base with shorter leases.
- Market conditions: Rents rising fast (+4.3%/yr); 85 active listings in the ZIP; 22 comparable units currently listed for rent nearby; rentals leasing fast (median 8d on market — plan ~1-2 weeks tenant-placement turnaround); 1,441 units permitted in Cuyahoga County in 2024 (700 in 5+ unit buildings).
Forward outlook
- Local home prices are declining (-3.0%/yr); year-one equity from $864 of loan paydown is wiped out by about $4k of value loss. Plan a longer hold.
- Cuyahoga County population projected to shrink 8% by 2050 — rents likely to lag national; underwrite the cash flow, not the appreciation.
- At projected returns (-3.0% appreciation + 4.3% rent growth), your $35k cash investment doubles in ~10 years — after that, you're playing with house money.
Negotiation context
- Only 4 days on market — expect competitive offers; lowballing is unlikely to land.
Risks & watch-outs
- Watch-outs: property tax is 2.8% of price; built in 1925 — expect roof / HVAC / electrical / plumbing capex.
Questions for the listing agent
- Built in 1925 — when were the roof, HVAC, electrical panel, plumbing, and water heater last replaced?
- Property tax is high relative to price — has the assessment been appealed recently, and will the sale trigger a re-assessment?
- Is there a deadline driving the sale (1031 exchange, divorce, estate, relocation)? That informs how much negotiation room exists.
- Schools are B-rated — typically a magnet for longer-tenancy family renters. What's the average tenant stay here, and is there a school-zone premium baked into asking?
- What's the average days-on-market for RENTAL listings here right now (not sales)? A rising rental-DOM trend means longer vacancies and softer asking-rent achievability than the comps imply.
- What's the recent tenant-quality profile in this submarket — average credit score on applications, eviction rate, late-payment / NSF rate, and stable-employment percentage? A property-management company in the area should have these aggregated.
- How much new for-sale + rental construction is in the pipeline within 1–3 miles? Heavy new supply typically softens prices + rents 12–24 months out; constrained supply supports both.
Investment metrics
- 1% rule
- 1.29% ✓
- Cap rate
- 8.93%
- Cash-on-cash
- 9.41%
- DSCR
- 1.42
- GRM
- 6.5
CMA / ARV
- ARV (on-the-fly)
- $235,433
- Comps found
- 12
Show comp detail 12 sales within ~0.75 mi
| Address | Dist | Beds/Ba | Sqft | Sold | Price | $/sf | Match |
|---|---|---|---|---|---|---|---|
| 8214 Essen Ave | 0.00mi | 3/2.0 | 1,259 (0%) | 0mo | $115,000 | $91 | 96 |
| 5926 Deering Ave | 0.31mi | 3/1.0 | 1,278 (+2%) | 0mo | $217,500 | $170 | 83 |
| 9158 Snow Rd | 0.34mi | 3/1.0 | 1,236 (-2%) | 1mo | $220,000 | $178 | 81 |
| 7907 Renwood Dr | 0.47mi | 3/1.0 | 1,278 (+2%) | 0mo | $217,500 | $170 | 75 |
| 7515 Ridgefield Ave | 0.35mi | 3/2.5 | 1,312 (+4%) | 1mo | $245,000 | $187 | 70 |
| 9504 Eureka Pkwy | 0.52mi | 3/1.0 | 1,211 (-4%) | 0mo | $158,000 | $130 | 69 |
| 7511 Wooster Pkwy | 0.40mi | 4/2.0 (+1) | 1,212 (-4%) | 1mo | $265,000 | $219 | 66 |
| 7503 Whittington Dr | 0.49mi | 3/2.0 | 1,344 (+7%) | 0mo | $265,000 | $197 | 61 |
| 9417 Fernhill Ave | 0.70mi | 3/1.0 | 1,335 (+6%) | 0mo | $223,000 | $167 | 57 |
| 6307 Kenneth Ave | 0.71mi | 4/1.0 (+1) | 1,219 (-3%) | 0mo | $243,000 | $199 | 56 |
| 7600 Dartworth | 0.36mi | 4/2.0 (+1) | 1,105 (-12%) | 1mo | $230,000 | $208 | 53 |
| 8016 Pelham Dr | 0.59mi | 3/1.0 | 1,111 (-12%) | 0mo | $235,000 | $212 | 53 |
Match score weights: distance 35% · size 25% · config 20% · recency 20%. Top-matched comps best support the ARV.
Projected returns pro-forma
-3.0% appreciation · 4.29% rent growth · sell at horizon
- IRR
- -0.4%
- Equity multiple
- 0.98×
- Total profit
- $-547
- Equity at exit
- $18,638
- IRR
- 10.8%
- Equity multiple
- 1.90×
- Total profit
- $31,374
- Equity at exit
- $10,808
Cash invested: $35,000 (down + closing). Projections, not guarantees.
Landlord ↔ Tenant lean methodology
- Overall (STATE)
- 73 Landlord-Friendly
- State Ohio
- 73 Landlord-Friendly · R+6
- County
- — inherits STATE
- City
- — inherits STATE
ZIP-level market 44129
- Rents YoY
- 4.3%
- Active inventory
- 85
- Price-to-rent
- 6.5×
Monthly cashflow live
- Estimated rent
- $1,608 high interval (Pro) →
- Mortgage (P&I)
- −$656
- Tax from tax record
- −$288 /mo · $3,455/yr
- Insurance
- −$52
- HOA
- −$0
- Vacancy / Maint / Mgmt
- −$338
- Net cashflow
- $275
Break-even live
UW: 25.0% down · 7.5% · 30yr · 1.5% tax · 5.0% vac · 8.0% maint · 8.0% mgmt
Financing live
Cash to close
- Down payment
- $31,250
- Closing costs
- $3,750
- Reserves months
- —
- Total cash needed
- —
Loan-product check · same deal, 3 products live
Conventional
25% down · 7.5% · 30yr
- Down + closing
- —
- Monthly P&I
- —
- Monthly cashflow
- —
- DSCR
- —
- Eligible?
- —
Personal DTI + credit; lowest rate.
DSCR
20% down · 8.5% · 30yr
- Down + closing
- —
- Monthly P&I
- —
- Monthly cashflow
- —
- DSCR
- —
- Eligible?
- —
No personal income docs; deal must DSCR.
Hard money
10% down · 12.0% · 12mo
- Down + closing
- —
- Monthly P&I
- —
- Monthly cashflow
- —
- DSCR
- —
- Eligible?
- —
Short-term bridge; refi at stabilization.
Rent comps 22 comps
| Address | Beds | Baths | Sqft | Rent | $/sqft | DOM | Units | Dist |
|---|---|---|---|---|---|---|---|---|
| 8326 Fernhill Ave Cleveland, OH | 3.0 | 1.0 | 1350 | $1,700 | $1.26 | 43d | 1 | 0.54mi |
| 7906 Lanyard Dr Unit 1496071P Parma, OH | 4.0 | 1.5 | 1227 | $5,834 | $4.75 | 7d | 1 | 0.54mi |
| 9703 Snow Rd Cleveland, OH | 3.0 | 1.0 | 1103 | $1,675 | $1.52 | 2d | 1 | 0.57mi |
| 6099 Ridge Rd Cleveland, OH | 2.0 | 1.0 | 1020 | $1,200 | $1.18 | 21d | 1 | 0.62mi |
| 6505 Snow Rd Unit REAR Parma, OH | 3.0 | 1.5 | 1312 | $1,599 | $1.22 | 7d | 1 | 0.66mi |
| 6236 Westminster Dr Cleveland, OH | 3.0 | 1.0 | 1131 | $1,700 | $1.50 | 14d | 1 | 0.70mi |
| 7903 Ackley Rd Unit 7903 Parma, OH | 3.0 | 1.0 | 1100 | $1,600 | $1.45 | 43d | 1 | 0.84mi |
| 9474 Roxbury Rd Cleveland, OH | 3.0 | 2.0 | 1050 | $1,850 | $1.76 | 3d | 1 | 0.87mi |
| 9474 Roxbury Rd Cleveland, OH | 3.0 | 2.0 | 1050 | $2,000 | $1.90 | 23d | 1 | 0.87mi |
| 6511 Luelda Ave Unit Na Parma, OH | 3.0 | 2.0 | 1577 | $1,975 | $1.25 | 43d | 1 | 1.04mi |
| 6403 Ridge Rd Cleveland, OH | 2.0 | 2.0 | 1110 | $1,450 | $1.31 | 16d | 1 | 1.06mi |
| 5606 Theota Ave Cleveland, OH | 3.0 | 1.5 | 1676 | $1,400 | $0.84 | 7d | 1 | 1.12mi |
| 5606 Theota Ave Cleveland, OH | 3.0 | 1.5 | 1676 | $1,400 | $0.84 | 4d | 1 | 1.12mi |
| 8310 Salisbury Dr Cleveland, OH | 3.0 | 2.0 | 1088 | $1,950 | $1.79 | 7d | 1 | 1.20mi |
| 6007 Merkle Ave Unit Down Parma, OH | 3.0 | 1.0 | 1250 | $1,399 | $1.12 | 1d | 1 | 1.22mi |
| 6260 Pearl Rd Cleveland, OH | 1.0–2.0 | 1.0–2.0 | 950 | $1,465 | $1.54 | 1d | 17 | 1.37mi |
| 5406 Merkle Ave Cleveland, OH | 2.0 | 1.0 | 946 | $1,300 | $1.37 | 4d | 1 | 1.38mi |
| 5406 Merkle Ave Cleveland, OH | 2.0 | 1.0 | 958 | $1,300 | $1.36 | 7d | 1 | 1.38mi |
| 11540 Apache Dr Parma Heights, OH | 2.0–3.0 | 1.0–2.0 | 1232 | $2,040 | $1.66 | 1d | 23 | 1.38mi |
| 4606 Lincoln Ave Cleveland, OH | 3.0 | 2.0 | 1418 | $1,995 | $1.41 | 1d | 1 | 1.45mi |
| 5930 Stumph Rd Cleveland, OH | 1.0–2.0 | 1.0–2.0 | 905 | $1,470 | $1.62 | 1d | 9 | 1.48mi |
| 6040 Stumph Rd Cleveland, OH | 2.0–3.0 | 1.0–1.5 | 981 | $1,140 | $1.16 | 43d | 1 | 1.49mi |
Listing history 2 events
-
2026-04-28status Pending
-
2026-04-24$125,000 Active
ⓘ Source: listings_history table (triggers on properties + properties_extension) + one-shot
backfill from property_details.listing_events for pre-trigger history.
Tax reassessment forecast OH · Partial reset (capped growth)
- Current annual tax
- $3,455 · $288/mo
- Projected year-2 tax
- $3,455 · $288/mo
- Expected delta
- $0/yr ($0/mo · 0.0%)
ⓘ Screening estimate from a state-policy table — verify with the county assessor before closing.
Climate risk First Street
- Flood 1/10 Low FEMA zone X (unshaded) · 0% chance over 30 yrs
- Wildfire 1/10 Low
- Heat 3/10 Moderate 7 d/yr ≥95°F today · 17 d/yr by 30 yrs out
- Wind 1/10 Low
- Air quality 3/10 Moderate 2 unhealthy d/yr today · 4 by 30 yrs out
Nearby sold comps map
Loading sold comps map…
Walkable amenities ~0.75 mi
Loading nearby amenities…
Taxation est. · year 1
- Rental income
- $19,292
- − Mortgage interest
- −$7,002
- − Property taxes
- −$3,455
- − Insurance
- −$625
- − Repairs & maintenance
- −$1,543
- − Management
- −$1,543
- − Depreciation
- −$3,636
- Taxable income
- $1,488
- Est. tax owed @ 24.0%
- −$357
- After-tax cash flow
- $2,938/yr
For passive investors: Depreciation is non-cash, so a rental often shows a tax loss while cash-flowing — sheltering income. Rental losses are passive: they offset passive income freely, and up to $25,000/yr can offset ordinary (W-2) income if you actively participate and your MAGI is under $100k (phasing out to $0 by $150k); unused losses carry forward. On sale, claimed depreciation is recaptured at up to 25%, and gains may owe capital-gains tax (a 1031 exchange can defer both). Figures are a year-1 estimate at your 24.0% rate — not tax advice; consult a CPA.
Schools (NCES district)
- District
- Parma City
- NCES district ID
- 3904463
- Math proficiency
- 43% ▼ -18.00%
- Reading proficiency
- 52% ▼ -10.00%
- Median HH income
- $50,371
- Composite
- 40.72/100
- National rank
- #3662
- State rank
- #469 of 656 in OH
Livability — Parma
- Score
- 82/100
- State rank
- #84
- US rank
- #1232
Category grades
Schools grade is shown separately in the Schools card above.
Census & demographics
- Census place
- Parma, OH
- County
- Cuyahoga County · 1,090,369 people
- City population
- 66,574
- Metro
- Cleveland-Elyria, OH
- Population (ZIP)
- 28,800
- Household income
- $70,651
- Rent vs Own
- Severe rent burden
- 541.0
Population outlook (Cuyahoga County) Hauer SSP2
- Today (2025)
- 1,244,621 people
- By 2030
- 1,230,093 · -1.2%
- By 2040
- 1,189,108 · -4.5%
- By 2050
- 1,145,706 · -7.9%
- By 2075
- 1,076,557 · -13.5%
- By 2100
- 978,987 · -21.3%
Race, ethnicity, and origin ACS 2023
- Neighborhood character
- Predominantly White (76%)
- Race & ethnicity
- White 76% Hispanic / Latino 13% Two or more races 8% Black 7% Asian 2%
- Hispanic origin (detail)
- Puerto Rican 9%
- Common ancestry
- Romanian 12% Subsaharan African 3% Scandinavian 1%
- Foreign-born
- 11% · Canada, India, Vietnam
- Languages at home
- 82% English-only · Spanish 7% Russian/Polish/Slavic 4% Other Indo-European 3%
Political lean MEDSL · Cuyahoga
- 2024 margin
- Solid D (+31.5) · D 65.4% · R 33.9%
- 2008→2024 swing
- -7.4pp toward R · 2008: 38.9pp · 2024: 31.5pp
- All cycles
- 2024: D+31.5 2020: D+34.1 2016: D+35.0 2012: D+38.7 2008: D+38.9
Not yet ingested
- Civics
- —
Market trends
- HPI YoY
- ▼ -143.31%
- Current HPI
- 184.2628
- Rent YoY
- ▲ 4.29%
- Metro
- Cleveland-Elyria, OH
- State GDP YoY
- ▲ 1.98%
- F500 in state
- 48
Industry mix (Fortune 500 HQ in OH)
| Industry | F500 HQs | Revenue |
|---|---|---|
| Insurance | 3 | $145B |
|
||
| Industrial Machinery | 3 | $49B |
|
||
| Financial Services | 3 | $24B |
|
||
| Consumer Goods | 2 | $93B |
|
||
| Aerospace / Defense | 2 | $47B |
|
||
| Utilities | 2 | $33B |
|
||
Price history
2 events — show timeline
- 2026-04-28 Pending — MLSNOW
- 2026-04-24 Listed $125,000 MLSNOW
Property tax history
+3.7%/yrLatest (2025): $3,455 · -2.1% YoY. Source: county tax records.
Cash-flow waterfall
monthlySold comps — $/sqft
last 12 mo · ≤1 miLoading sold comps…