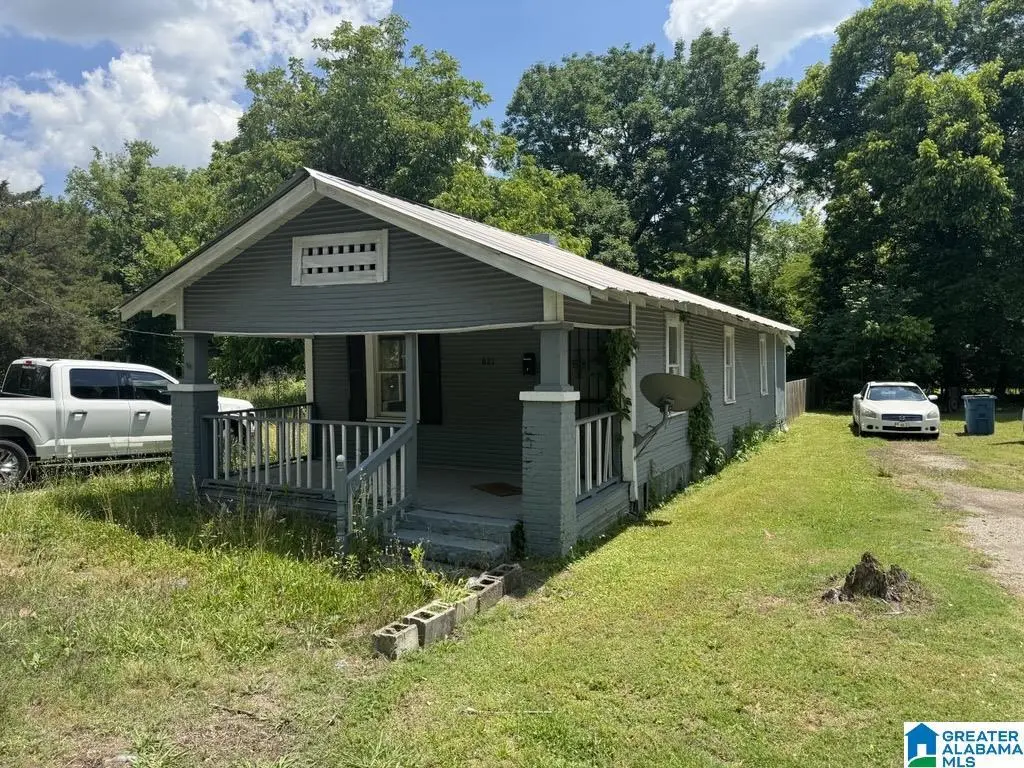
621 Pine Hill Rd · Tarrant, AL
Flood risk 1/10 · Minimal
- FEMA flood zone
- X (unshaded)
- Chance of flooding over 30 yrs
- 0.0%
- Est. flood insurance / yr
- $507 – $1,088
Fire risk 4/10 · Minor
- Est. fire insurance / yr
- $916 – $1,700
Heat risk 6/10 · Moderate
- Hot days now (above 106°F)
- 7 days/yr
- Hot days in 30 yrs
- 19 days/yr
Wind risk 6/10 · Moderate
- Chance of severe wind over 30 yrs
- 27.0%
Air-quality risk 5/10 · Moderate
- Unhealthy air days now
- 9 days/yr
- Unhealthy air days in 30 yrs
- 10 days/yr
Risk factors via First Street. Map © Google.
Why this score? — see what drove the B- grade
The composite is a weighted blend of 9 inputs, each scored 0–100. Each bar is that input's sub-score; the figure is the points it added to the 100-point composite (weight × sub-score).
- Cash flow +30.0/30.0
- 1% rule +10.0/10.0
- DSCR +10.0/10.0
- ARV discount +7.5/15.0
- Rent growth +3.4/5.0
- Livability +2.6/5.0
- Condition / age +2.5/5.0
- Schools +0.8/10.0
- Appreciation +0.0/10.0
$45,000
🖨 Deal sheet 📄 Offer letter ✓ Due diligence
Listing remarks MLS
Great Home minutes from Birmingham. This 2 bed 1 bath home has a lot of potential with a brand new HVAC uint, new wooden fence and fresh paint!
Key facts
- Covered front porch
- Good natural light
- Built 1930
Tags
Property features AI
Finance
- Other: Lot size approximately 0.019 acres; Located in the Springdale subdivision
Exterior
- Parking: Driveway parking
- Security: No security features listed
- Utilities: Public water; Septic sewer; Electric water heater; Internet service available
- Home design: Existing construction; Wood siding
- Construction: Pillar/support foundation; Siding (wood) exterior
- Exterior features: Front porch; No pool, patio, decks, or garden listed; Not waterfront
Interior
- Kitchen: Laminate countertops
- Bedrooms: 2 bedrooms on the main level
- Flooring: Vinyl flooring
- Bathrooms: 1 full bathroom with tub/shower combo
- Heating & cooling: No heat; No air conditioning
- Interior features: Smooth ceilings; No additional interior features listed
- Laundry & utility: Main-level laundry room; Washer hookup; Electric dryer hookup
Neighborhood map
What this means for you Summary
Snapshot
- This is a 1-bed/1.0-bath single-family listed at $45k.
Deal economics
- At list price, monthly cash flow is $472 ($6k/yr) — positive.
- The deal already cash-flows at list — no discount required.
- Meets the 1% rule at list price ($955 rent vs $45k).
- Recommended offer: $44k (1.5% below list) — sets the bar for market timing.
- Cap rate 18.9% vs local median 11.0% in Tarrant — top-decile yield for the area; either an underpriced asset or a hidden risk that comps aren't pricing in. Stress-test before assuming the spread holds.
Location & tenants
- Location reads 51/100 on livability (#507 in AL) — a working-class tenant base; expect higher turnover. Strengths: cost of living A+, housing A+; Watch: crime C-, amenities F, commute F.
- Tarrant City (suburban): math 4% / reading 17% proficiency, ranked #121 of 129 in AL (top 94%) — low school quality limits family demand, transient renter base, plan for 1-2y turnover; 89% free/reduced lunch — lower-income household profile, screen leases tightly.
- Zoned schools: Tarrant Elementary School (310 students, 85% FRL); Tarrant High School (math 3% / reading 16%, grade F, #258 of 305 statewide, top 85%, 559 students, 84% FRL) — zoned schools at 85% FRL track the district average.
- Market conditions: Rents rising (+3.6%/yr); 94 active listings in the ZIP; lower-income renter base — watch delinquency; 2,114 units permitted in Jefferson County in 2024 (556 in 5+ unit buildings).
Forward outlook
- Local home prices are declining (-3.0%/yr); year-one equity from $311 of loan paydown is wiped out by about $1k of value loss. Plan a longer hold.
- Jefferson County population projected to shrink 4% by 2050 — rents likely to lag national; underwrite the cash flow, not the appreciation.
- At projected returns (-3.0% appreciation + 3.6% rent growth), your $13k cash investment doubles in ~3 years — after that, you're playing with house money.
Negotiation context
- It's been on market 20 days — a 2% lower offer ($44k) is reasonable based on typical stale-listing flexibility.
- 3 sale attempts since 5y ago with the ask held roughly flat each time — persistent listings suggest the price (not the market) is what's stuck; bring a comps-based counter.
Risks & watch-outs
- Watch-outs: built in 1930 — expect roof / HVAC / electrical / plumbing capex.
- Climate carrying-cost: major wind risk, 27% chance of damaging wind over 30y; extreme-heat days projected 7→19/yr by 2055 (HVAC capex compounding) — expect insurance premiums to compound above CPI over the hold.
Questions for the listing agent
- Built in 1930 — when were the roof, HVAC, electrical panel, plumbing, and water heater last replaced?
- Is there a deadline driving the sale (1031 exchange, divorce, estate, relocation)? That informs how much negotiation room exists.
- Schools are F-rated, which usually means shorter tenancies and higher turnover. Who's the typical renter profile here, and what's been the actual vacancy rate?
- What's the average days-on-market for RENTAL listings here right now (not sales)? A rising rental-DOM trend means longer vacancies and softer asking-rent achievability than the comps imply.
- What's the recent tenant-quality profile in this submarket — average credit score on applications, eviction rate, late-payment / NSF rate, and stable-employment percentage? A property-management company in the area should have these aggregated.
- How much new for-sale + rental construction is in the pipeline within 1–3 miles? Heavy new supply typically softens prices + rents 12–24 months out; constrained supply supports both.
Investment metrics
- 1% rule
- 2.12% ✓
- Cap rate
- 18.87%
- Cash-on-cash
- 44.92%
- DSCR
- 3.00
- GRM
- 3.9
CMA / ARV
No comps found within radius.
Projected returns pro-forma
-3.0% appreciation · 3.58% rent growth · sell at horizon
- IRR
- 42.6%
- Equity multiple
- 2.85×
- Total profit
- $23,305
- Equity at exit
- $6,710
- IRR
- 49.0%
- Equity multiple
- 5.86×
- Total profit
- $61,290
- Equity at exit
- $3,891
Cash invested: $12,600 (down + closing). Projections, not guarantees.
Landlord ↔ Tenant lean methodology
- Overall (STATE)
- 90 Strongly Landlord-Friendly
- State Alabama
- 90 Strongly Landlord-Friendly · R+15
- County
- — inherits STATE
- City
- — inherits STATE
ZIP-level market 35217
- Rents YoY
- 3.6%
- Active inventory
- 94
- Price-to-rent
- 3.9×
Monthly cashflow live
- Estimated rent
- $955 medium interval (Pro) →
- Mortgage (P&I)
- −$236
- Tax from tax record
- −$28 /mo · $337/yr
- Insurance
- −$19
- HOA
- −$0
- Vacancy / Maint / Mgmt
- −$201
- Net cashflow
- $472
Break-even live
UW: 25.0% down · 7.5% · 30yr · 1.5% tax · 5.0% vac · 8.0% maint · 8.0% mgmt
Financing live
Cash to close
- Down payment
- $11,250
- Closing costs
- $1,350
- Reserves months
- —
- Total cash needed
- —
Loan-product check · same deal, 3 products live
Conventional
25% down · 7.5% · 30yr
- Down + closing
- —
- Monthly P&I
- —
- Monthly cashflow
- —
- DSCR
- —
- Eligible?
- —
Personal DTI + credit; lowest rate.
DSCR
20% down · 8.5% · 30yr
- Down + closing
- —
- Monthly P&I
- —
- Monthly cashflow
- —
- DSCR
- —
- Eligible?
- —
No personal income docs; deal must DSCR.
Hard money
10% down · 12.0% · 12mo
- Down + closing
- —
- Monthly P&I
- —
- Monthly cashflow
- —
- DSCR
- —
- Eligible?
- —
Short-term bridge; refi at stabilization.
Listing history 14 events
-
2026-06-18days on market $45,000 Active 20 DOM
-
2026-06-17days on market $45,000 Active 19 DOM
-
2026-06-16days on market $45,000 Active 18 DOM
-
2026-06-15days on market $45,000 Active 17 DOM
-
2026-06-13days on market $45,000 Active 15 DOM
-
2026-06-10days on market $45,000 Active 12 DOM
-
2026-06-09days on market $45,000 Active 11 DOM
-
2026-06-08days on market $45,000 Active 10 DOM
-
2026-06-07days on market $45,000 Active 9 DOM
-
2026-06-05days on market $45,000 Active 6 DOM
-
2026-06-03days on market $45,000 Active 5 DOM
-
2026-06-02days on market $45,000 Active 4 DOM
-
2026-06-01days on market $45,000 Active 3 DOM
-
2026-05-31days on market $45,000 Active 2 DOM
ⓘ Source: listings_history table (triggers on properties + properties_extension) + one-shot
backfill from property_details.listing_events for pre-trigger history.
Tax reassessment forecast AL · Resets to sale price
- Current annual tax
- $337 · $28/mo
- Projected year-2 tax
- $337 · $28/mo
- Expected delta
- $0/yr ($0/mo · 0.0%)
ⓘ Screening estimate from a state-policy table — verify with the county assessor before closing.
Climate risk First Street
- Flood 1/10 Low FEMA zone X (unshaded) · 0% chance over 30 yrs
- Wildfire 4/10 Moderate
- Heat 6/10 Major 7 d/yr ≥106°F today · 19 d/yr by 30 yrs out
- Wind 6/10 Major 27% chance of damaging wind over 30 yrs
- Air quality 5/10 Major 9 unhealthy d/yr today · 10 by 30 yrs out
Nearby sold comps map
Loading sold comps map…
Walkable amenities ~0.75 mi
Loading nearby amenities…
Taxation est. · year 1
- Rental income
- $11,461
- − Mortgage interest
- −$2,521
- − Property taxes
- −$337
- − Insurance
- −$225
- − Repairs & maintenance
- −$917
- − Management
- −$917
- − Depreciation
- −$1,309
- Taxable income
- $5,235
- Est. tax owed @ 24.0%
- −$1,256
- After-tax cash flow
- $4,403/yr
For passive investors: Depreciation is non-cash, so a rental often shows a tax loss while cash-flowing — sheltering income. Rental losses are passive: they offset passive income freely, and up to $25,000/yr can offset ordinary (W-2) income if you actively participate and your MAGI is under $100k (phasing out to $0 by $150k); unused losses carry forward. On sale, claimed depreciation is recaptured at up to 25%, and gains may owe capital-gains tax (a 1031 exchange can defer both). Figures are a year-1 estimate at your 24.0% rate — not tax advice; consult a CPA.
Schools (NCES district)
- District
- Tarrant City
- NCES district ID
- 0103270
- Math proficiency
- 4% ▼ -14.00%
- Reading proficiency
- 17% ▼ -2.00%
- Median HH income
- $29,256
- Composite
- 8.0/100
- National rank
- #9924
- State rank
- #121 of 129 in AL
Livability — Tarrant
- Score
- 51/100
- State rank
- #507
- US rank
- #25136
Category grades
Schools grade is shown separately in the Schools card above.
Census & demographics
- Census place
- Tarrant, AL
- County
- Jefferson County · 527,445 people
- City population
- 12,240
- Metro
- Birmingham-Hoover, AL
- Population (ZIP)
- 12,240
- Household income
- $40,486
- Rent vs Own
- Severe rent burden
- 594.0
Population outlook (Jefferson County) Hauer SSP2
- Today (2025)
- 669,185 people
- By 2030
- 669,694 · +0.1%
- By 2040
- 661,388 · -1.2%
- By 2050
- 643,086 · -3.9%
- By 2075
- 577,267 · -13.7%
- By 2100
- 474,758 · -29.1%
Race, ethnicity, and origin ACS 2023
- Neighborhood character
- Diverse neighborhood (Simpson 0.58)
- Race & ethnicity
- Black 57% White 27% Hispanic / Latino 14% Two or more races 6%
- Hispanic origin (detail)
- Mexican 9%
- Common ancestry
- Slovak 3% Italian 1%
- Foreign-born
- 7% · Canada, Guatemala
- Languages at home
- 86% English-only · Spanish 13%
Political lean MEDSL · Jefferson
- 2024 margin
- D (+10.4) · D 54.6% · R 44.2% · Other 1.2%
- 2008→2024 swing
- +5.4pp toward D · 2008: 5.1pp · 2024: 10.4pp
- All cycles
- 2024: D+10.4 2020: D+13.2 2016: D+7.2 2012: D+6.0 2008: D+5.1
Not yet ingested
- Civics
- —
Market trends
- HPI YoY
- ▼ -74.54%
- Current HPI
- 117.416
- Rent YoY
- ▲ 3.58%
- Metro
- Birmingham-Hoover, AL
- State GDP YoY
- ▲ 2.94%
- F500 in state
- 4
Industry mix (Fortune 500 HQ in AL)
| Industry | F500 HQs | Revenue |
|---|---|---|
| Financial Services | 1 | $8B |
|
||
| Healthcare | 1 | $5B |
|
||
Price history
+28.6% since first listed6 events — show timeline
- 2026-05-29 Listed $45,000 Greater Alabama MLS
- 2022-02-25 Sold (MLS) $45,000 Greater Alabama MLS
- 2022-01-22 Price Changed $60,000 Greater Alabama MLS
- 2021-12-10 Listed $65,000 Greater Alabama MLS
- 2021-07-15 Sold (MLS) $25,000 Greater Alabama MLS
- 2021-03-07 Listed $35,000 Greater Alabama MLS
Property tax history
+6.7%/yrLatest (2025): $337 · +0.0% YoY. Source: county tax records.
Cash-flow waterfall
monthlySold comps — $/sqft
last 12 mo · ≤1 miLoading sold comps…