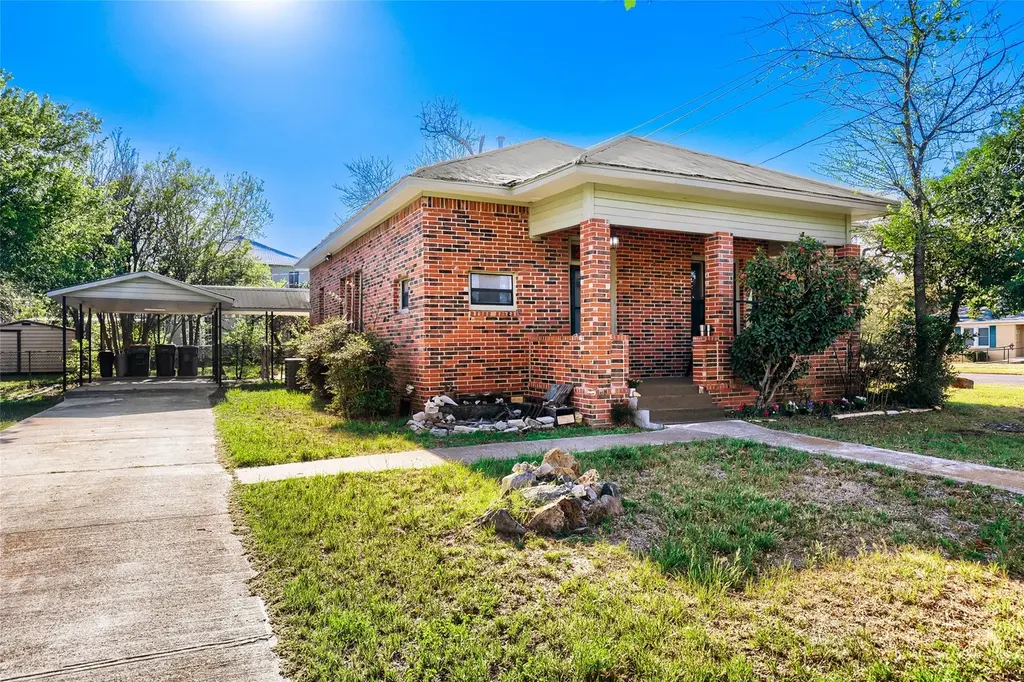
208 N Avenue B · Elgin, TX
Flood risk 1/10 · Minimal
- FEMA flood zone
- X (unshaded)
- Chance of flooding over 30 yrs
- 0.0%
- Est. flood insurance / yr
- $507 – $1,088
Fire risk 4/10 · Minor
- Est. fire insurance / yr
- $1,222 – $2,270
Heat risk 8/10 · Major
- Hot days now (above 109°F)
- 7 days/yr
- Hot days in 30 yrs
- 21 days/yr
Wind risk 8/10 · Major
- Chance of severe wind over 30 yrs
- 80.0%
Air-quality risk 1/10 · Minimal
- Unhealthy air days now
- 0 days/yr
- Unhealthy air days in 30 yrs
- 0 days/yr
Risk factors via First Street. Map © Google.
Why this score? — see what drove the D- grade
The composite is a weighted blend of 9 inputs, each scored 0–100. Each bar is that input's sub-score; the figure is the points it added to the 100-point composite (weight × sub-score).
- ARV discount +12.2/15.0
- Appreciation +10.0/10.0
- Cash flow +5.1/30.0
- Livability +3.7/5.0
- Rent growth +3.3/5.0
- Condition / age +2.5/5.0
- Schools +2.0/10.0
- 1% rule +0.8/10.0
- DSCR +0.0/10.0
$285,500
🖨 Deal sheet 📄 Offer letter ✓ Due diligence
Listing remarks MLS
Step inside this charming, fully renovated home with modern amenities. Featuring PEX plumbing, updated electrical, and a cozy front porch swing. The spacious double lot boasts a backyard garden with rich soil and Heritage oak trees. Original craftsman pine plank floors add character to this 1940 property. Enjoy the convenience of a new carport and on-demand water heater. Located close to downtown for easy access to entertainment. This single-family home offers 2 bedrooms, 2 bathrooms, and 1360 square feet of living space on a 11,500 square foot lot. Don't miss out on this gem!
Key facts
- Front porch swing
- Updated elect
- Double lot
Tags
Property features AI
Finance
- HOA & community: Park nearby
Exterior
- Parking: Detached carport; Space for 2 vehicles
- Utilities: Electricity connected; Public water; Public sewer; Cable available
- Home design: Single-story home; Faces north; Pillar/post/pier foundation
- Construction: Brick construction; Metal roof; Built according to public records
- Exterior features: Covered front porch; Exterior steps; Garden; Shed(s) / storage; Chain-link fencing; Alley access
Interior
- Kitchen: Dishwasher; Free-standing gas oven; Free-standing gas range; Plumbed for ice maker
- Bedrooms: Three main-level bedrooms
- Flooring: Wood flooring
- Bathrooms: Two full bathrooms
- Heating & cooling: Central heating; Central air conditioning
- Interior features: Ceiling fans; High ceilings; Natural woodwork; Window details listed in remarks
- Laundry & utility: Main-level laundry; Exterior laundry access
Neighborhood map
What this means for you Summary
Snapshot
- This is a 2-bed/2.0-bath single-family listed at $286k.
Deal economics
- At list price, monthly cash flow is $-658 ($-8k/yr) — negative.
- To cash-flow at today's rent, offer at most $169k (40.7% below list).
- To meet the 1% rule (rent ≥ 1% of price), the offer needs to be $167k (41.6% below list).
- Recommended offer: $167k (41.6% below list) — sets the bar for 1% rule.
Location & tenants
- Location reads 74/100 on livability (#167 in TX, #4,404 nationally) — a middle-class / working-renter tenant base. Strengths: cost of living A+, housing A+, health & safety A+; Watch: schools F, amenities F, commute F.
- Elgin ISD (rural): math 17% / reading 26% proficiency, ranked #741 of 826 in TX (top 90%) — low school quality limits family demand, transient renter base, plan for 1-2y turnover; 67% free/reduced lunch — lower-income household profile, screen leases tightly.
- Market conditions: Rents rising (+3.1%/yr); 807 active listings in the ZIP; 8 comparable units currently listed for rent nearby; rentals at typical pace (median 18d on market — plan ~3-4 weeks tenant-placement turnaround); solid renter incomes; 1,841 units permitted in Bastrop County in 2024 (150 in 5+ unit buildings).
Forward outlook
- In year one you build about $31k of equity ($2k loan paydown + $29k appreciation (10.0% local appreciation)).
- Bastrop County population projected at +37% by 2050 — long-run rental-demand tailwind backs the buy-and-hold thesis.
- By year 2, paydown + projected appreciation supports a ~$49k cash-out refi (75% LTV) — recoverable capital for the next deal without selling this one.
Negotiation context
- Only 7 days on market — expect competitive offers; lowballing is unlikely to land.
- 4 sale attempts since 23y ago with the ask held roughly flat each time — persistent listings suggest the price (not the market) is what's stuck; bring a comps-based counter.
- Current owner paid $88k; list at $286k implies a 223% gain — meaningful room to come down on a strong offer.
Risks & watch-outs
- Watch-outs: built in 1940 — expect roof / HVAC / electrical / plumbing capex.
- Climate carrying-cost: severe wind risk, 80% chance of damaging wind over 30y; extreme-heat days projected 7→21/yr by 2055 (HVAC capex compounding) — expect insurance premiums to compound above CPI over the hold.
Questions for the listing agent
- What do current leases actually rent for vs. the listed asking? Can we see a recent rent roll and the last 12 months of T-12 income?
- Built in 1940 — when were the roof, HVAC, electrical panel, plumbing, and water heater last replaced?
- Is there a deadline driving the sale (1031 exchange, divorce, estate, relocation)? That informs how much negotiation room exists.
- Schools are F-rated, which usually means shorter tenancies and higher turnover. Who's the typical renter profile here, and what's been the actual vacancy rate?
- The area grade is low — what's the realistic commute time and amenity access for the typical tenant pool here? Any planned neighborhood developments (good or bad) we should know about?
- What's the average days-on-market for RENTAL listings here right now (not sales)? A rising rental-DOM trend means longer vacancies and softer asking-rent achievability than the comps imply.
- What's the recent tenant-quality profile in this submarket — average credit score on applications, eviction rate, late-payment / NSF rate, and stable-employment percentage? A property-management company in the area should have these aggregated.
- How much new for-sale + rental construction is in the pipeline within 1–3 miles? Heavy new supply typically softens prices + rents 12–24 months out; constrained supply supports both.
Investment metrics
- 1% rule
- 0.58% ✗
- Cap rate
- 3.53%
- Cash-on-cash
- -9.88%
- DSCR
- 0.56
- GRM
- 14.3
CMA / ARV
- ARV (median comp)
- $318,832
- List price
- $285,500
- Delta
- -10.45%
- Verdict
- UNDERPRICED
- Comps
- 20 within 1.0 mi
Show comp detail 12 sales within ~0.75 mi
| Address | Dist | Beds/Ba | Sqft | Sold | Price | $/sf | Match |
|---|---|---|---|---|---|---|---|
| 518 N Avenue F | 0.39mi | 2/1.0 | 1,316 (-3%) | 4mo | $325,000 | $247 | 70 |
| 215 Taylor Rd | 0.38mi | 2/1.0 | 1,344 (-1%) | 10mo | $229,900 | $171 | 68 |
| 202 S Ave B | 0.31mi | 3/2.0 (+1) | 1,328 (-2%) | 12mo | $149,900 | $113 | 67 |
| 110 Lexington Rd | 0.14mi | 3/2.0 (+1) | 1,224 (-10%) | 8mo | $309,000 | $252 | 66 |
| 308 Taylor Rd | 0.46mi | 2/1.0 | 1,428 (+5%) | 4mo | $249,900 | $175 | 63 |
| 125 Irene St | 0.68mi | 3/2.5 (+1) | 1,400 (+3%) | 1mo | $299,990 | $214 | 55 |
| 907 N Avenue C | 0.30mi | 3/1.0 (+1) | 1,496 (+10%) | 11mo | $350,000 | $234 | 51 |
| 1114 N Avenue C | 0.47mi | 2/2.0 | 1,202 (-12%) | 15mo | $268,000 | $223 | 46 |
| 1115 N Avenue C | 0.47mi | 2/1.0 | 1,200 (-12%) | 12mo | $265,000 | $221 | 45 |
| 514 N Avenue F Ave | 0.38mi | 3/1.0 (+1) | 1,536 (+13%) | 14mo | $265,000 | $173 | 41 |
| 118 Anderson Dr | 0.66mi | 2/2.0 | 1,557 (+14%) | 6mo | $339,000 | $218 | 40 |
| 300 W Cleveland St | 0.63mi | 2/2.0 | 1,552 (+14%) | 8mo | $199,000 | $128 | 40 |
Match score weights: distance 35% · size 25% · config 20% · recency 20%. Top-matched comps best support the ARV.
Projected returns pro-forma
10.0% appreciation · 3.12% rent growth · sell at horizon
- IRR
- 17.4%
- Equity multiple
- 2.42×
- Total profit
- $113,798
- Equity at exit
- $257,201
- IRR
- 16.4%
- Equity multiple
- 5.61×
- Total profit
- $368,544
- Equity at exit
- $554,664
Cash invested: $79,940 (down + closing). Projections, not guarantees.
Landlord ↔ Tenant lean methodology
- Overall (STATE)
- 87 Strongly Landlord-Friendly
- State Texas
- 87 Strongly Landlord-Friendly · R+5
- County
- — inherits STATE
- City
- — inherits STATE
ZIP-level market 78621
- Home prices YoY
- 7.6%
- Rents YoY
- 3.1%
- Active inventory
- 807
- Price-to-rent
- 14.3×
Monthly cashflow live
- Estimated rent
- $1,666 high interval (Pro) →
- Mortgage (P&I)
- −$1,497
- Tax from tax record
- −$358 /mo · $4,300/yr
- Insurance
- −$119
- HOA
- −$0
- Vacancy / Maint / Mgmt
- −$350
- Net cashflow
- $-658
Break-even live
UW: 25.0% down · 7.5% · 30yr · 1.5% tax · 5.0% vac · 8.0% maint · 8.0% mgmt
Financing live
Cash to close
- Down payment
- $71,375
- Closing costs
- $8,565
- Reserves months
- —
- Total cash needed
- —
Loan-product check · same deal, 3 products live
Conventional
25% down · 7.5% · 30yr
- Down + closing
- —
- Monthly P&I
- —
- Monthly cashflow
- —
- DSCR
- —
- Eligible?
- —
Personal DTI + credit; lowest rate.
DSCR
20% down · 8.5% · 30yr
- Down + closing
- —
- Monthly P&I
- —
- Monthly cashflow
- —
- DSCR
- —
- Eligible?
- —
No personal income docs; deal must DSCR.
Hard money
10% down · 12.0% · 12mo
- Down + closing
- —
- Monthly P&I
- —
- Monthly cashflow
- —
- DSCR
- —
- Eligible?
- —
Short-term bridge; refi at stabilization.
Rent comps 8 comps
| Address | Beds | Baths | Sqft | Rent | $/sqft | DOM | Units | Dist |
|---|---|---|---|---|---|---|---|---|
| 110 S Main St #104 Elgin, TX | 3.0 | 2.0 | 1061 | $1,700 | $1.60 | 43d | 1 | 0.30mi |
| 200 Maple Ln Elgin, TX | 2.0 | 2.0 | 891 | $1,400 | $1.57 | 43d | 1 | 0.53mi |
| 204 Hall St Unit A Elgin, TX | 2.0 | 1.0 | 910 | $1,195 | $1.31 | 1d | 1 | 0.66mi |
| 805 Lexington Rd Unit A Elgin, TX | 2.0 | 2.0 | 889 | $1,400 | $1.57 | 2d | 1 | 0.79mi |
| 805 Lexington Rd Unit B Elgin, TX | 2.0 | 2.0 | 889 | $1,350 | $1.52 | 1d | 1 | 0.79mi |
| 108 Bendecido Loop Elgin, TX | 3.0 | 2.0 | 1300 | $1,950 | $1.50 | 17d | 1 | 1.10mi |
| 102 Schuylerville Dr Elgin, TX | 3.0 | 2.0 | 1479 | $1,800 | $1.22 | 43d | 1 | 1.16mi |
| 419 Gettysburg Loop Elgin, TX | 3.0 | 2.0 | 1565 | $1,850 | $1.18 | 12d | 1 | 1.31mi |
Listing history 22 events
-
2026-06-18days on market $285,500 Active 7 DOM
-
2026-06-17days on market $285,500 Active 6 DOM
-
2026-06-16days on market $285,500 Active 5 DOM
-
2026-06-15days on market $285,500 Active 4 DOM
-
2026-06-13remarks 317-char remark
-
2026-06-13days on market $285,500 Active 2 DOM
-
2026-06-09days on market $285,500 Active 72 DOM
-
2026-06-08days on market $285,500 Active 71 DOM
-
2026-06-07pricedays on market $285,500 Active 70 DOM
-
2026-06-04days on market $299,500 Active 67 DOM
Show marketing remark (583 chars)
Step inside this charming, fully renovated home with modern amenities. Featuring PEX plumbing, updated electrical, and a cozy front porch swing. The spacious double lot boasts a backyard garden with rich soil and Heritage oak trees. Original craftsman pine plank floors add character to this 1940 property. Enjoy the convenience of a new carport and on-demand water heater. Located close to downtown for easy access to entertainment. This single-family home offers 2 bedrooms, 2 bathrooms, and 1360 square feet of living space on a 11,500 square foot lot. Don't miss out on this gem!
-
2026-06-03days on market $299,500 Active 66 DOM
-
2026-06-02days on market $299,500 Active 65 DOM
-
2026-06-01days on market $299,500 Active 64 DOM
-
2026-05-31days on market $299,500 Active 63 DOM
-
2026-05-15price $299,500 336-char remark
Show marketing remark (583 chars)
Step inside this charming, fully renovated home with modern amenities. Featuring PEX plumbing, updated electrical, and a cozy front porch swing. The spacious double lot boasts a backyard garden with rich soil and Heritage oak trees. Original craftsman pine plank floors add character to this 1940 property. Enjoy the convenience of a new carport and on-demand water heater. Located close to downtown for easy access to entertainment. This single-family home offers 2 bedrooms, 2 bathrooms, and 1360 square feet of living space on a 11,500 square foot lot. Don't miss out on this gem!
-
2026-03-29$299,999 Active 336-char remark
Show marketing remark (583 chars)
Step inside this charming, fully renovated home with modern amenities. Featuring PEX plumbing, updated electrical, and a cozy front porch swing. The spacious double lot boasts a backyard garden with rich soil and Heritage oak trees. Original craftsman pine plank floors add character to this 1940 property. Enjoy the convenience of a new carport and on-demand water heater. Located close to downtown for easy access to entertainment. This single-family home offers 2 bedrooms, 2 bathrooms, and 1360 square feet of living space on a 11,500 square foot lot. Don't miss out on this gem!
-
2003-10-14soldstatus $88,301
-
2003-09-08historical
-
2003-09-01historical
-
2003-08-31
-
2003-04-07
-
1987-03-25soldstatus $43,900
ⓘ Source: listings_history table (triggers on properties + properties_extension) + one-shot
backfill from property_details.listing_events for pre-trigger history.
Tax reassessment forecast TX · Resets to sale price
- Current annual tax
- $4,300 · $358/mo
- Projected year-2 tax
- $5,225 · $435/mo
- Expected delta
- +$924/yr (+$77/mo · 21.5%)
ⓘ Screening estimate from a state-policy table — verify with the county assessor before closing.
Climate risk First Street
- Flood 1/10 Low FEMA zone X (unshaded) · 0% chance over 30 yrs
- Wildfire 4/10 Moderate
- Heat 8/10 Severe 7 d/yr ≥109°F today · 21 d/yr by 30 yrs out
- Wind 8/10 Severe 80% chance of damaging wind over 30 yrs
- Air quality 1/10 Low 0 unhealthy d/yr today · 0 by 30 yrs out
Nearby sold comps map
Loading sold comps map…
Walkable amenities ~0.75 mi
Loading nearby amenities…
Taxation est. · year 1
- Rental income
- $19,995
- − Mortgage interest
- −$15,992
- − Property taxes
- −$4,300
- − Insurance
- −$1,428
- − Repairs & maintenance
- −$1,600
- − Management
- −$1,600
- − Depreciation
- −$8,305
- Taxable loss
- −$13,230
- Est. tax savings @ 24.0%
- +$3,175
- After-tax cash flow
- $-4,723/yr
For passive investors: Depreciation is non-cash, so a rental often shows a tax loss while cash-flowing — sheltering income. Rental losses are passive: they offset passive income freely, and up to $25,000/yr can offset ordinary (W-2) income if you actively participate and your MAGI is under $100k (phasing out to $0 by $150k); unused losses carry forward. On sale, claimed depreciation is recaptured at up to 25%, and gains may owe capital-gains tax (a 1031 exchange can defer both). Figures are a year-1 estimate at your 24.0% rate — not tax advice; consult a CPA.
Schools (NCES district)
- District
- Elgin ISD
- NCES district ID
- 4818360
- Math proficiency
- 17% ▼ -9.00%
- Reading proficiency
- 26% ▼ -5.00%
- Median HH income
- $55,176
- Composite
- 19.62/100
- National rank
- #8749
- State rank
- #741 of 826 in TX
Livability — Elgin
- Score
- 74/100
- State rank
- #167
- US rank
- #4404
Category grades
Schools grade is shown separately in the Schools card above.
Census & demographics
- Census place
- Elgin, TX
- County
- Bastrop County · 68,601 people
- City population
- 27,860
- Metro
- Austin-Round Rock-Georgetown, TX
- Population (ZIP)
- 30,411
- Household income
- $98,534
- Rent vs Own
- Severe rent burden
- 235.0
Population outlook (Bastrop County) Hauer SSP2
- Today (2025)
- 94,260 people
- By 2030
- 101,355 · +7.5%
- By 2040
- 115,578 · +22.6%
- By 2050
- 129,464 · +37.3%
- By 2075
- 168,068 · +78.3%
- By 2100
- 194,857 · +106.7%
Race, ethnicity, and origin ACS 2023
- Neighborhood character
- Diverse neighborhood (Simpson 0.64)
- Race & ethnicity
- Hispanic / Latino 46% White 38% Two or more races 19% Black 11% Native American 1%
- Hispanic origin (detail)
- Mexican 38%
- Common ancestry
- Slovak 2% Italian 2% Romanian 1%
- Foreign-born
- 17% · Canada, Vietnam
- Languages at home
- 63% English-only · Spanish 36%
Political lean MEDSL · Bastrop
- 2024 margin
- R (+18.4) · D 40.2% · R 58.6% · Other 1.2%
- 2008→2024 swing
- -10.2pp toward R · 2008: -8.2pp · 2024: -18.4pp
- All cycles
- 2024: R+18.4 2020: R+13.8 2016: R+20.4 2012: R+17.0 2008: R+8.2
Not yet ingested
- Civics
- —
Market trends
- HPI YoY
- ▲ 29.47%
- Current HPI
- 416.87
- Rent YoY
- ▲ 3.12%
- Metro
- Austin-Round Rock-Georgetown, TX
- State GDP YoY
- ▲ 3.95%
- F500 in state
- 110
Industry mix (Fortune 500 HQ in TX)
| Industry | F500 HQs | Revenue |
|---|---|---|
| Energy | 16 | $1,198B |
|
||
| Technology | 5 | $198B |
|
||
| Engineering / Construction | 4 | $72B |
|
||
| Energy Services | 3 | $60B |
|
||
| Utilities | 3 | $41B |
|
||
| Healthcare | 2 | $330B |
|
||
Price history
+550.3% since first listed12 events — show timeline
- 2026-06-11 Listed $285,500 Unlock MLS
- 2026-06-05 Price Changed $285,500 HARMLS
- 2026-06-04 Price Changed $295,500 HARMLS
- 2026-06-04 Price Changed $285,500 HARMLS
- 2026-05-15 Price Changed $299,500 HARMLS
- 2026-03-29 Listed $299,999 HARMLS
- 2003-10-14 Sold (Public Records) $88,301 Public Records
- 2003-09-08 Delisted — Unlock MLS
- 2003-09-01 Delisted — Unlock MLS
- 2003-08-31 Listed — Unlock MLS
- 2003-04-07 Listed — Unlock MLS
- 1987-03-25 Sold (Public Records) $43,900 Public Records
Property tax history
+4.0%/yrLatest (2026): $4,300 · -9.4% YoY. Source: county tax records.
Cash-flow waterfall
monthlySold comps — $/sqft
last 12 mo · ≤1 miLoading sold comps…