 5-Plex
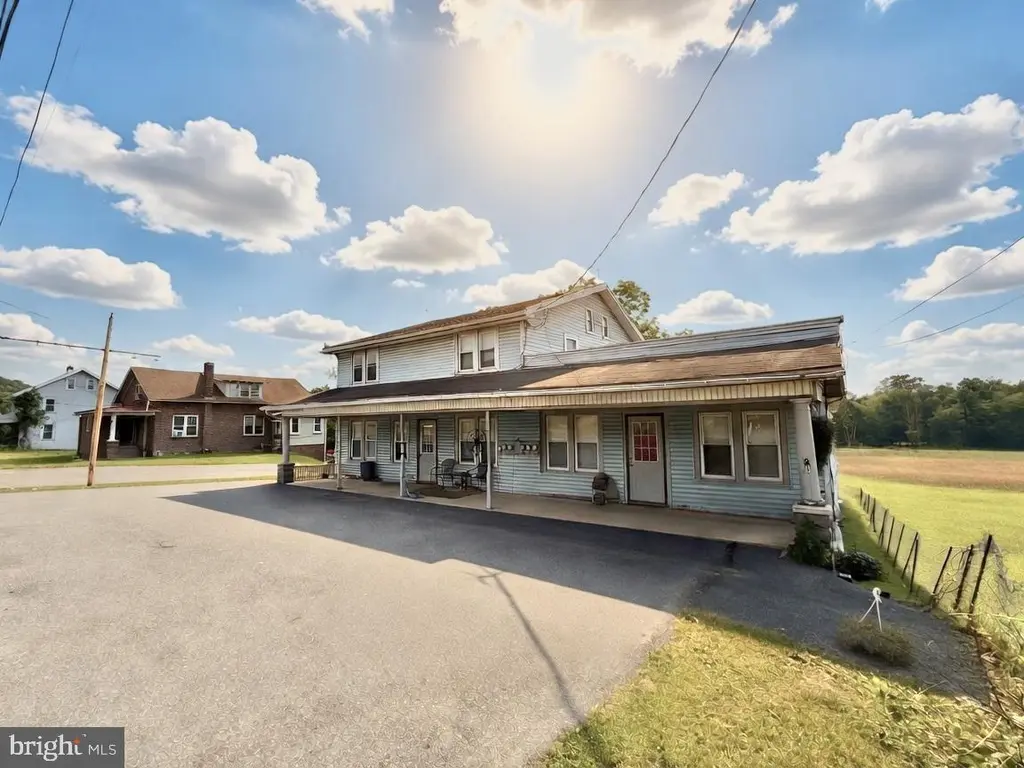
16541 Pottsville Pi · Windsor, PA
Flood risk 1/10 · Minimal
- FEMA flood zone
- X (unshaded)
- Chance of flooding over 30 yrs
- 0.0%
- Est. flood insurance / yr
- $473 – $860
Fire risk 1/10 · Minimal
- Est. fire insurance / yr
- $511 – $949
Heat risk 5/10 · Moderate
- Hot days now (above 100°F)
- 7 days/yr
- Hot days in 30 yrs
- 16 days/yr
Wind risk 4/10 · Minor
- Chance of severe wind over 30 yrs
- 10.0%
Air-quality risk 3/10 · Minor
- Unhealthy air days now
- 2 days/yr
- Unhealthy air days in 30 yrs
- 4 days/yr
Risk factors via First Street. Map © Google.
Why this score? — see what drove the A- grade
The composite is a weighted blend of 9 inputs, each scored 0–100. Each bar is that input's sub-score; the figure is the points it added to the 100-point composite (weight × sub-score).
- Cash flow +30.0/30.0
- DSCR +10.0/10.0
- Appreciation +10.0/10.0
- 1% rule +9.9/10.0
- ARV discount +7.5/15.0
- Condition / age +3.8/5.0
- Livability +3.5/5.0
- Schools +3.2/10.0
- Rent growth +2.5/5.0
$399,900
🖨 Deal sheet 📄 Offer letter ✓ Due diligence
Multi-family units
County records classify this as Multi-Family (2-4 Unit). Listing-text estimate: 5 units. estimate disagrees with records
Listing remarks
INVESTMENT OPPORTUNITY – 5 UNIT MIXED-USE INCOME PROPERTY! 3 first floor units and 2 second floor units. Looking to expand your investment portfolio? This income-producing 5-unit mixed-use property offers strong rental potential in a highly desirable location! Featuring 3 one-bedroom apartments and 2 two-bedroom apartments. Whether you’re a seasoned investor or just beginning to build your portfolio, this property presents an excellent opportunity for consistent cash flow and long-term appreciation, especially with some updates. Conveniently located close to schools, shopping, restaurants, and everyday amenities, tenants will appreciate the accessibility and convenience this l
Key facts
- Close to schools
- Mixed-use property
- 0.33 acre lot
Tags
Property features AI
Finance
- Financial info: Total of 4 units; Gross income reported at $55,000; Gross scheduled income $55,000; Total actual rent $50,160; Net operating income $37,000; Operating expenses $18,000 (includes trash and snow removal); No rent control
Exterior
- Parking: Off-street parking with 6 spaces (total 6 garage/parking spaces)
- Utilities: Public water; Public sewer
- Home design: Detached property; Year built estimated; Fee simple ownership
- Construction: Stone and other foundation types
- Exterior features: Detached structure; Above-grade and below-grade other structures; Lot dimensions per assessor
Interior
- Bedrooms: Three 1-bedroom units; Two 2-bedroom units
- Heating & cooling: Window air conditioning units (electric); Heating with electric and oil; Electric hot water
- Interior features: Estimated living area; Month-to-month existing leases
Neighborhood map
What this means for you Summary
Snapshot
- This is a 3×1bd/1.5ba + 2×2bd/1.5ba units multifamily listed at $400k. Condition is rated good.
Deal economics
- At list price, monthly cash flow is $2k ($23k/yr) — positive. Per door: $388/mo.
- The deal already cash-flows at list — no discount required.
- Meets the 1% rule at list price ($6k rent vs $400k).
- Cap rate 12.1% vs local median 1.9% in Windsor — top-decile yield for the area; either an underpriced asset or a hidden risk that comps aren't pricing in. Stress-test before assuming the spread holds.
Location & tenants
- Location reads 70/100 on livability (#748 in PA) — a middle-class / working-renter tenant base. Strengths: crime A+, cost of living A+, housing A+; Watch: employment D+, schools F, amenities F.
- Hamburg Area SD (other): math 31% / reading 43% proficiency, ranked #377 of 539 in PA (top 70%) — families likely to look elsewhere, expect single-tenant / working-renter base with shorter leases.
- Market conditions: 46 active listings in the ZIP; 258 units permitted in Berks County in 2024 (27 in 5+ unit buildings).
Forward outlook
- In year one you build about $43k of equity ($3k loan paydown + $40k appreciation (10.0% local appreciation)).
- Berks County population projected at +3% by 2050 — modest demand growth; plan on rents tracking national, not racing it.
- At projected returns (10.0% appreciation + 3.0% rent growth), your $112k cash investment doubles in ~2 years — after that, you're playing with house money.
- By year 2, paydown + projected appreciation supports a ~$69k cash-out refi (75% LTV) — recoverable capital for the next deal without selling this one.
Negotiation context
- Only 6 days on market — expect competitive offers; lowballing is unlikely to land.
Risks & watch-outs
- Watch-outs: built in 1900 — expect roof / HVAC / electrical / plumbing capex.
- Climate carrying-cost: extreme-heat days projected 7→16/yr by 2055 (HVAC capex compounding) — expect insurance premiums to compound above CPI over the hold.
Questions for the listing agent
- Can we see the unit-by-unit rent roll, current vacancy, and any below-market leases? What's the average tenancy length?
- What capital expenditures (roof, boiler, parking lot, exteriors) have been made in the last 5 years, and what's planned in the next 2?
- Built in 1900 — when were the roof, HVAC, electrical panel, plumbing, and water heater last replaced?
- Is there a deadline driving the sale (1031 exchange, divorce, estate, relocation)? That informs how much negotiation room exists.
- Schools are F-rated, which usually means shorter tenancies and higher turnover. Who's the typical renter profile here, and what's been the actual vacancy rate?
- What's the average days-on-market for RENTAL listings here right now (not sales)? A rising rental-DOM trend means longer vacancies and softer asking-rent achievability than the comps imply.
- What's the recent tenant-quality profile in this submarket — average credit score on applications, eviction rate, late-payment / NSF rate, and stable-employment percentage? A property-management company in the area should have these aggregated.
- How much new apartment / multifamily construction is in the pipeline within 1–3 miles? Heavy new supply (>2% of stock underway) typically softens rents 12–24 months out; light construction supports rent growth.
Investment metrics
- 1% rule
- 1.49% ✓
- Cap rate
- 12.11%
- Cash-on-cash
- 20.77%
- DSCR
- 1.92
- GRM
- 5.6
CMA / ARV
No comps found within radius.
Projected returns pro-forma
10.0% appreciation · 3.0% rent growth · sell at horizon
- IRR
- 39.8%
- Equity multiple
- 4.05×
- Total profit
- $341,348
- Equity at exit
- $360,262
- IRR
- 34.3%
- Equity multiple
- 9.11×
- Total profit
- $908,301
- Equity at exit
- $776,918
Cash invested: $111,972 (down + closing). Projections, not guarantees.
Landlord ↔ Tenant lean methodology
- Overall (STATE)
- 62 Landlord-Friendly
- State Pennsylvania
- 62 Landlord-Friendly · EVEN
- County
- — inherits STATE
- City
- — inherits STATE
ZIP-level market 19526
- Home prices YoY
- 4.6%
- Active inventory
- 46
- Price-to-rent
- 28.0×
Monthly cashflow live
- Estimated rent
- $5,952 medium interval (Pro) →
- Mortgage (P&I)
- −$2,097
- Tax est. 1.5%
- −$500 /mo · $5,998/yr
- Insurance
- −$167
- HOA
- −$0
- Vacancy / Maint / Mgmt
- −$1,250
- Net cashflow
- $1,938
Break-even live
5-unit breakdown (identical units grouped — click to expand)
| Units | Beds | Baths | Est. rent |
|---|---|---|---|
| 3× units | 1 | 1.5 | $3,570 |
| #1 | 1 | 1.5 | $1,190 |
| #2 | 1 | 1.5 | $1,190 |
| #3 | 1 | 1.5 | $1,190 |
| 2× units | 2 | 1.5 | $2,380 |
| #4 | 2 | 1.5 | $1,190 |
| #5 | 2 | 1.5 | $1,190 |
| Total (5 units) | $5,952 | ||
UW: 25.0% down · 7.5% · 30yr · 1.5% tax · 5.0% vac · 8.0% maint · 8.0% mgmt
Financing live
Cash to close
- Down payment
- $99,975
- Closing costs
- $11,997
- Reserves months
- —
- Total cash needed
- —
Loan-product check · same deal, 3 products live
Conventional
25% down · 7.5% · 30yr
- Down + closing
- —
- Monthly P&I
- —
- Monthly cashflow
- —
- DSCR
- —
- Eligible?
- —
Personal DTI + credit; lowest rate.
DSCR
20% down · 8.5% · 30yr
- Down + closing
- —
- Monthly P&I
- —
- Monthly cashflow
- —
- DSCR
- —
- Eligible?
- —
No personal income docs; deal must DSCR.
Hard money
10% down · 12.0% · 12mo
- Down + closing
- —
- Monthly P&I
- —
- Monthly cashflow
- —
- DSCR
- —
- Eligible?
- —
Short-term bridge; refi at stabilization.
Listing history 6 events
-
2026-06-18days on market $399,900 Active 6 DOM
-
2026-06-17days on market $399,900 Active 5 DOM
-
2026-06-16days on market $399,900 Active 4 DOM
-
2026-06-15days on market $399,900 Active 3 DOM
-
2026-06-13remarks 687-char remark
-
2026-06-13$399,900 Active 1 DOM
ⓘ Source: listings_history table (triggers on properties + properties_extension) + one-shot
backfill from property_details.listing_events for pre-trigger history.
Climate risk First Street
- Flood 1/10 Low FEMA zone X (unshaded) · 0% chance over 30 yrs
- Wildfire 1/10 Low
- Heat 5/10 Major 7 d/yr ≥100°F today · 16 d/yr by 30 yrs out
- Wind 4/10 Moderate 10% chance of damaging wind over 30 yrs
- Air quality 3/10 Moderate 2 unhealthy d/yr today · 4 by 30 yrs out
Nearby sold comps map
Loading sold comps map…
Walkable amenities ~0.75 mi
Loading nearby amenities…
Taxation est. · year 1
- Rental income
- $71,424
- − Mortgage interest
- −$22,401
- − Property taxes
- −$5,998
- − Insurance
- −$2,000
- − Repairs & maintenance
- −$5,714
- − Management
- −$5,714
- − Depreciation
- −$11,633
- Taxable income
- $17,964
- Est. tax owed @ 24.0%
- −$4,311
- After-tax cash flow
- $18,950/yr
For passive investors: Depreciation is non-cash, so a rental often shows a tax loss while cash-flowing — sheltering income. Rental losses are passive: they offset passive income freely, and up to $25,000/yr can offset ordinary (W-2) income if you actively participate and your MAGI is under $100k (phasing out to $0 by $150k); unused losses carry forward. On sale, claimed depreciation is recaptured at up to 25%, and gains may owe capital-gains tax (a 1031 exchange can defer both). Figures are a year-1 estimate at your 24.0% rate — not tax advice; consult a CPA.
Condition & rehab AI · 13 photos
This 5-unit mixed-use property is in good condition with some cosmetic updates needed. It offers strong rental potential and is located in a highly desirable location.
Value-add opportunities
- Both Paint the exterior siding — Painting the exterior siding will improve the curb appeal and increase the property's value.
- Both Landscaping and curb appeal improvements — Improving the landscaping and curb appeal will enhance the property's visual appeal and attract more tenants or buyers.
Renovation cost estimate screening
Value-add ROI direction
- Both Paint the exterior siding — Painting the exterior siding will improve the curb appeal and increase the property's value. ↑
- Both Landscaping and curb appeal improvements — Improving the landscaping and curb appeal will enhance the property's visual appeal and attract more tenants or buyers. ↑
ⓘ Cost ranges are severity-bucket heuristics (US national rule-of-thumb). Get contractor quotes + a written scope before underwriting a rehab budget.
Schools (NCES district)
- District
- Hamburg Area SD
- NCES district ID
- 4211340
- Math proficiency
- 31% ▼ -12.00%
- Reading proficiency
- 43% ▼ -15.00%
- Median HH income
- $55,589
- Composite
- 32.5/100
- National rank
- #5705
- State rank
- #377 of 539 in PA
Livability — Windsor
- Score
- 70/100
- State rank
- #748
- US rank
- #7475
Category grades
Schools grade is shown separately in the Schools card above.
Census & demographics
- Population (ZIP)
- 11,412
Population outlook (Berks County) Hauer SSP2
- Today (2025)
- 425,767 people
- By 2030
- 428,814 · +0.7%
- By 2040
- 433,463 · +1.8%
- By 2050
- 439,426 · +3.2%
- By 2075
- 478,647 · +12.4%
- By 2100
- 518,507 · +21.8%
Race, ethnicity, and origin ACS 2023
- Neighborhood character
- Predominantly White (90%)
- Race & ethnicity
- White 90% Hispanic / Latino 6% Two or more races 3% Black 1%
- Hispanic origin (detail)
- Puerto Rican 4%
- Common ancestry
- Polish 7% Romanian 4% Iranian 2%
- Foreign-born
- 1% · Canada
- Languages at home
- 97% English-only · Spanish 2% German/W. Germanic 1%
Political lean MEDSL · Berks
- 2024 margin
- R (+12.2) · D 43.4% · R 55.6%
- 2008→2024 swing
- -21.4pp toward R · 2008: 9.2pp · 2024: -12.2pp
- All cycles
- 2024: R+12.2 2020: R+8.2 2016: R+10.2 2012: R+0.6 2008: D+9.2
Not yet ingested
- Civics
- —
Market trends
- HPI YoY
- ▲ 13.13%
- Current HPI
- 299.1168
- Rent YoY
- —
- Metro
- —
- State GDP YoY
- ▲ 1.68%
- F500 in state
- 34
Industry mix (Fortune 500 HQ in PA)
| Industry | F500 HQs | Revenue |
|---|---|---|
| Healthcare | 2 | $309B |
|
||
| Insurance | 2 | $27B |
|
||
| Telecommunications / Media | 1 | $124B |
|
||
| Industrial Distribution | 1 | $22B |
|
||
| Financial Services | 1 | $20B |
|
||
| Chemicals / Materials | 1 | $18B |
|
||
Price history
1 event — show timeline
- 2026-06-12 Listed $399,900 BRIGHT MLS
Cash-flow waterfall
monthlySold comps — $/sqft
last 12 mo · ≤1 miLoading sold comps…