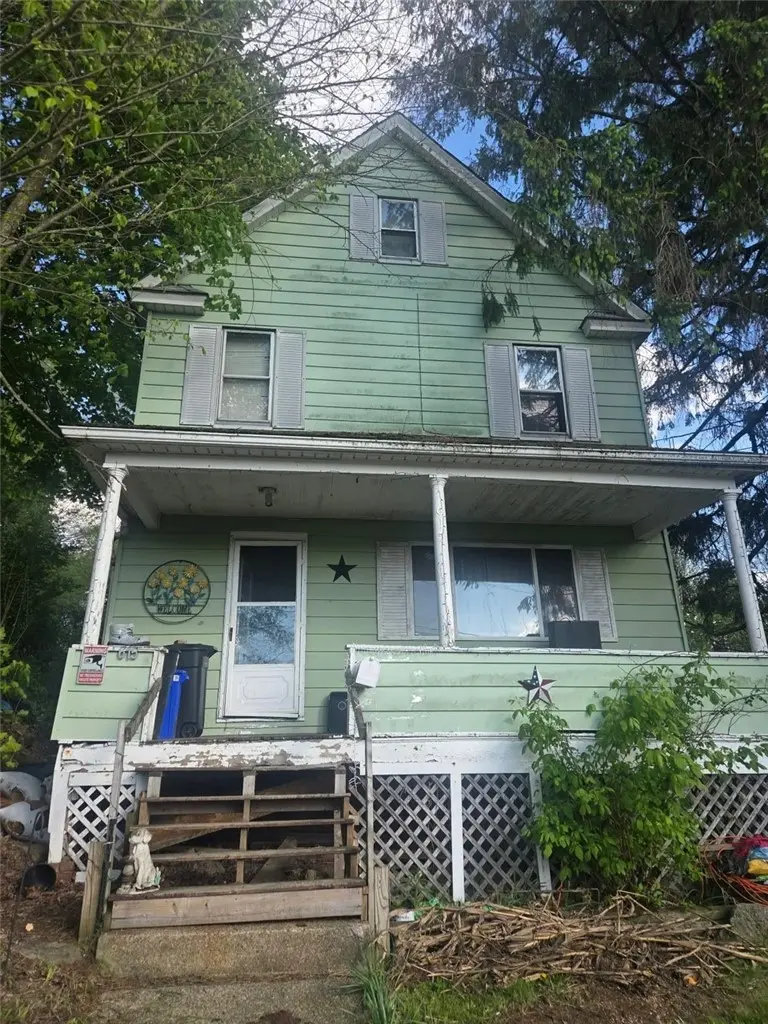
615 Bissell Ave · Oil City, PA
Flood risk 1/10 · Minimal
- FEMA flood zone
- X (unshaded)
- Chance of flooding over 30 yrs
- 0.0%
- Est. flood insurance / yr
- $473 – $860
Fire risk 3/10 · Minor
- Est. fire insurance / yr
- $511 – $949
Heat risk 2/10 · Minimal
- Hot days now (above 92°F)
- 7 days/yr
- Hot days in 30 yrs
- 18 days/yr
Wind risk 1/10 · Minimal
- Chance of severe wind over 30 yrs
- —
Air-quality risk 2/10 · Minimal
- Unhealthy air days now
- 1 days/yr
- Unhealthy air days in 30 yrs
- 2 days/yr
Risk factors via First Street. Map © Google.
Why this score? — see what drove the C grade
The composite is a weighted blend of 9 inputs, each scored 0–100. Each bar is that input's sub-score; the figure is the points it added to the 100-point composite (weight × sub-score).
- Cash flow +15.0/30.0
- ARV discount +14.9/15.0
- Appreciation +6.1/10.0
- 1% rule +5.0/10.0
- DSCR +5.0/10.0
- Livability +3.6/5.0
- Schools +2.7/10.0
- Rent growth +2.5/5.0
- Condition / age +2.5/5.0
$32,500
🖨 Deal sheet 📄 Offer letter ✓ Due diligence
Listing remarks
This is your opportunity to own a two lot in Oil City! 615 Bissell and the right hand side lot (613 Bissell) are ready for their new owner after many lovely years with it's current owner. Charming features such as a brick fireplace and mantel and glass front built in shelf. Take advantage of the double lot and put in some off street parking! While the property could use some fixing, it's great for someone looking for a project.
Key facts
- Off street parking
- Brick fireplace
- Double lot
Tags
Property features AI
Exterior
- Parking: On-street parking
- Utilities: Public water service; Public sewer
- Home design: 3-story building; Frame construction with vinyl siding
- Construction: Built with frame construction and vinyl siding
- Exterior features: Public water; Public sewer; Lot roughly 37 x 120
Interior
- Bathrooms: 1 full bathroom; 1 half bathroom
- Heating & cooling: Forced air heating (gas)
- Interior features: Resale condition
Neighborhood map
What this means for you Summary
Snapshot
- This is a 4-bed/1.5-bath single-family listed at $32k.
Deal economics
- At list price, monthly cash flow is $873 ($10k/yr) — positive.
- The deal already cash-flows at list — no discount required.
- Meets the 1% rule at list price ($1k rent vs $32k).
- Recommended offer: $32k (1.5% below list) — sets the bar for market timing.
- Cap rate 38.5% vs local median 9.6% in Oil City — top-decile yield for the area; either an underpriced asset or a hidden risk that comps aren't pricing in. Stress-test before assuming the spread holds.
Location & tenants
- Location reads 71/100 on livability (#704 in PA) — a middle-class / working-renter tenant base. Strengths: crime A+, cost of living A+, housing A+; Watch: amenities F, commute F, employment F.
- Oil City Area SD (town): math 20% / reading 46% proficiency, ranked #436 of 539 in PA (top 81%) — families likely to look elsewhere, expect single-tenant / working-renter base with shorter leases.
- Market conditions: 53 active listings in the ZIP; 42 units permitted in Venango County in 2024 (0 in 5+ unit buildings).
Forward outlook
- In year one you build about $932 of equity ($225 loan paydown + $707 appreciation (2.2% local appreciation)).
- Venango County population projected at -30% by 2050 — secular population decline; favor cash flow + early exit over multi-decade hold.
- At projected returns (2.2% appreciation + 3.0% rent growth), your $9k cash investment doubles in ~1 year — after that, you're playing with house money.
Negotiation context
- It's been on market 20 days — a 2% lower offer ($32k) is reasonable based on typical stale-listing flexibility.
Risks & watch-outs
- Watch-outs: property tax is 3.6% of price; built in 1900 — expect roof / HVAC / electrical / plumbing capex.
Questions for the listing agent
- Built in 1900 — when were the roof, HVAC, electrical panel, plumbing, and water heater last replaced?
- Property tax is high relative to price — has the assessment been appealed recently, and will the sale trigger a re-assessment?
- Is there a deadline driving the sale (1031 exchange, divorce, estate, relocation)? That informs how much negotiation room exists.
- What's the average days-on-market for RENTAL listings here right now (not sales)? A rising rental-DOM trend means longer vacancies and softer asking-rent achievability than the comps imply.
- What's the recent tenant-quality profile in this submarket — average credit score on applications, eviction rate, late-payment / NSF rate, and stable-employment percentage? A property-management company in the area should have these aggregated.
- How much new for-sale + rental construction is in the pipeline within 1–3 miles? Heavy new supply typically softens prices + rents 12–24 months out; constrained supply supports both.
Investment metrics
- 1% rule
- 4.49% ✓
- Cap rate
- 38.51%
- Cash-on-cash
- 115.06%
- DSCR
- 6.12
- GRM
- 1.9
CMA / ARV
- ARV (median comp)
- $38,948
- List price
- $32,500
- Delta
- -16.55%
- Verdict
- UNDERPRICED
- Comps
- 20 within 1.0 mi
Show comp detail 12 sales within ~0.75 mi
| Address | Dist | Beds/Ba | Sqft | Sold | Price | $/sf | Match |
|---|---|---|---|---|---|---|---|
| 413 Bissell Ave | 0.16mi | 4/1.5 | 1,532 (+9%) | 8mo | $169,000 | $110 | 71 |
| 217 Clarion St | 0.12mi | 3/1.0 (-1) | 1,250 (-11%) | 6mo | $68,900 | $55 | 64 |
| 305 Plummer St | 0.26mi | 3/1.0 (-1) | 1,358 (-4%) | 15mo | $28,000 | $21 | 62 |
| 526 Merritt St | 0.07mi | 3/1.0 (-1) | 1,311 (-7%) | 22mo | $25,000 | $19 | 60 |
| 507 Hoffman Ave | 0.12mi | 4/2.0 | 1,554 (+10%) | 22mo | $37,000 | $24 | 57 |
| 276 Linden Ave | 0.37mi | 3/1.5 (-1) | 1,268 (-10%) | 10mo | $75,000 | $59 | 53 |
| 309 Seeley Ave | 0.32mi | 3/1.0 (-1) | 1,232 (-12%) | 6mo | $16,000 | $13 | 52 |
| 227 Cedar Ave | 0.41mi | 3/1.0 (-1) | 1,344 (-4%) | 19mo | $35,000 | $26 | 50 |
| 220 Mylan St | 0.44mi | 3/1.0 (-1) | 1,216 (-14%) | 2mo | $7,500 | $6 | 48 |
| 289 Cedar Ave | 0.33mi | 3/2.0 (-1) | 1,597 (+13%) | 13mo | $114,000 | $71 | 44 |
| 272 Linden Ave | 0.38mi | 3/1.0 (-1) | 1,560 (+11%) | 16mo | $35,000 | $22 | 44 |
| 16 Smithman St | 0.74mi | 3/2.0 (-1) | 1,584 (+12%) | 6mo | $115,000 | $73 | 32 |
Match score weights: distance 35% · size 25% · config 20% · recency 20%. Top-matched comps best support the ARV.
Projected returns pro-forma
2.18% appreciation · 3.0% rent growth · sell at horizon
- IRR
- —
- Equity multiple
- 7.39×
- Total profit
- $58,150
- Equity at exit
- $13,129
- IRR
- —
- Equity multiple
- 15.40×
- Total profit
- $131,002
- Equity at exit
- $19,148
Cash invested: $9,100 (down + closing). Projections, not guarantees.
Landlord ↔ Tenant lean methodology
- Overall (STATE)
- 62 Landlord-Friendly
- State Pennsylvania
- 62 Landlord-Friendly · EVEN
- County
- — inherits STATE
- City
- — inherits STATE
ZIP-level market 16301
- Home prices YoY
- 1.0%
- Active inventory
- 53
- Price-to-rent
- 1.9×
Monthly cashflow live
- Estimated rent
- $1,459 medium interval (Pro) →
- Mortgage (P&I)
- −$170
- Tax from tax record
- −$96 /mo · $1,157/yr
- Insurance
- −$14
- HOA
- −$0
- Vacancy / Maint / Mgmt
- −$306
- Net cashflow
- $873
Break-even live
UW: 25.0% down · 7.5% · 30yr · 1.5% tax · 5.0% vac · 8.0% maint · 8.0% mgmt
Financing live
Cash to close
- Down payment
- $8,125
- Closing costs
- $975
- Reserves months
- —
- Total cash needed
- —
Loan-product check · same deal, 3 products live
Conventional
25% down · 7.5% · 30yr
- Down + closing
- —
- Monthly P&I
- —
- Monthly cashflow
- —
- DSCR
- —
- Eligible?
- —
Personal DTI + credit; lowest rate.
DSCR
20% down · 8.5% · 30yr
- Down + closing
- —
- Monthly P&I
- —
- Monthly cashflow
- —
- DSCR
- —
- Eligible?
- —
No personal income docs; deal must DSCR.
Hard money
10% down · 12.0% · 12mo
- Down + closing
- —
- Monthly P&I
- —
- Monthly cashflow
- —
- DSCR
- —
- Eligible?
- —
Short-term bridge; refi at stabilization.
Listing history 3 events
-
2026-06-01days on market $32,500 Active 20 DOM
-
2026-05-31days on market $32,500 Active 19 DOM
-
2026-05-12$32,500 Active 431-char remark
ⓘ Source: listings_history table (triggers on properties + properties_extension) + one-shot
backfill from property_details.listing_events for pre-trigger history.
Tax reassessment forecast PA · Partial reset (capped growth)
- Current annual tax
- $1,157 · $96/mo
- Projected year-2 tax
- $1,157 · $96/mo
- Expected delta
- $0/yr ($0/mo · 0.0%)
ⓘ Screening estimate from a state-policy table — verify with the county assessor before closing.
Climate risk First Street
- Flood 1/10 Low FEMA zone X (unshaded) · 0% chance over 30 yrs
- Wildfire 3/10 Moderate
- Heat 2/10 Low 7 d/yr ≥92°F today · 18 d/yr by 30 yrs out
- Wind 1/10 Low
- Air quality 2/10 Low 1 unhealthy d/yr today · 2 by 30 yrs out
Nearby sold comps map
Loading sold comps map…
Walkable amenities ~0.75 mi
Loading nearby amenities…
Taxation est. · year 1
- Rental income
- $17,513
- − Mortgage interest
- −$1,821
- − Property taxes
- −$1,157
- − Insurance
- −$162
- − Repairs & maintenance
- −$1,401
- − Management
- −$1,401
- − Depreciation
- −$945
- Taxable income
- $10,626
- Est. tax owed @ 24.0%
- −$2,550
- After-tax cash flow
- $7,921/yr
For passive investors: Depreciation is non-cash, so a rental often shows a tax loss while cash-flowing — sheltering income. Rental losses are passive: they offset passive income freely, and up to $25,000/yr can offset ordinary (W-2) income if you actively participate and your MAGI is under $100k (phasing out to $0 by $150k); unused losses carry forward. On sale, claimed depreciation is recaptured at up to 25%, and gains may owe capital-gains tax (a 1031 exchange can defer both). Figures are a year-1 estimate at your 24.0% rate — not tax advice; consult a CPA.
Schools (NCES district)
- District
- Oil City Area SD
- NCES district ID
- 4218090
- Math proficiency
- 20% ▼ -19.00%
- Reading proficiency
- 46% ▼ -10.00%
- Median HH income
- $37,451
- Composite
- 27.39/100
- National rank
- #6973
- State rank
- #436 of 539 in PA
Livability — Oil City
- Score
- 71/100
- State rank
- #704
- US rank
- #6931
Category grades
Schools grade is shown separately in the Schools card above.
Census & demographics
- Census place
- Oil City, PA
- Population (ZIP)
- 15,067
Population outlook (Venango County) Hauer SSP2
- Today (2025)
- 48,827 people
- By 2030
- 46,061 · -5.7%
- By 2040
- 39,989 · -18.1%
- By 2050
- 34,094 · -30.2%
- By 2075
- 22,500 · -53.9%
- By 2100
- 13,659 · -72.0%
Race, ethnicity, and origin ACS 2023
- Neighborhood character
- Predominantly White (93%)
- Race & ethnicity
- White 93% Two or more races 4% Hispanic / Latino 1%
- Common ancestry
- Romanian 7% Iranian 3% Italian 2%
- Foreign-born
- 1%
Political lean MEDSL · Venango
- 2024 margin
- Solid R (+42.1) · D 28.5% · R 70.6%
- 2008→2024 swing
- -22.9pp toward R · 2008: -19.2pp · 2024: -42.1pp
- All cycles
- 2024: R+42.1 2020: R+41.4 2016: R+42.4 2012: R+26.3 2008: R+19.2
Not yet ingested
- Civics
- —
Market trends
- HPI YoY
- ▲ 2.18%
- Current HPI
- 218.0124
- Rent YoY
- —
- Metro
- —
- State GDP YoY
- ▲ 1.68%
- F500 in state
- 34
Industry mix (Fortune 500 HQ in PA)
| Industry | F500 HQs | Revenue |
|---|---|---|
| Healthcare | 2 | $309B |
|
||
| Insurance | 2 | $27B |
|
||
| Telecommunications / Media | 1 | $124B |
|
||
| Industrial Distribution | 1 | $22B |
|
||
| Financial Services | 1 | $20B |
|
||
| Chemicals / Materials | 1 | $18B |
|
||
Price history
2 events — show timeline
- 2026-06-02 Delisted — West Penn MLS
- 2026-05-12 Listed $32,500 West Penn MLS
Property tax history
+1.1%/yrLatest (2026): $1,157 · -1.3% YoY. Source: county tax records.
Cash-flow waterfall
monthlySold comps — $/sqft
last 12 mo · ≤1 miLoading sold comps…