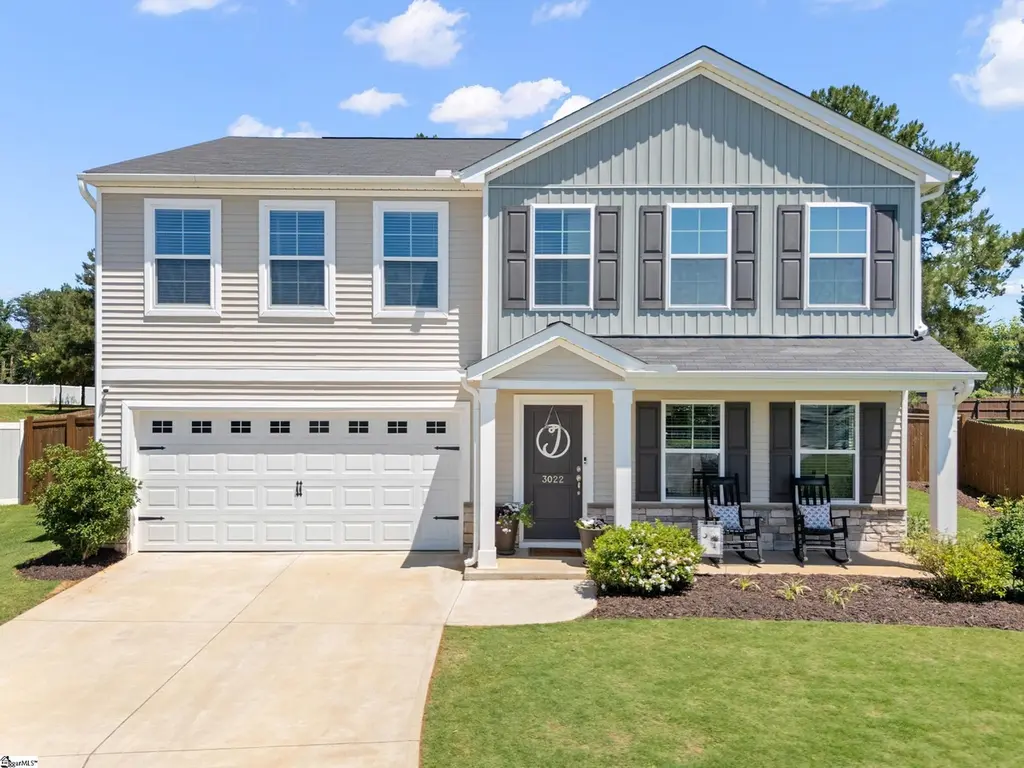
3022 Margaret Ct · Boiling Springs, SC
Flood risk No data
- FEMA flood zone
- —
- Chance of flooding over 30 yrs
- —
- Est. flood insurance / yr
- —
Fire risk No data
- Est. fire insurance / yr
- —
Heat risk No data
- Hot days now (above threshold)
- —
- Hot days in 30 yrs
- —
Wind risk No data
- Chance of severe wind over 30 yrs
- —
Air-quality risk No data
- Unhealthy air days now
- —
- Unhealthy air days in 30 yrs
- —
Risk factors via First Street. Map © Google.
Why this score? — see what drove the F grade
The composite is a weighted blend of 9 inputs, each scored 0–100. Each bar is that input's sub-score; the figure is the points it added to the 100-point composite (weight × sub-score).
- Schools +4.5/10.0
- Cash flow +4.4/30.0
- Livability +3.9/5.0
- ARV discount +3.2/15.0
- Rent growth +2.5/5.0
- Condition / age +2.5/5.0
- 1% rule +0.0/10.0
- DSCR +0.0/10.0
- Appreciation +0.0/10.0
$362,500
🖨 Deal sheet (PDF) 📄 Offer letter ✓ Due diligence
Listing remarks MLS
This beautiful McDowell comes with an open floor plan, 4 bedrooms and 2.5 bathrooms. Immediately inside the entryway, the family room leads into the kitchen and eating area. The kitchen has granite countertops and upgraded cabinets. There is a bonus room on the main floor perfect for a office, playroom or den. The four bedroom and two-and-one-half bathroom home is spacious with all bedrooms upstairs as well as the laundry room and loft. The Primary bedroom has a generous walk-in closet and a full bath with dual sinks, and 5' shower. The loft area opens to the other bedrooms and creates a nice lounging area, teen space, gym, or game room. The covered porch leads out over the large backyard. Maggie Acres offers charming new homes on half acre plus homesites all nestled in a tranquil country setting. Easy access to I-26 and I-85 and less than 10 minutes to Downtown Spartanburg!! Close to all the amenities Boiling Springs has to offer - Lake Bowen, Shopping, Parks, Restaurants and the coming in Spring, Publix!!
Key facts
- Quiet cul-de-sac lot
- Fully fenced
- Level outdoor space
Tags
Property features AI
Finance
- HOA & community: Homeowners association present; HOA maintains street lights; Community common areas and lighting
Exterior
- Parking: Attached 2-car garage with door opener and keypad entry; Paved concrete driveway
- Security: Owned security system; Smoke detectors
- Utilities: Public water; Septic sewer; Private garbage pickup; Electric power
- Home design: Two-story residential home; Built in 2023 (1-5 years old); Located on a cul-de-sac
- Construction: Composition shingle roof; Slab foundation; Partial brick veneer and vinyl siding
- Exterior features: Covered back porch; Front porch; Patio; Tilt-out windows; Partial brick veneer with vinyl siding; Vinyl/aluminum trim; Fenced yard; Level lot with some trees; Underground utilities
Interior
- Kitchen: Dishwasher; Disposal; Electric self-cleaning oven; Electric stand-alone smooth-top range; Built-in microwave; Walk-in pantry
- Bedrooms: Primary bedroom on 2nd level with double sink, separate shower and tub (garden), and walk-in closet; Main level includes 1 bedroom; Primary bedroom approx. 18 x 13; Second bedroom approx. 13 x 11; Third bedroom approx. 11 x 11; Fourth bedroom approx. 10 x 11
- Flooring: Carpet; Ceramic tile; Luxury vinyl tile/plank
- Bathrooms: 2 full bathrooms; 1 half bathroom
- Heating & cooling: Electric forced air heating; Central forced electric cooling; Electric water heater
- Interior features: Attic with disappearing stairs; Cable available; Ceiling fans; Smooth ceilings; Open floor plan; Granite and quartz countertops; Walk-in pantry; Security system (owned); Smoke detectors; Some window treatments; Garden tub; Walk-in closet
- Laundry & utility: Laundry on 2nd floor with washer connection and electric dryer hookup; Washer and dryer included
Neighborhood map
What this means for you Summary
Snapshot
- This is a 5-bed/2.5-bath single-family listed at $362k.
Deal economics
- At list price, monthly cash flow is $-958 ($-11k/yr) — negative.
- To cash-flow at today's rent, offer at most $193k (46.7% below list).
- To meet the 1% rule (rent ≥ 1% of price), the offer needs to be $166k (54.3% below list).
- Recommended offer: $166k (54.3% below list) — sets the bar for 1% rule.
Location & tenants
- Location reads 78/100 on livability (#17 in SC, #2,429 nationally) — a middle-class / working-renter tenant base. Strengths: cost of living A+, housing A+, health & safety A+; Watch: commute F.
- Spartanburg 02 (suburban): math 49% / reading 56% proficiency, ranked #6 of 80 in SC (top 8%) — acceptable for families but not a draw, mixed tenant base, ~2y average lease.
- Zoned schools: Carlisle-Foster'S Grove Elementary (math 72% / reading 57%, grade B, #56 of 597 statewide, top 10%, 572 students, 66% FRL) — zoned schools average 66% FRL vs 44% district-wide (22 pts higher); higher-poverty schools than district average — tighter screening recommended.
- Zoned-school proficiency averages 64% at this address vs 52% district-wide (+12 pts) — the actual schools serving this property are materially stronger than the Spartanburg 02 average implies; a family-tenant draw the district grade alone would hide.
- Market conditions: 308 active listings in the ZIP; 3,129 units permitted in Spartanburg County in 2024 (40 in 5+ unit buildings).
Forward outlook
- Local home prices are declining (-3.0%/yr); year-one equity from $3k of loan paydown is wiped out by about $11k of value loss. Plan a longer hold.
- Spartanburg County population projected at +18% by 2050 — long-run rental-demand tailwind backs the buy-and-hold thesis.
Negotiation context
- It's been on market 17 days — a 2% lower offer ($357k) is reasonable based on typical stale-listing flexibility.
- 2 sale attempts since 3y ago with the ask held roughly flat each time — persistent listings suggest the price (not the market) is what's stuck; bring a comps-based counter.
Questions for the listing agent
- What do current leases actually rent for vs. the listed asking? Can we see a recent rent roll and the last 12 months of T-12 income?
- What does the HOA fee cover, when was the last increase, and are there any pending special assessments or reserve-fund shortfalls?
- Is there a deadline driving the sale (1031 exchange, divorce, estate, relocation)? That informs how much negotiation room exists.
- Schools are B-rated — typically a magnet for longer-tenancy family renters. What's the average tenant stay here, and is there a school-zone premium baked into asking?
- The area grade is low — what's the realistic commute time and amenity access for the typical tenant pool here? Any planned neighborhood developments (good or bad) we should know about?
- What's the average days-on-market for RENTAL listings here right now (not sales)? A rising rental-DOM trend means longer vacancies and softer asking-rent achievability than the comps imply.
- What's the recent tenant-quality profile in this submarket — average credit score on applications, eviction rate, late-payment / NSF rate, and stable-employment percentage? A property-management company in the area should have these aggregated.
- How much new for-sale + rental construction is in the pipeline within 1–3 miles? Heavy new supply typically softens prices + rents 12–24 months out; constrained supply supports both.
Investment metrics
- 1% rule
- 0.46% ✗
- Cap rate
- 3.12%
- Cash-on-cash
- -11.32%
- DSCR
- 0.50
- GRM
- 18.2
CMA / ARV
- ARV (on-the-fly)
- $330,904
- Comps found
- 12
Show comp detail 12 sales within ~0.75 mi
| Address | Dist | Beds/Ba | Sqft | Sold | Price | $/sf | Match |
|---|---|---|---|---|---|---|---|
| 2019 Maggie Acres Rd | 0.16mi | 5/2.5 | 2,320 (+7%) | 11mo | $339,000 | $146 | 73 |
| 7239 Clemie Ct | 0.36mi | 4/2.5 (-1) | 2,299 (+6%) | 2mo | $334,900 | $146 | 68 |
| 309 Saddlers Run | 0.45mi | 4/3.0 (-1) | 2,227 (+2%) | 1mo | $415,000 | $186 | 67 |
| 2003 Maggie Acres Rd | 0.14mi | 4/2.0 (-1) | 2,095 (-4%) | 16mo | $309,000 | $147 | 67 |
| 2128 Maggie Acres Rd Lot 33 | 0.19mi | 4/2.5 (-1) | 2,236 (+3%) | 20mo | $339,000 | $152 | 65 |
| 331 Saddlers Run | 0.42mi | 4/2.0 (-1) | 2,100 (-4%) | 6mo | $382,000 | $182 | 63 |
| 2111 Maggie Acres Rd Lot 25 | 0.19mi | 4/3.0 (-1) | 2,095 (-4%) | 18mo | $316,500 | $151 | 63 |
| 2003 Maggie Acres Rd Lot 1 | 0.11mi | 4/2.0 (-1) | 2,017 (-7%) | 16mo | $309,000 | $153 | 62 |
| 2119 Maggie Acres Rd | 0.32mi | 4/3.0 (-1) | 2,095 (-4%) | 13mo | $326,000 | $156 | 61 |
| 2128 Maggie Acres | 0.29mi | 4/2.5 (-1) | 2,236 (+3%) | 20mo | $339,000 | $152 | 61 |
| 2111 Maggie Acres Rd | 0.28mi | 4/3.0 (-1) | 2,095 (-4%) | 18mo | $316,500 | $151 | 58 |
| 9035 Germaine Ct | 0.43mi | 4/2.5 (-1) | 2,431 (+12%) | 3mo | $330,000 | $136 | 53 |
Match score weights: distance 35% · size 25% · config 20% · recency 20%. Top-matched comps best support the ARV.
Projected returns pro-forma
-3.0% appreciation · 3.0% rent growth · sell at horizon
- IRR
- -37.1%
- Equity multiple
- -0.18×
- Total profit
- $-119,857
- Equity at exit
- $54,050
- IRR
- -53.6%
- Equity multiple
- -0.81×
- Total profit
- $-183,404
- Equity at exit
- $31,342
Cash invested: $101,500 (down + closing). Projections, not guarantees.
Landlord ↔ Tenant lean methodology
- Overall (STATE)
- 90 Strongly Landlord-Friendly
- State South Carolina
- 90 Strongly Landlord-Friendly · R+6
- County
- — inherits STATE
- City
- — inherits STATE
ZIP-level market 29323
- Home prices YoY
- -8.0%
- Active inventory
- 308
- Price-to-rent
- 18.2×
Monthly cashflow live
- Estimated rent
- $1,656 medium interval (Pro) →
- Mortgage (P&I)
- −$1,901
- Tax from tax record
- −$186 /mo · $2,231/yr
- Insurance
- −$151
- HOA
- −$28
- Vacancy / Maint / Mgmt
- −$348
- Net cashflow
- $-958
Break-even live
Sensitivity live
| Price | -10% $-752 | -5% $-855 | +0% $-958 | +5% $-1,060 | +10% $-1,163 |
|---|---|---|---|---|---|
| Rent | -10% $-1,088 | -5% $-1,023 | +0% $-958 | +5% $-892 | +10% $-827 |
| Rate | -1.0pp $-775 | -0.5pp $-865 | base $-958 | +0.5pp $-1,052 | +1.0pp $-1,147 |
UW: 25.0% down · 7.5% · 30yr · 1.5% tax · 5.0% vac · 8.0% maint · 8.0% mgmt
Financing live
Cash to close
- Down payment
- $90,625
- Closing costs
- $10,875
- Reserves months
- —
- Total cash needed
- —
Loan-product check · same deal, 3 products live
Conventional
25% down · 7.5% · 30yr
- Down + closing
- —
- Monthly P&I
- —
- Monthly cashflow
- —
- DSCR
- —
- Eligible?
- —
Personal DTI + credit; lowest rate.
DSCR
20% down · 8.5% · 30yr
- Down + closing
- —
- Monthly P&I
- —
- Monthly cashflow
- —
- DSCR
- —
- Eligible?
- —
No personal income docs; deal must DSCR.
Hard money
10% down · 12.0% · 12mo
- Down + closing
- —
- Monthly P&I
- —
- Monthly cashflow
- —
- DSCR
- —
- Eligible?
- —
Short-term bridge; refi at stabilization.
HOA detail
- Monthly dues
- $28 · $336/yr
- Likely covers
- gym
Listing history 13 events
-
2026-06-21days on market $362,500 Active 17 DOM
-
2026-06-18days on market $362,500 Active 14 DOM
-
2026-06-17days on market $362,500 Active 13 DOM
-
2026-06-16days on market $362,500 Active 12 DOM
-
2026-06-15days on market $362,500 Active 11 DOM
-
2026-06-14days on market $362,500 Active 9 DOM
-
2026-06-13days on market $362,500 Active 8 DOM
-
2026-06-10days on market $362,500 Active 6 DOM
-
2026-06-09days on market $362,500 Active 5 DOM
-
2026-06-08days on market $362,500 Active 4 DOM
-
2026-06-07days on market $362,500 Active 3 DOM
-
2026-06-05remarks 699-char remark
-
2026-06-05$362,500 Active 1 DOM
ⓘ Source: listings_history table (triggers on properties + properties_extension) + one-shot
backfill from property_details.listing_events for pre-trigger history.
Tax reassessment forecast SC · Resets to sale price
- Current annual tax
- $2,231 · $186/mo
- Projected year-2 tax
- $2,231 · $186/mo
- Expected delta
- $0/yr ($0/mo · 0.0%)
ⓘ Screening estimate from a state-policy table — verify with the county assessor before closing.
Nearby sold comps map
Loading sold comps map…
Walkable amenities ~0.75 mi
Loading nearby amenities…
Taxation est. · year 1
- Rental income
- $19,872
- − Mortgage interest
- −$20,306
- − Property taxes
- −$2,231
- − Insurance
- −$1,812
- − Repairs & maintenance
- −$1,590
- − Management
- −$1,590
- − HOA
- −$336
- − Depreciation
- −$10,545
- Taxable loss
- −$18,538
- Est. tax savings @ 24.0%
- +$4,449
- After-tax cash flow
- $-7,043/yr
For passive investors: Depreciation is non-cash, so a rental often shows a tax loss while cash-flowing — sheltering income. Rental losses are passive: they offset passive income freely, and up to $25,000/yr can offset ordinary (W-2) income if you actively participate and your MAGI is under $100k (phasing out to $0 by $150k); unused losses carry forward. On sale, claimed depreciation is recaptured at up to 25%, and gains may owe capital-gains tax (a 1031 exchange can defer both). Figures are a year-1 estimate at your 24.0% rate — not tax advice; consult a CPA.
Schools (NCES district)
- District
- Spartanburg 02
- NCES district ID
- 4503510
- Math proficiency
- 49% ▼ -7.00%
- Reading proficiency
- 56% ▲ 2.00%
- Median HH income
- $49,591
- Composite
- 44.79/100
- National rank
- #2742
- State rank
- #6 of 80 in SC
Livability — Boiling Springs
- Score
- 78/100
- State rank
- #17
- US rank
- #2429
Category grades
Schools grade is shown separately in the Schools card above.
Census & demographics
- City population
- 33,104
- Population (ZIP)
- 15,087
Population outlook (Spartanburg County) Hauer SSP2
- Today (2025)
- 325,495 people
- By 2030
- 338,800 · +4.1%
- By 2040
- 363,471 · +11.7%
- By 2050
- 384,156 · +18.0%
- By 2075
- 430,137 · +32.1%
- By 2100
- 442,733 · +36.0%
Race, ethnicity, and origin ACS 2023
- Neighborhood character
- Predominantly White (82%)
- Race & ethnicity
- White 82% Hispanic / Latino 7% Black 5% Two or more races 4% Asian 3%
- Hispanic origin (detail)
- Mexican 6%
- Common ancestry
- Slovak 4% Romanian 2% Serbian 2%
- Foreign-born
- 6% · Canada, Jamaica
- Languages at home
- 90% English-only · Spanish 5% Russian/Polish/Slavic 3% Other Asian/Pacific 2%
Political lean MEDSL · Spartanburg
- 2024 margin
- Solid R (+33.6) · D 32.6% · R 66.2% · Other 1.2%
- 2008→2024 swing
- -12.0pp toward R · 2008: -21.6pp · 2024: -33.6pp
- All cycles
- 2024: R+33.6 2020: R+27.3 2016: R+30.0 2012: R+23.1 2008: R+21.6
Not yet ingested
- Civics
- —
Market trends
- HPI YoY
- ▼ -25.81%
- Current HPI
- 297.6589
- Rent YoY
- —
- Metro
- —
- State GDP YoY
- ▲ 4.51%
- F500 in state
- 2
Industry mix (Fortune 500 HQ in SC)
| Industry | F500 HQs | Revenue |
|---|---|---|
| Packaging | 1 | $7B |
|
||
Price history
+7.8% since first listed5 events — show timeline
- 2026-06-04 Listed $362,500 Greater Greenville MLS
- 2023-06-01 Sold (MLS) $320,000 SPMLS
- 2023-05-11 Pending — SPMLS
- 2023-04-14 Price Changed $327,000 SPMLS
- 2023-03-05 Listed $336,351 SPMLS
Property tax history
+152.0%/yrLatest (2025): $2,231 · +0.5% YoY. Source: county tax records.
Cash-flow waterfall
monthlySold comps — $/sqft
last 12 mo · ≤1 miLoading sold comps…