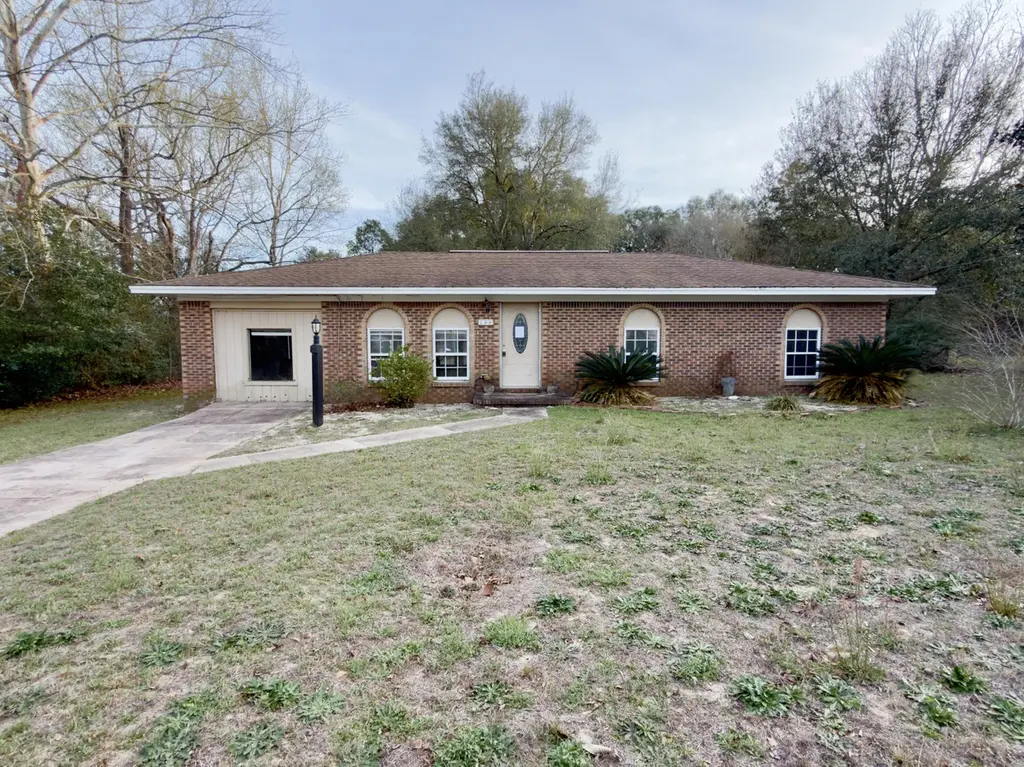
208 Forrest Pkwy · Crestview, FL
Flood risk 1/10 · Minimal
- FEMA flood zone
- X (unshaded)
- Chance of flooding over 30 yrs
- 0.0%
- Est. flood insurance / yr
- $507 – $1,088
Fire risk 4/10 · Minor
- Est. fire insurance / yr
- $947 – $1,759
Heat risk 9/10 · Severe
- Hot days now (above 107°F)
- 7 days/yr
- Hot days in 30 yrs
- 19 days/yr
Wind risk 9/10 · Severe
- Chance of severe wind over 30 yrs
- 99.0%
Air-quality risk 2/10 · Minimal
- Unhealthy air days now
- 1 days/yr
- Unhealthy air days in 30 yrs
- 1 days/yr
Risk factors via First Street. Map © Google.
Why this score? — see what drove the C+ grade
The composite is a weighted blend of 9 inputs, each scored 0–100. Each bar is that input's sub-score; the figure is the points it added to the 100-point composite (weight × sub-score).
- Cash flow +22.2/30.0
- ARV discount +15.0/15.0
- DSCR +7.1/10.0
- Schools +5.2/10.0
- 1% rule +5.1/10.0
- Livability +3.8/5.0
- Rent growth +2.5/5.0
- Condition / age +2.5/5.0
- Appreciation +0.0/10.0
$179,900
🖨 Deal sheet 📄 Offer letter ✓ Due diligence
Listing remarks MLS
Your next REO opportunity awaits! This all brick was built in 1975 home and is located between Hwy 90 and Airport Rd. Just a few miles from schools, grocery, churches and more, this 3-bedroom, 1-bathroom home has an open Kitchen-Living room layout, bonus room and an indoor laundry room. The entire property has chain-link fence, and comes with a huge detached workshop. Whether you're looking for a rental addition, a fix-and-flip, or starter home this property is one to add to the list.
Key facts
- Chain-link fence
- Bonus room
- Indoor laundry room
Tags
Neighborhood map
What this means for you Summary
Snapshot
- This is a 3-bed/1.0-bath single-family listed at $180k.
Deal economics
- At list price, monthly cash flow is $294 ($4k/yr) — positive.
- The deal already cash-flows at list — no discount required.
- Meets the 1% rule at list price ($2k rent vs $180k).
- Recommended offer: $164k (9.0% below list) — sets the bar for market timing.
- Cap rate 8.3% vs local median 4.4% in Crestview — top-decile yield for the area; either an underpriced asset or a hidden risk that comps aren't pricing in. Stress-test before assuming the spread holds.
Location & tenants
- Location reads 75/100 on livability (#252 in FL, #3,858 nationally) — a middle-class / working-renter tenant base. Strengths: cost of living A+, housing A+, health & safety A+; Watch: employment D, amenities F, commute F.
- Okaloosa (other): math 60% / reading 60% proficiency, ranked #12 of 73 in FL (top 16%) — acceptable for families but not a draw, mixed tenant base, ~2y average lease.
- Market conditions: Rents flat; 521 active listings in the ZIP; 14 comparable units currently listed for rent nearby; rentals lingering (median 44d on market — plan ~5-8 weeks vacancy on turnover, expect pricing pressure); 57% of comp listings sitting > 30 days — soft ceiling on asking rent; 1,268 units permitted in Okaloosa County in 2024 (175 in 5+ unit buildings).
Forward outlook
- Local home prices are declining (-3.0%/yr); year-one equity from $1k of loan paydown is wiped out by about $5k of value loss. Plan a longer hold.
- Okaloosa County population projected at +37% by 2050 — long-run rental-demand tailwind backs the buy-and-hold thesis.
Negotiation context
- It's been on market 109 days — a 9% lower offer ($164k) is reasonable based on typical stale-listing flexibility.
- 11 sale attempts since 26y ago with the ask held roughly flat each time — persistent listings suggest the price (not the market) is what's stuck; bring a comps-based counter.
Risks & watch-outs
- Climate carrying-cost: severe wind risk, 99% chance of damaging wind over 30y; extreme-heat days projected 7→19/yr by 2055 (HVAC capex compounding) — expect insurance premiums to compound above CPI over the hold.
Questions for the listing agent
- It's been on market 109 days. Have you received any prior offers? Is the seller open to a 9% concession, seller financing, or rate buy-down credit?
- Built in 1975 — when were the roof, HVAC, electrical panel, plumbing, and water heater last replaced?
- Why hasn't it sold? Are there any deal-killer items the seller is aware of (foundation, flood, title, zoning, code violations)?
- Is there a deadline driving the sale (1031 exchange, divorce, estate, relocation)? That informs how much negotiation room exists.
- Schools are B-rated — typically a magnet for longer-tenancy family renters. What's the average tenant stay here, and is there a school-zone premium baked into asking?
- What's the average days-on-market for RENTAL listings here right now (not sales)? A rising rental-DOM trend means longer vacancies and softer asking-rent achievability than the comps imply.
- What's the recent tenant-quality profile in this submarket — average credit score on applications, eviction rate, late-payment / NSF rate, and stable-employment percentage? A property-management company in the area should have these aggregated.
- How much new for-sale + rental construction is in the pipeline within 1–3 miles? Heavy new supply typically softens prices + rents 12–24 months out; constrained supply supports both.
Investment metrics
- 1% rule
- 1.01% ✓
- Cap rate
- 8.25%
- Cash-on-cash
- 7.01%
- DSCR
- 1.31
- GRM
- 8.2
CMA / ARV
- ARV (median comp)
- $249,825
- List price
- $179,900
- Delta
- -27.99%
- Verdict
- UNDERPRICED
- Comps
- 20 within 1.0 mi
Show comp detail 12 sales within ~0.75 mi
| Address | Dist | Beds/Ba | Sqft | Sold | Price | $/sf | Match |
|---|---|---|---|---|---|---|---|
| 149 4Th Ave | 0.54mi | 3/1.0 | 1,443 (+1%) | 13mo | $137,500 | $95 | 62 |
| 1126 Farmer St | 0.56mi | 3/2.0 | 1,327 (-7%) | 3mo | $220,000 | $166 | 55 |
| 960 Valley Rd | 0.72mi | 3/2.0 | 1,407 (-2%) | 8mo | $227,000 | $161 | 53 |
| 104 Eagle Ct | 0.66mi | 4/2.0 (+1) | 1,500 (+5%) | 4mo | $223,000 | $149 | 48 |
| 2893 Pansy Ave | 0.67mi | 2/2.0 (-1) | 1,376 (-4%) | 8mo | $187,500 | $136 | 47 |
| 1204 Sunshine Dr | 0.32mi | 4/2.0 (+1) | 1,563 (+9%) | 18mo | $301,502 | $193 | 46 |
| 2905 Oaklane St | 0.45mi | 4/2.0 (+1) | 1,563 (+9%) | 15mo | $299,900 | $192 | 42 |
| 1091 Farmer St | 0.64mi | 3/2.0 | 1,299 (-9%) | 12mo | $235,000 | $181 | 41 |
| 2891 Azalea Ave | 0.73mi | 3/2.0 | 1,336 (-7%) | 14mo | $269,900 | $202 | 40 |
| 2940 Mccarty Ave | 0.71mi | 3/2.0 | 1,277 (-11%) | 9mo | $272,900 | $214 | 38 |
| 2938 Mccarty Ave | 0.69mi | 3/2.0 | 1,277 (-11%) | 15mo | $277,000 | $217 | 34 |
| 2934 Mccarty Rd | 0.70mi | 3/2.0 | 1,272 (-11%) | 18mo | $279,000 | $219 | 30 |
Match score weights: distance 35% · size 25% · config 20% · recency 20%. Top-matched comps best support the ARV.
Projected returns pro-forma
-3.0% appreciation · 0.12% rent growth · sell at horizon
- IRR
- -8.7%
- Equity multiple
- 0.69×
- Total profit
- $-15,577
- Equity at exit
- $26,824
- IRR
- -3.2%
- Equity multiple
- 0.81×
- Total profit
- $-9,425
- Equity at exit
- $15,554
Cash invested: $50,372 (down + closing). Projections, not guarantees.
Landlord ↔ Tenant lean methodology
- Overall (STATE)
- 87 Strongly Landlord-Friendly
- State Florida
- 87 Strongly Landlord-Friendly · R+3
- County
- — inherits STATE
- City
- — inherits STATE
ZIP-level market 32539
- Home prices YoY
- -17.8%
- Rents YoY
- 0.1%
- Active inventory
- 521
- Price-to-rent
- 8.2×
Monthly cashflow live
- Estimated rent
- $1,818 high interval (Pro) →
- Mortgage (P&I)
- −$943
- Tax from tax record
- −$124 /mo · $1,486/yr
- Insurance
- −$75
- HOA
- −$0
- Vacancy / Maint / Mgmt
- −$382
- Net cashflow
- $294
Break-even live
UW: 25.0% down · 7.5% · 30yr · 1.5% tax · 5.0% vac · 8.0% maint · 8.0% mgmt
Financing live
Cash to close
- Down payment
- $44,975
- Closing costs
- $5,397
- Reserves months
- —
- Total cash needed
- —
Loan-product check · same deal, 3 products live
Conventional
25% down · 7.5% · 30yr
- Down + closing
- —
- Monthly P&I
- —
- Monthly cashflow
- —
- DSCR
- —
- Eligible?
- —
Personal DTI + credit; lowest rate.
DSCR
20% down · 8.5% · 30yr
- Down + closing
- —
- Monthly P&I
- —
- Monthly cashflow
- —
- DSCR
- —
- Eligible?
- —
No personal income docs; deal must DSCR.
Hard money
10% down · 12.0% · 12mo
- Down + closing
- —
- Monthly P&I
- —
- Monthly cashflow
- —
- DSCR
- —
- Eligible?
- —
Short-term bridge; refi at stabilization.
Rent comps 14 comps
| Address | Beds | Baths | Sqft | Rent | $/sqft | DOM | Units | Dist |
|---|---|---|---|---|---|---|---|---|
| 2942 Sholtz Ave Crestview, FL | 3.0 | 2.0 | 1266 | $1,600 | $1.26 | 44d | 1 | 0.60mi |
| 815 Valley Rd Crestview, FL | 3.0 | 2.5 | 1373 | $1,550 | $1.13 | 44d | 1 | 0.86mi |
| 502 Hyde Park Dr Crestview, FL | 3.0 | 2.0 | 1302 | $1,795 | $1.38 | 14d | 1 | 0.87mi |
| 311 Dahlquist Dr Crestview, FL | 4.0 | 2.5 | 1770 | $2,050 | $1.16 | 21d | 1 | 1.04mi |
| 149 Shady Ln Crestview, FL | 3.0 | 2.0 | 1680 | $2,000 | $1.19 | 44d | 1 | 1.05mi |
| 507 Eisenhower Dr Crestview, FL | 3.0 | 2.0 | 1809 | $2,200 | $1.22 | 44d | 1 | 1.13mi |
| 304 Strawbridge Dr Crestview, FL | 4.0 | 2.0 | 1650 | $1,850 | $1.12 | 14d | 1 | 1.23mi |
| 6260 Old Bethel Rd Crestview, FL | 1.0–3.0 | 1.0–2.0 | 1253 | $2,295 | $1.83 | 14d | 66 | 1.27mi |
| 205 Powell Dr Crestview, FL | 3.0 | 1.5 | 1008 | $1,400 | $1.39 | 44d | 1 | 1.31mi |
| 107 Hampton Dr Crestview, FL | 2.0 | 1.5 | 972 | $1,300 | $1.34 | 21d | 1 | 1.45mi |
| 124 Hampton Dr Unit 1 Crestview, FL | 2.0 | 1.5 | 952 | $1,195 | $1.26 | 44d | 1 | 1.48mi |
| 122 Hampton Dr Crestview, FL | 2.0 | 1.5 | 1080 | $1,195 | $1.11 | 44d | 1 | 1.49mi |
| 122 Hampton Dr Unit 1 Crestview, FL | 2.0 | 2.0 | 1080 | $1,195 | $1.11 | 44d | 1 | 1.49mi |
| 124 Hampton Dr Crestview, FL | 2.0 | 1.5 | 952 | $1,195 | $1.26 | 21d | 1 | 1.49mi |
Listing history 42 events
-
2026-06-18days on market $179,900 Active 109 DOM
-
2026-06-17days on market $179,900 Active 108 DOM
-
2026-06-16days on market $179,900 Active 107 DOM
-
2026-06-15days on market $179,900 Active 106 DOM
-
2026-06-14days on market $179,900 Active 104 DOM
-
2026-06-13days on market $179,900 Active 103 DOM
-
2026-06-10days on market $179,900 Active 101 DOM
-
2026-06-09days on market $179,900 Active 100 DOM
-
2026-06-08days on market $179,900 Active 99 DOM
-
2026-06-07days on market $179,900 Active 98 DOM
-
2026-06-05days on market $179,900 Active 95 DOM
-
2026-06-02days on market $179,900 Active 93 DOM
-
2026-06-01days on market $179,900 Active 92 DOM
-
2026-05-31days on market $179,900 Active 91 DOM
-
2026-05-30days on market $179,900 Active 90 DOM
-
2026-02-28$179,900 Active 490-char remark
Show marketing remark (490 chars)
Your next REO opportunity awaits! This all brick was built in 1975 home and is located between Hwy 90 and Airport Rd. Just a few miles from schools, grocery, churches and more, this 3-bedroom, 1-bathroom home has an open Kitchen-Living room layout, bonus room and an indoor laundry room. The entire property has chain-link fence, and comes with a huge detached workshop. Whether you're looking for a rental addition, a fix-and-flip, or starter home this property is one to add to the list.
-
2025-05-02historical $1,875
-
2024-11-14$1,875
-
2024-09-12status Active
-
2024-08-28status Pending
-
2024-08-26status Active
-
2024-07-31status Pending
-
2024-07-08price $225,000
-
2024-06-20price $236,900
-
2024-06-20status Active
-
2024-03-22$225,000 Active
-
2023-10-23price $225,000
-
2023-10-05$235,000 Active
-
2022-03-30soldstatus $220,000
-
2022-03-29soldstatus $220,000
-
2022-03-29soldstatus $220,000 Sold
-
2022-03-01status Pending
-
2022-02-28price $212,000
-
2022-02-16$215,000 Active
-
2022-02-15$212,000
-
2013-11-27soldstatus $82,500
-
2013-11-22soldstatus $82,500
-
2013-11-22soldstatus $82,500
-
2013-08-05$85,900
-
2005-05-17soldstatus $79,900
-
2000-11-09soldstatus $63,900
-
2000-01-07$63,900
ⓘ Source: listings_history table (triggers on properties + properties_extension) + one-shot
backfill from property_details.listing_events for pre-trigger history.
Tax reassessment forecast FL · Resets to sale price
- Current annual tax
- $1,486 · $124/mo
- Projected year-2 tax
- $1,493 · $124/mo
- Expected delta
- +$7/yr (+$1/mo · 0.5%)
ⓘ Screening estimate from a state-policy table — verify with the county assessor before closing.
Climate risk First Street
- Flood 1/10 Low FEMA zone X (unshaded) · 0% chance over 30 yrs
- Wildfire 4/10 Moderate
- Heat 9/10 Extreme 7 d/yr ≥107°F today · 19 d/yr by 30 yrs out
- Wind 9/10 Extreme 99% chance of damaging wind over 30 yrs
- Air quality 2/10 Low 1 unhealthy d/yr today · 1 by 30 yrs out
Nearby sold comps map
Loading sold comps map…
Walkable amenities ~0.75 mi
Loading nearby amenities…
Taxation est. · year 1
- Rental income
- $21,817
- − Mortgage interest
- −$10,077
- − Property taxes
- −$1,486
- − Insurance
- −$900
- − Repairs & maintenance
- −$1,745
- − Management
- −$1,745
- − Depreciation
- −$5,233
- Taxable income
- $630
- Est. tax owed @ 24.0%
- −$151
- After-tax cash flow
- $3,378/yr
For passive investors: Depreciation is non-cash, so a rental often shows a tax loss while cash-flowing — sheltering income. Rental losses are passive: they offset passive income freely, and up to $25,000/yr can offset ordinary (W-2) income if you actively participate and your MAGI is under $100k (phasing out to $0 by $150k); unused losses carry forward. On sale, claimed depreciation is recaptured at up to 25%, and gains may owe capital-gains tax (a 1031 exchange can defer both). Figures are a year-1 estimate at your 24.0% rate — not tax advice; consult a CPA.
Schools (NCES district)
- District
- Okaloosa
- NCES district ID
- 1201380
- Math proficiency
- 60% ▼ -12.00%
- Reading proficiency
- 60% ▼ -4.00%
- Median HH income
- $55,601
- Composite
- 51.62/100
- National rank
- #1705
- State rank
- #12 of 73 in FL
Livability — Crestview
- Score
- 75/100
- State rank
- #252
- US rank
- #3858
Category grades
Schools grade is shown separately in the Schools card above.
Census & demographics
- County
- Okaloosa County · 194,352 people
- City population
- 58,889
- Metro
- Crestview-Fort Walton Beach-Destin, FL
- Population (ZIP)
- 33,290
- Household income
- $74,369
- Rent vs Own
- Severe rent burden
- 371.0
Population outlook (Okaloosa County) Hauer SSP2
- Today (2025)
- 235,133 people
- By 2030
- 253,483 · +7.8%
- By 2040
- 289,537 · +23.1%
- By 2050
- 322,954 · +37.3%
- By 2075
- 399,624 · +70.0%
- By 2100
- 425,311 · +80.9%
Race, ethnicity, and origin ACS 2023
- Neighborhood character
- Predominantly White (73%)
- Race & ethnicity
- White 73% Black 12% Two or more races 8% Hispanic / Latino 7% Asian 1%
- Hispanic origin (detail)
- Mexican 3% Puerto Rican 2%
- Common ancestry
- Lithuanian 4% Iranian 2% Romanian 2%
- Foreign-born
- 3% · Canada
- Languages at home
- 94% English-only · Spanish 3% Russian/Polish/Slavic 1% Other Asian/Pacific 1%
Political lean MEDSL · Okaloosa
- 2024 margin
- Solid R (+42.4) · D 28.2% · R 70.7% · Other 1.1%
- 2008→2024 swing
- +2.5pp toward D · 2008: -44.9pp · 2024: -42.4pp
- All cycles
- 2024: R+42.4 2020: R+39.1 2016: R+47.8 2012: R+49.4 2008: R+44.9
Not yet ingested
- Civics
- —
Market trends
- HPI YoY
- ▼ -56.52%
- Current HPI
- 261.1557
- Rent YoY
- ▲ 0.12%
- Metro
- Crestview-Fort Walton Beach-Destin, FL
- State GDP YoY
- ▲ 3.28%
- F500 in state
- 36
Industry mix (Fortune 500 HQ in FL)
| Industry | F500 HQs | Revenue |
|---|---|---|
| Industrial Technology | 2 | $29B |
|
||
| Insurance | 2 | $17B |
|
||
| Retail | 1 | $60B |
|
||
| Technology Distribution | 1 | $58B |
|
||
| Homebuilding | 1 | $35B |
|
||
| Technology Manufacturing | 1 | $35B |
|
||
Price history
+181.5% since first listed27 events — show timeline
- 2026-02-28 Listed $179,900 ECAR
- 2025-05-02 Rental Removed $1,875 ECAR
- 2024-11-14 Listed for Rent $1,875 ECAR
- 2024-09-12 Relisted — ECAR
- 2024-08-28 Pending — ECAR
- 2024-08-26 Relisted — ECAR
- 2024-07-31 Pending — ECAR
- 2024-07-08 Price Changed $225,000 ECAR
- 2024-06-20 Price Changed $236,900 ECAR
- 2024-06-20 Relisted — ECAR
- 2024-03-22 Listed $225,000 ECAR
- 2023-10-23 Price Changed $225,000 ECAR
- 2023-10-05 Listed $235,000 ECAR
- 2022-03-30 Sold (Public Records) $220,000 Public Records
- 2022-03-29 Sold (MLS) $220,000 ECAR
- 2022-03-29 Sold (MLS) $220,000 NAMLS
- 2022-03-01 Pending — ECAR
- 2022-02-28 Price Changed $212,000 ECAR
- 2022-02-16 Listed $215,000 ECAR
- 2022-02-15 Listed $212,000 NAMLS
- 2013-11-27 Sold (Public Records) $82,500 Public Records
- 2013-11-22 Sold (MLS) $82,500 NAMLS
- 2013-11-22 Sold (MLS) $82,500 ECAR
- 2013-08-05 Listed $85,900 NAMLS
- 2005-05-17 Sold (Public Records) $79,900 Public Records
- 2000-11-09 Sold (Public Records) $63,900 Public Records
- 2000-01-07 Listed $63,900 ECAR
Property tax history
+9.6%/yrLatest (2025): $1,486 · -2.1% YoY. Source: county tax records.
Cash-flow waterfall
monthlySold comps — $/sqft
last 12 mo · ≤1 miLoading sold comps…