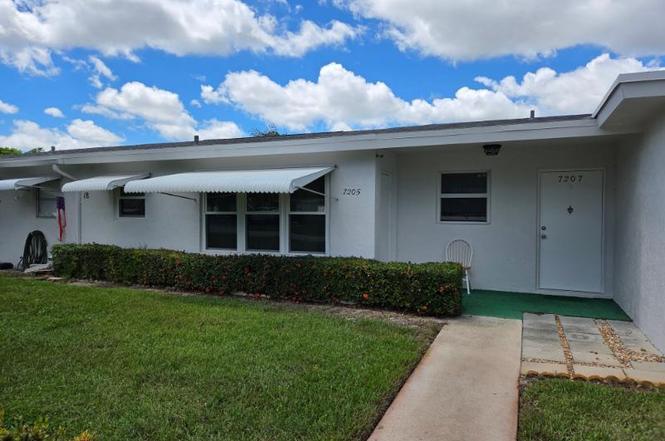
7205 W Oakridge Cir · San Castle, FL
Flood risk 1/10 · Minimal
- FEMA flood zone
- X (unshaded)
- Chance of flooding over 30 yrs
- 0.0%
- Est. flood insurance / yr
- $507 – $1,088
Fire risk 1/10 · Minimal
- Est. fire insurance / yr
- $947 – $1,759
Heat risk 10/10 · Severe
- Hot days now (above 105°F)
- 7 days/yr
- Hot days in 30 yrs
- 28 days/yr
Wind risk 10/10 · Severe
- Chance of severe wind over 30 yrs
- 99.0%
Air-quality risk 2/10 · Minimal
- Unhealthy air days now
- 0 days/yr
- Unhealthy air days in 30 yrs
- 2 days/yr
Risk factors via First Street. Map © Google.
Why this score? — see what drove the B- grade
The composite is a weighted blend of 9 inputs, each scored 0–100. Each bar is that input's sub-score; the figure is the points it added to the 100-point composite (weight × sub-score).
- Cash flow +28.5/30.0
- 1% rule +10.0/10.0
- DSCR +10.0/10.0
- ARV discount +7.5/15.0
- Schools +4.3/10.0
- Rent growth +3.5/5.0
- Livability +3.4/5.0
- Condition / age +2.5/5.0
- Appreciation +0.0/10.0
$143,500
🖨 Deal sheet 📄 Offer letter ✓ Due diligence
Listing remarks MLS
Nicely remodeled large 1/1 with 2008 AC system, 2008 new master bath tile, tub & fixtures, 2008 17'' neutral tile floors in main areas, 2008 interior paint, 2008 tiled kitchen counter tops, smooth top range, dishwasher, sink faucet, microwave and range hood. The community offers a pool, tennis and clubHouse. An unbelievable value!!
Key facts
- Hurricane windows
- Quartz countertops
- Walk-in closets
Tags
Property features AI
Finance
- HOA & community: Monthly HOA $420; HOA includes cable TV, internet, grounds maintenance, trash, common areas, roof repairs; Association amenities: Clubhouse, Shuffleboard court; Senior community
Exterior
- Parking: Assigned parking
- Utilities: Public water; Public sewer; Three-phase electric; Cable available; Water available; Sewer available
- Home design: Condominium; One story; Entry-level living area; Faces east; Resale condition
- Construction: CBS construction
- Exterior features: Covered patio; Patio; Porch; Not waterfront
Interior
- Kitchen: Electric range; Microwave; Dishwasher; Disposal; Refrigerator; Electric water heater
- Bedrooms: 1 main-level bedroom
- Flooring: Laminate flooring
- Bathrooms: 1 full bathroom; 1 half bathroom
- Heating & cooling: Central individual heating; Central individual cooling
- Interior features: Walk-in closet(s); Smoke detector(s)
Neighborhood map
What this means for you Summary
Snapshot
- This is a 1-bed/1.5-bath condo listed at $144k.
Deal economics
- At list price, monthly cash flow is $467 ($6k/yr) — positive.
- The deal already cash-flows at list — no discount required.
- Meets the 1% rule at list price ($2k rent vs $144k).
- Recommended offer: $126k (12.0% below list) — sets the bar for market timing.
Location & tenants
- Location reads 67/100 on livability (#560 in FL) — a middle-class / working-renter tenant base. Strengths: cost of living A+, housing A+, health & safety A; Watch: amenities F, commute F, employment F.
- Palm Beach (suburban): math 46% / reading 53% proficiency, ranked #34 of 73 in FL (top 47%) — families likely to look elsewhere, expect single-tenant / working-renter base with shorter leases.
- Zoned schools: Rolling Green Elementary School (math 21% / reading 26%, grade F, #2,061 of 2,144 statewide, top 96%, 692 students, 88% FRL); Congress Community Middle School (math 21% / reading 28%, grade F, #522 of 571 statewide, top 93%, 988 students, 72% FRL); Boynton Beach Community High (math 13% / reading 25%, grade F, #565 of 667 statewide, top 85%, 1,547 students, 65% FRL) — zoned schools average 75% FRL vs 52% district-wide (23 pts higher); higher-poverty schools than district average — tighter screening recommended.
- Zoned-school proficiency averages 22% at this address vs 50% district-wide (-27 pts) — the specific schools serving this property underperform the Palm Beach average; the district grade overstates school quality for this exact location.
- Market conditions: Rents rising fast (+4.1%/yr); 383 active listings in the ZIP; 40 comparable units currently listed for rent nearby; rentals at typical pace (median 19d on market — plan ~3-4 weeks tenant-placement turnaround); 3,974 units permitted in Palm Beach County in 2024 (1,012 in 5+ unit buildings).
- This rent runs 37% of the median local income ($74k/yr) — at the standard rent-burdened threshold; future hikes will face affordability resistance.
Forward outlook
- Local home prices are declining (-3.0%/yr); year-one equity from $992 of loan paydown is wiped out by about $4k of value loss. Plan a longer hold.
- Palm Beach County population projected at +30% by 2050 — long-run rental-demand tailwind backs the buy-and-hold thesis.
- At projected returns (-3.0% appreciation + 4.1% rent growth), your $40k cash investment doubles in ~8 years — after that, you're playing with house money.
Negotiation context
- It's been on market 286 days — a 12% lower offer ($126k) is reasonable based on typical stale-listing flexibility.
- 3 sale attempts since 17y ago; this cycle's ask has dropped $32k (18%) from the opening price — seller is motivated, your offer sets the floor, not the list.
Risks & watch-outs
- Climate carrying-cost: severe wind risk, 99% chance of damaging wind over 30y; extreme-heat days projected 7→28/yr by 2055 (HVAC capex compounding) — expect insurance premiums to compound above CPI over the hold.
Questions for the listing agent
- It's been on market 286 days. Have you received any prior offers? Is the seller open to a 12% concession, seller financing, or rate buy-down credit?
- Built in 1974 — when were the roof, HVAC, electrical panel, plumbing, and water heater last replaced?
- What does the HOA fee cover, when was the last increase, and are there any pending special assessments or reserve-fund shortfalls?
- Any open or pending special assessments — roof, HVAC, plumbing, elevator, façade? What's the per-unit balance and payoff schedule, and is the seller paying it off at close or rolling it to the buyer?
- Why hasn't it sold? Are there any deal-killer items the seller is aware of (foundation, flood, title, zoning, code violations)?
- Is there a deadline driving the sale (1031 exchange, divorce, estate, relocation)? That informs how much negotiation room exists.
- Schools are D-rated, which usually means shorter tenancies and higher turnover. Who's the typical renter profile here, and what's been the actual vacancy rate?
- What's the average days-on-market for RENTAL listings here right now (not sales)? A rising rental-DOM trend means longer vacancies and softer asking-rent achievability than the comps imply.
- What's the recent tenant-quality profile in this submarket — average credit score on applications, eviction rate, late-payment / NSF rate, and stable-employment percentage? A property-management company in the area should have these aggregated.
- How much new apartment / multifamily construction is in the pipeline within 1–3 miles? Heavy new supply (>2% of stock underway) typically softens rents 12–24 months out; light construction supports rent growth.
Investment metrics
- 1% rule
- 1.58% ✓
- Cap rate
- 10.20%
- Cash-on-cash
- 13.95%
- DSCR
- 1.62
- GRM
- 5.3
CMA / ARV
No comps found within radius.
Projected returns pro-forma
-3.0% appreciation · 4.09% rent growth · sell at horizon
- IRR
- 5.8%
- Equity multiple
- 1.23×
- Total profit
- $9,238
- Equity at exit
- $21,396
- IRR
- 16.5%
- Equity multiple
- 2.44×
- Total profit
- $57,851
- Equity at exit
- $12,407
Cash invested: $40,180 (down + closing). Projections, not guarantees.
Landlord ↔ Tenant lean methodology
- Overall (STATE)
- 87 Strongly Landlord-Friendly
- State Florida
- 87 Strongly Landlord-Friendly · R+3
- County
- — inherits STATE
- City
- — inherits STATE
ZIP-level market 33462
- Rents YoY
- 4.1%
- Active inventory
- 383
- Price-to-rent
- 5.3×
Monthly cashflow live
- Estimated rent
- $2,267 high interval (Pro) →
- Mortgage (P&I)
- −$753
- Tax from tax record
- −$92 /mo · $1,098/yr
- Insurance
- −$60
- HOA
- −$420
- Vacancy / Maint / Mgmt
- −$476
- Net cashflow
- $467
Break-even live
UW: 25.0% down · 7.5% · 30yr · 1.5% tax · 5.0% vac · 8.0% maint · 8.0% mgmt
Financing live
Cash to close
- Down payment
- $35,875
- Closing costs
- $4,305
- Reserves months
- —
- Total cash needed
- —
Loan-product check · same deal, 3 products live
Conventional
25% down · 7.5% · 30yr
- Down + closing
- —
- Monthly P&I
- —
- Monthly cashflow
- —
- DSCR
- —
- Eligible?
- —
Personal DTI + credit; lowest rate.
DSCR
20% down · 8.5% · 30yr
- Down + closing
- —
- Monthly P&I
- —
- Monthly cashflow
- —
- DSCR
- —
- Eligible?
- —
No personal income docs; deal must DSCR.
Hard money
10% down · 12.0% · 12mo
- Down + closing
- —
- Monthly P&I
- —
- Monthly cashflow
- —
- DSCR
- —
- Eligible?
- —
Short-term bridge; refi at stabilization.
Rent comps 40 comps
| Address | Beds | Baths | Sqft | Rent | $/sqft | DOM | Units | Dist |
|---|---|---|---|---|---|---|---|---|
| 1400 S Broadway Lantana, FL | 2.0 | 1.0 | 846 | $1,850 | $2.19 | 24d | 1 | 0.22mi |
| 1400 S Dixie Hwy Lantana, FL | 1.0–3.0 | 1.0–2.0 | 1166 | $2,179 | $1.87 | 3d | 16 | 0.43mi |
| 117 Yacht Club Way #110 Hypoluxo, FL | 2.0 | 2.5 | 1030 | $2,295 | $2.23 | 3d | 1 | 0.44mi |
| 103 Yacht Club Way Hypoluxo, FL | 2.0 | 1.0 | 922 | $2,175 | $2.36 | 7d | 2 | 0.45mi |
| 120 Yacht Club Way #305 Hypoluxo, FL | 2.0 | 2.0 | 1105 | $2,350 | $2.13 | 24d | 1 | 0.47mi |
| 123 Yacht Club Way #206 Hypoluxo, FL | 2.0 | 1.0 | 922 | $2,250 | $2.44 | 24d | 1 | 0.49mi |
| 111 Yacht Club Way Hypoluxo, FL | 2.0 | 2.0 | 1036 | $2,275 | $2.20 | 3d | 2 | 0.49mi |
| 1097 Wilkinson Rd Unit B Lantana, FL | 2.0 | 1.0 | 855 | $2,200 | $2.57 | 2d | 1 | 0.50mi |
| 1097 Wilkinson Rd Unit B Lantana, FL | 2.0 | 1.0 | 855 | $2,200 | $2.57 | 1d | 1 | 0.50mi |
| 110 Half Moon Cir Unit E2 Hypoluxo, FL | 2.0 | 2.0 | 1414 | $2,750 | $1.94 | 24d | 1 | 0.50mi |
| 127 Yacht Club Way #109 Hypoluxo, FL | 2.0 | 2.5 | 1030 | $2,500 | $2.43 | 24d | 1 | 0.51mi |
| 140 Yacht Club Way #206 Hypoluxo, FL | 2.0 | 2.0 | 1036 | $2,450 | $2.36 | 7d | 1 | 0.53mi |
| 135 Yacht Club Way #204 Hypoluxo, FL | 2.0 | 1.0 | 922 | $2,600 | $2.82 | 2d | 1 | 0.54mi |
| 145 Yacht Club Way #112 Hypoluxo, FL | 2.0 | 1.0 | 945 | $2,400 | $2.54 | 24d | 1 | 0.56mi |
| 160 Yacht Club Way #206 Hypoluxo, FL | 2.0 | 2.0 | 1036 | $4,500 | $4.34 | 24d | 1 | 0.56mi |
| 157 Yacht Club Way #206 Hypoluxo, FL | 2.0 | 2.0 | 1036 | $2,500 | $2.41 | 12d | 1 | 0.57mi |
| 157 Yacht Club Way Hypoluxo, FL | 2.0 | 1.0–2.0 | 979 | $2,450 | $2.50 | 2d | 2 | 0.58mi |
| 157 Yacht Club Way Hypoluxo, FL | 2.0 | 1.0–2.0 | 979 | $2,350 | $2.40 | 24d | 2 | 0.58mi |
| 714 S Arnold Ave Unit B Lantana, FL | 2.0 | 1.0 | 858 | $2,200 | $2.56 | 24d | 1 | 0.61mi |
| 531 W Perry St Lantana, FL | 2.0 | 1.0 | 1000 | $2,400 | $2.40 | 18d | 1 | 0.62mi |
| 1202 S Lake Dr #501 Lantana, FL | 2.0 | 2.0 | 1351 | $2,800 | $2.07 | 24d | 1 | 0.62mi |
| 1100 S Lake Dr Unit 09 Lantana, FL | 2.0 | 1.0 | 700 | $1,750 | $2.50 | 24d | 1 | 0.63mi |
| 112 Milton St Unit 114 Lantana, FL | 2.0 | 1.0 | 1245 | $2,500 | $2.01 | 7d | 1 | 0.63mi |
| 112 Milton St Unit 114 Lantana, FL | 2.0 | 1.0 | 1245 | $2,500 | $2.01 | 24d | 1 | 0.63mi |
| 612 W Drew St Lantana, FL | 1.0 | 1.0 | 800 | $1,800 | $2.25 | 11d | 1 | 0.63mi |
| 101 Country Ln Boynton Beach, FL | 1.0 | 1.0 | 1012 | $1,800 | $1.78 | 24d | 1 | 0.63mi |
| 112 Prospect Rd Lantana, FL | 2.0 | 2.0 | 1377 | $2,500 | $1.82 | 16d | 1 | 0.67mi |
| 609 S Arnold Ave Lantana, FL | 2.0 | 2.0 | 1076 | $2,900 | $2.70 | 16d | 1 | 0.68mi |
| 1236 Peak Rd Lantana, FL | 2.0 | 1.0 | 1170 | $2,150 | $1.84 | 24d | 1 | 0.71mi |
| 1000 Scotia Dr #605 Hypoluxo, FL | 2.0 | 1.0 | 901 | $2,190 | $2.43 | 7d | 1 | 0.72mi |
| 611 E Coast Ave Unit 2 Lantana, FL | 2.0 | 2.0 | 1125 | $2,050 | $1.82 | 5d | 1 | 0.73mi |
| 611 E Coast Ave Unit B Lantana, FL | 2.0 | 2.0 | 1125 | $2,100 | $1.87 | 20d | 1 | 0.73mi |
| 605 S 12th St Lantana, FL | 2.0 | 1.0 | 700 | $1,950 | $2.79 | 3d | 1 | 0.74mi |
| 422 S Arnold Ave Lantana, FL | 2.0 | 1.0 | 948 | $2,400 | $2.53 | 20d | 1 | 0.80mi |
| 351 Wickline Blvd Lantana, FL | 2.0 | 1.0 | 832 | $2,300 | $2.76 | 2d | 1 | 0.86mi |
| 349 Wickline Blvd Lantana, FL | 2.0 | 1.0 | 832 | $2,300 | $2.76 | 2d | 1 | 0.87mi |
| 661 Waterside Dr Hypoluxo, FL | 2.0 | 2.0 | 768 | $2,000 | $2.60 | 24d | 1 | 0.88mi |
| 65 Relaxed Cir Hypoluxo, FL | 2.0 | 2.0 | 828 | $2,000 | $2.42 | 7d | 1 | 0.89mi |
| 8076 Ambach Way Hypoluxo, FL | 2.0 | 2.0 | 1243 | $2,200 | $1.77 | 24d | 1 | 0.98mi |
| 369 Waterside Dr Hypoluxo, FL | 2.0 | 2.5 | 1128 | $2,250 | $1.99 | 24d | 1 | 0.99mi |
HOA detail condo
- Monthly dues
- $420 · $5,040/yr
- Likely covers
- pool
- Assessments
- None detected in remarks — confirm with the listing agent.
Listing history 21 events
-
2026-06-18days on market $143,500 Active 286 DOM
-
2026-06-17days on market $143,500 Active 285 DOM
-
2026-06-16days on market $143,500 Active 284 DOM
-
2026-06-15days on market $143,500 Active 283 DOM
-
2026-06-13days on market $143,500 Active 281 DOM
-
2026-06-09days on market $143,500 Active 277 DOM
-
2026-06-07days on market $143,500 Active 275 DOM
-
2026-06-04days on market $143,500 Active 272 DOM
-
2026-06-03days on market $143,500 Active 271 DOM
-
2026-06-01days on market $143,500 Active 269 DOM
-
2026-05-31days on market $143,500 Active 268 DOM
-
2026-01-19price $145,000
-
2025-10-31price $159,500
-
2025-10-15price $169,500
-
2025-10-06price $172,500
-
2025-09-06$175,000 Active
-
2025-09-06historical $175,000
-
2013-03-31historical
-
2012-09-22$39,900
-
2009-03-23historical 339-char remark
Show marketing remark (339 chars)
Nicely remodeled large 1/1 with 2008 AC system, 2008 new master bath tile, tub & fixtures, 2008 17'' neutral tile floors in main areas, 2008 interior paint, 2008 tiled kitchen counter tops, smooth top range, dishwasher, sink faucet, microwave and range hood. The community offers a pool, tennis and clubHouse. An unbelievable value!!
-
2009-01-16$54,900 339-char remark
Show marketing remark (339 chars)
Nicely remodeled large 1/1 with 2008 AC system, 2008 new master bath tile, tub & fixtures, 2008 17'' neutral tile floors in main areas, 2008 interior paint, 2008 tiled kitchen counter tops, smooth top range, dishwasher, sink faucet, microwave and range hood. The community offers a pool, tennis and clubHouse. An unbelievable value!!
ⓘ Source: listings_history table (triggers on properties + properties_extension) + one-shot
backfill from property_details.listing_events for pre-trigger history.
Tax reassessment forecast FL · Resets to sale price
- Current annual tax
- $1,098 · $92/mo
- Projected year-2 tax
- $1,191 · $99/mo
- Expected delta
- +$93/yr (+$8/mo · 8.4%)
ⓘ Screening estimate from a state-policy table — verify with the county assessor before closing.
Climate risk First Street
- Flood 1/10 Low FEMA zone X (unshaded) · 0% chance over 30 yrs
- Wildfire 1/10 Low
- Heat 10/10 Extreme 7 d/yr ≥105°F today · 28 d/yr by 30 yrs out
- Wind 10/10 Extreme 99% chance of damaging wind over 30 yrs
- Air quality 2/10 Low 0 unhealthy d/yr today · 2 by 30 yrs out
Nearby sold comps map
Loading sold comps map…
Walkable amenities ~0.75 mi
Loading nearby amenities…
Taxation est. · year 1
- Rental income
- $27,202
- − Mortgage interest
- −$8,038
- − Property taxes
- −$1,098
- − Insurance
- −$718
- − Repairs & maintenance
- −$2,176
- − Management
- −$2,176
- − HOA
- −$5,040
- − Depreciation
- −$4,175
- Taxable income
- $3,781
- Est. tax owed @ 24.0%
- −$907
- After-tax cash flow
- $4,696/yr
For passive investors: Depreciation is non-cash, so a rental often shows a tax loss while cash-flowing — sheltering income. Rental losses are passive: they offset passive income freely, and up to $25,000/yr can offset ordinary (W-2) income if you actively participate and your MAGI is under $100k (phasing out to $0 by $150k); unused losses carry forward. On sale, claimed depreciation is recaptured at up to 25%, and gains may owe capital-gains tax (a 1031 exchange can defer both). Figures are a year-1 estimate at your 24.0% rate — not tax advice; consult a CPA.
Schools (NCES district)
- District
- Palm Beach
- NCES district ID
- 1201500
- Math proficiency
- 46% ▼ -16.00%
- Reading proficiency
- 53% ▼ -4.00%
- Median HH income
- $53,943
- Composite
- 42.72/100
- National rank
- #3160
- State rank
- #34 of 73 in FL
Livability — San Castle
- Score
- 67/100
- State rank
- #560
- US rank
- #10706
Category grades
Schools grade is shown separately in the Schools card above.
Census & demographics
- Census place
- San Castle, FL
- County
- Palm Beach County · 1,438,312 people
- Metro
- Miami-Fort Lauderdale-Pompano Beach, FL
- Population (ZIP)
- 33,371
- Household income
- $73,997
- Rent vs Own
- Severe rent burden
- 1852.0
Population outlook (Palm Beach County) Hauer SSP2
- Today (2025)
- 1,637,487 people
- By 2030
- 1,743,255 · +6.5%
- By 2040
- 1,948,712 · +19.0%
- By 2050
- 2,132,979 · +30.3%
- By 2075
- 2,530,027 · +54.5%
- By 2100
- 2,706,979 · +65.3%
Race, ethnicity, and origin ACS 2023
- Neighborhood character
- Diverse neighborhood (Simpson 0.68)
- Race & ethnicity
- White 44% Black 26% Hispanic / Latino 26% Two or more races 11% Asian 2%
- Hispanic origin (detail)
- Mexican 8% Puerto Rican 5% Cuban 3%
- Common ancestry
- Hispanic 14% Romanian 2% Scotch-Irish 2%
- Foreign-born
- 31% · Canada, Jamaica, Dominican Republic
- Languages at home
- 60% English-only · Spanish 20% French/Haitian/Cajun 16% Other Indo-European 1%
Political lean MEDSL · Palm Beach
- 2024 margin
- Toss-up / Even · D 50.0% · R 49.2%
- 2008→2024 swing
- -22.1pp toward R · 2008: 22.9pp · 2024: 0.8pp
- All cycles
- 2024: D+0.8 2020: D+12.8 2016: D+15.3 2012: D+17.0 2008: D+22.9
Not yet ingested
- Civics
- —
Market trends
- HPI YoY
- ▼ -295.48%
- Current HPI
- 361.5391
- Rent YoY
- ▲ 4.09%
- Metro
- Miami-Fort Lauderdale-Pompano Beach, FL
- State GDP YoY
- ▲ 3.28%
- F500 in state
- 36
Industry mix (Fortune 500 HQ in FL)
| Industry | F500 HQs | Revenue |
|---|---|---|
| Industrial Technology | 2 | $29B |
|
||
| Insurance | 2 | $17B |
|
||
| Retail | 1 | $60B |
|
||
| Technology Distribution | 1 | $58B |
|
||
| Homebuilding | 1 | $35B |
|
||
| Technology Manufacturing | 1 | $35B |
|
||
Price history
+164.1% since first listed10 events — show timeline
- 2026-01-19 Price Changed $145,000 Beaches MLS
- 2025-10-31 Price Changed $159,500 Beaches MLS
- 2025-10-15 Price Changed $169,500 Beaches MLS
- 2025-10-06 Price Changed $172,500 Beaches MLS
- 2025-09-06 Listed $175,000 Beaches MLS
- 2025-09-06 Coming Soon $175,000 Beaches MLS
- 2013-03-31 Listing Removed — Beaches MLS
- 2012-09-22 Listed $39,900 Beaches MLS
- 2009-03-23 Listing Removed — Beaches MLS
- 2009-01-16 Listed $54,900 Beaches MLS
Property tax history
+7.6%/yrLatest (2025): $1,098 · +4.9% YoY. Source: county tax records.
Cash-flow waterfall
monthlySold comps — $/sqft
last 12 mo · ≤1 miLoading sold comps…