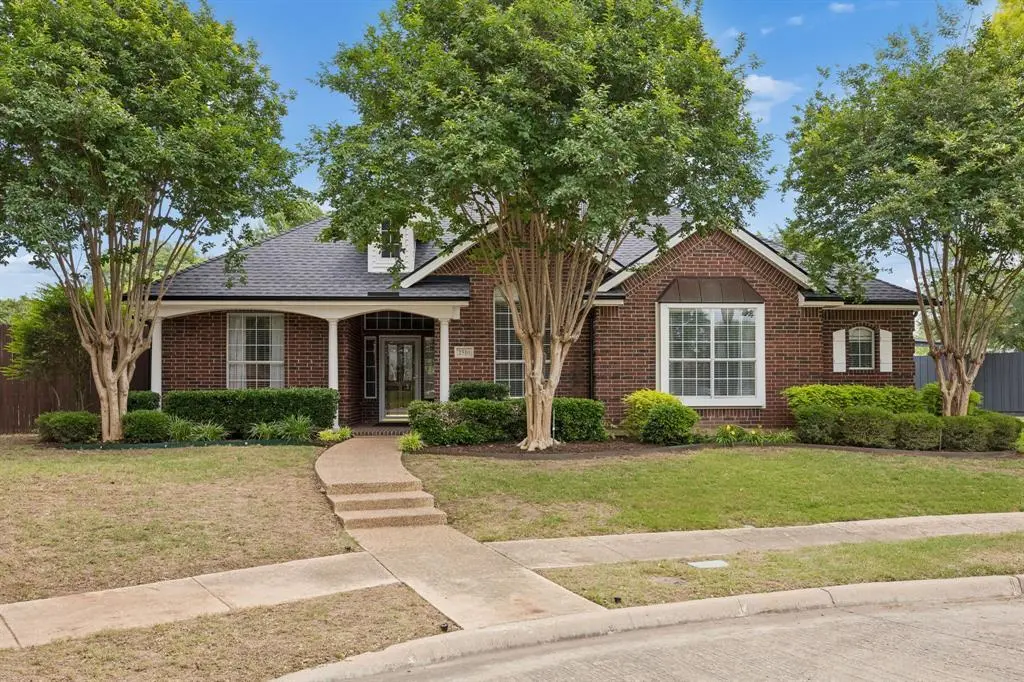
2510 Shorewood Ct · Rowlett, TX
Flood risk 4/10 · Minor
- FEMA flood zone
- X (unshaded)
- Chance of flooding over 30 yrs
- 0.22%
- Est. flood insurance / yr
- $507 – $1,088
Fire risk 3/10 · Minor
- Est. fire insurance / yr
- $1,222 – $2,270
Heat risk 8/10 · Major
- Hot days now (above 110°F)
- 7 days/yr
- Hot days in 30 yrs
- 24 days/yr
Wind risk 6/10 · Moderate
- Chance of severe wind over 30 yrs
- 27.0%
Air-quality risk 2/10 · Minimal
- Unhealthy air days now
- 2 days/yr
- Unhealthy air days in 30 yrs
- 2 days/yr
Risk factors via First Street. Map © Google.
Why this score? — see what drove the C+ grade
The composite is a weighted blend of 9 inputs, each scored 0–100. Each bar is that input's sub-score; the figure is the points it added to the 100-point composite (weight × sub-score).
- Cash flow +28.2/30.0
- DSCR +10.0/10.0
- 1% rule +8.6/10.0
- Livability +3.8/5.0
- Schools +2.9/10.0
- Condition / age +2.5/5.0
- Rent growth +2.2/5.0
- Appreciation +1.6/10.0
- ARV discount +0.8/15.0
$550,000
🖨 Deal sheet 📄 Offer letter ✓ Due diligence
Listing remarks
Nestled in the heart of Rowlett, TX & close to the shores of Lake Ray Hubbard, this stunning 4-bedroom, 3.5-bathroom residence WITHA POOL is a showcase of both style and function. Boasting a spacious 3-car garage, this home offers an impeccable blend of sophisticated design and everyday comfort, perfect for those seeking ample space and modern conveniences. Step inside to discover an open and airy floor plan that seamlessly connects the living areas. The expansive living room, dotted with large windows, floods the space with natural light, creating an inviting atmosphere. Adjacent, the gourmet kitchen is a chef's delight, featuring a sizable island, and an abundance of cabinetry &
Key facts
- Privacy fencing
- Gourmet kitchen
- 0.35 acre lot
Tags
Property features AI
Finance
- Other: Deed restrictions apply; Listing acceptable for Cash, Conventional, FHA and VA financing; Property listed as residential single-family
- HOA & community: No homeowners association
Exterior
- Parking: Attached garage with 3 covered spaces; Garage features include garage door opener, 2-car double doors, 2-car single door, and garage faces rear; Garage dimensions approximately 30' wide by 19' deep
- Utilities: City water and city sewer; Electricity connected and available; Natural gas available with individual gas meter; Individual water meter; Cable and phone available; Sidewalks and curbs
- Home design: Single-family residence; One-story; Located at the end of a cul-de-sac
- Construction: Brick construction; Composition roof; Slab foundation; Built in 1999
- Exterior features: Covered porch; Awning(s); Gutters; Wood fence; Sprinkler system; Landscaped yard; Shed on property; Located on an interior cul-de-sac lot with few trees and irregular lot shape, in a subdivision
Interior
- Kitchen: Dishwasher; Disposal; Electric cooktop; Electric oven; Microwave; Water line to refrigerator; Granite counters, kitchen island and butler's pantry
- Bedrooms: 4 bedrooms (all on one level); Primary suite with walk-in closet and ensuite bath featuring dual sinks, jetted tub, separate shower, linen closet and natural stone/granite finishes; Secondary bedrooms include split-bedroom layouts and walk-in closets
- Flooring: Carpet; Ceramic tile; Luxury vinyl plank
- Bathrooms: 3 full bathrooms; 1 half bathroom; Primary bath has dual sinks, jetted tub, separate shower, linen closet and natural stone/granite surfaces
- Heating & cooling: Central heating (natural gas) with fireplace(s); Central air conditioning (electric); Ceiling fans; Gas fireplace with gas logs and gas starter (double-sided between den and living areas)
- Interior features: Open floorplan with vaulted ceilings; Granite counters; Kitchen island; Butler's pantry; Walk-in pantry; Eat-in kitchen; Dry bar; Flat screen wiring and cable/High-speed internet available; Wired for data; Decorative lighting and chandelier; Window coverings
- Laundry & utility: Laundry room with built-in cabinets; Full-size washer/dryer area; Washer and dryer hookups (electric dryer hookup)
Neighborhood map
What this means for you Summary
Snapshot
- This is a 4-bed/3.0-bath single-family listed at $550k.
Deal economics
- At list price, monthly cash flow is $2k ($21k/yr) — positive.
- The deal already cash-flows at list — no discount required.
- Meets the 1% rule at list price ($7k rent vs $550k).
- Cap rate 10.1% vs local median 3.2% in Rowlett — top-decile yield for the area; either an underpriced asset or a hidden risk that comps aren't pricing in. Stress-test before assuming the spread holds.
Location & tenants
- Location reads 75/100 on livability (#147 in TX, #4,150 nationally) — a middle-class / working-renter tenant base. Strengths: employment A+, housing A+, crime A-; Watch: amenities F, commute F, health & safety D-.
- Garland ISD (suburban): math 27% / reading 37% proficiency, ranked #553 of 826 in TX (top 67%) — families likely to look elsewhere, expect single-tenant / working-renter base with shorter leases.
- Market conditions: Rents soft (-1.2%/yr); 295 active listings in the ZIP; 10 comparable units currently listed for rent nearby; rentals at typical pace (median 24d on market — plan ~3-4 weeks tenant-placement turnaround); 40% of comp listings sitting > 30 days — soft ceiling on asking rent; solid renter incomes; 12,577 units permitted in Dallas County in 2024 (6,829 in 5+ unit buildings).
- At $7,485/mo this rent would consume 85% of the median local household income ($105k/yr) (locally 626% of renters already pay >50% of income on rent) — very limited rent-growth headroom before tenants either downsize or default.
Forward outlook
- Local home prices are declining (-3.0%/yr); year-one equity from $4k of loan paydown is wiped out by about $16k of value loss. Plan a longer hold.
- Dallas County population projected at +35% by 2050 — long-run rental-demand tailwind backs the buy-and-hold thesis.
Negotiation context
- Only 10 days on market — expect competitive offers; lowballing is unlikely to land.
Risks & watch-outs
- Climate carrying-cost: major wind risk, 27% chance of damaging wind over 30y; extreme-heat days projected 7→24/yr by 2055 (HVAC capex compounding) — expect insurance premiums to compound above CPI over the hold.
Questions for the listing agent
- Is there a deadline driving the sale (1031 exchange, divorce, estate, relocation)? That informs how much negotiation room exists.
- What's the average days-on-market for RENTAL listings here right now (not sales)? A rising rental-DOM trend means longer vacancies and softer asking-rent achievability than the comps imply.
- What's the recent tenant-quality profile in this submarket — average credit score on applications, eviction rate, late-payment / NSF rate, and stable-employment percentage? A property-management company in the area should have these aggregated.
- How much new for-sale + rental construction is in the pipeline within 1–3 miles? Heavy new supply typically softens prices + rents 12–24 months out; constrained supply supports both.
Investment metrics
- 1% rule
- 1.36% ✓
- Cap rate
- 10.11%
- Cash-on-cash
- 13.63%
- DSCR
- 1.61
- GRM
- 6.1
CMA / ARV
- ARV (median comp)
- $478,373
- List price
- $550,000
- Delta
- 14.97%
- Verdict
- OVERPRICED
- Comps
- 20 within 1.0 mi
Show comp detail 12 sales within ~0.75 mi
| Address | Dist | Beds/Ba | Sqft | Sold | Price | $/sf | Match |
|---|---|---|---|---|---|---|---|
| 2510 Shorewood Ct | 0.00mi | 4/3.5 | 2,954 (0%) | 1mo | $550,000 | $186 | 97 |
| 2406 Shorewood Ct | 0.08mi | 4/3.5 | 3,020 (+2%) | 7mo | $499,500 | $165 | 85 |
| 3006 Cottonwood Ct | 0.28mi | 4/3.5 | 2,942 (-0%) | 5mo | $440,000 | $150 | 80 |
| 3214 Chalkstone Dr | 0.24mi | 4/4.0 | 3,105 (+5%) | 2mo | $462,000 | $149 | 75 |
| 2913 Persimmon Pl | 0.30mi | 4/3.5 | 3,082 (+4%) | 5mo | $645,000 | $209 | 72 |
| 3210 Suzanne Dr | 0.28mi | 4/3.5 | 2,800 (-5%) | 7mo | $464,900 | $166 | 70 |
| 3406 Oak Trail Dr | 0.39mi | 4/2.5 | 2,651 (-10%) | 7mo | $459,800 | $173 | 56 |
| 4010 Bluffpoint Rd | 0.73mi | 4/2.5 | 2,816 (-5%) | 0mo | $439,900 | $156 | 56 |
| 3306 Oxford Dr | 0.41mi | 4/2.5 | 2,560 (-13%) | 8mo | $360,000 | $141 | 50 |
| 3306 Harbor Pointe Dr | 0.65mi | 5/3.0 (+1) | 3,229 (+9%) | 2mo | $500,000 | $155 | 48 |
| 3410 Faulkner Dr | 0.58mi | 3/2.5 (-1) | 2,642 (-11%) | 3mo | $419,000 | $159 | 46 |
| 3302 Harbor Pointe Dr | 0.63mi | 4/2.5 | 2,523 (-15%) | 6mo | $430,000 | $170 | 39 |
Match score weights: distance 35% · size 25% · config 20% · recency 20%. Top-matched comps best support the ARV.
Projected returns pro-forma
-3.0% appreciation · 0.0% rent growth · sell at horizon
- IRR
- 0.1%
- Equity multiple
- 1.00×
- Total profit
- $707
- Equity at exit
- $82,007
- IRR
- 6.2%
- Equity multiple
- 1.39×
- Total profit
- $60,690
- Equity at exit
- $47,554
Cash invested: $154,000 (down + closing). Projections, not guarantees.
Landlord ↔ Tenant lean methodology
- Overall (STATE)
- 87 Strongly Landlord-Friendly
- State Texas
- 87 Strongly Landlord-Friendly · R+5
- County
- — inherits STATE
- City
- — inherits STATE
ZIP-level market 75088
- Home prices YoY
- -2.0%
- Rents YoY
- -1.2%
- Active inventory
- 295
- Price-to-rent
- 6.1×
Monthly cashflow live
- Estimated rent
- $7,485 high interval (Pro) →
- Mortgage (P&I)
- −$2,884
- Tax from tax record
- −$1,050 /mo · $12,605/yr
- Insurance
- −$229
- HOA
- −$0
- Vacancy / Maint / Mgmt
- −$1,572
- Net cashflow
- $1,750
Break-even live
UW: 25.0% down · 7.5% · 30yr · 1.5% tax · 5.0% vac · 8.0% maint · 8.0% mgmt
Financing live
Cash to close
- Down payment
- $137,500
- Closing costs
- $16,500
- Reserves months
- —
- Total cash needed
- —
Loan-product check · same deal, 3 products live
Conventional
25% down · 7.5% · 30yr
- Down + closing
- —
- Monthly P&I
- —
- Monthly cashflow
- —
- DSCR
- —
- Eligible?
- —
Personal DTI + credit; lowest rate.
DSCR
20% down · 8.5% · 30yr
- Down + closing
- —
- Monthly P&I
- —
- Monthly cashflow
- —
- DSCR
- —
- Eligible?
- —
No personal income docs; deal must DSCR.
Hard money
10% down · 12.0% · 12mo
- Down + closing
- —
- Monthly P&I
- —
- Monthly cashflow
- —
- DSCR
- —
- Eligible?
- —
Short-term bridge; refi at stabilization.
Rent comps 10 comps
| Address | Beds | Baths | Sqft | Rent | $/sqft | DOM | Units | Dist |
|---|---|---|---|---|---|---|---|---|
| 3104 Cambridge Dr Rowlett, TX | 4.0 | 3.0 | 3560 | $3,495 | $0.98 | 43d | 1 | 0.35mi |
| 2010 Indian Trl Unit 1293860P Rowlett, TX | 5.0 | 4.0 | 3595 | $13,695 | $3.81 | 24d | 1 | 0.35mi |
| 2010 Indian Trl Rowlett, TX | 5.0 | 4.0 | 3602 | $10,950 | $3.04 | 43d | 1 | 0.35mi |
| 3913 Baywatch Dr Rowlett, TX | 5.0 | 3.0 | 2855 | $8,250 | $2.89 | 43d | 1 | 0.73mi |
| 3913 Baywatch Dr Unit 1019523P Rowlett, TX | 5.0 | 3.0 | 2583 | $10,864 | $4.21 | 22d | 1 | 0.73mi |
| 3721 Smartt St Rowlett, TX | 4.0 | 2.5 | 1977 | $2,500 | $1.26 | 20d | 1 | 0.82mi |
| 2913 David Dr Rowlett, TX | 4.0 | 3.0 | 2108 | $2,750 | $1.30 | 7d | 1 | 1.04mi |
| 5210 Orlando Cir Rowlett, TX | 4.0 | 2.5 | 2845 | $2,676 | $0.94 | 7d | 1 | 1.33mi |
| 3921 Whiterock Trl Garland, TX | 3.0 | 2.0 | 2110 | $2,300 | $1.09 | 43d | 1 | 1.39mi |
| 1600 President George Bush Hwy Rowlett, TX | 1.0–4.0 | 1.0–3.0 | 1333 | $3,015 | $2.26 | 1d | 44 | 1.44mi |
Listing history 4 events
-
2026-05-17status Pending 1928-char remark
-
2026-05-14historical Active Option Contract 1928-char remark
-
2026-05-07$550,000 Active 1928-char remark
-
2001-06-11soldstatus
ⓘ Source: listings_history table (triggers on properties + properties_extension) + one-shot
backfill from property_details.listing_events for pre-trigger history.
Tax reassessment forecast TX · Resets to sale price
- Current annual tax
- $12,605 · $1,050/mo
- Projected year-2 tax
- $12,605 · $1,050/mo
- Expected delta
- $0/yr ($0/mo · 0.0%)
ⓘ Screening estimate from a state-policy table — verify with the county assessor before closing.
Climate risk First Street
- Flood 4/10 Moderate FEMA zone X (unshaded) · 22% chance over 30 yrs
- Wildfire 3/10 Moderate
- Heat 8/10 Severe 7 d/yr ≥110°F today · 24 d/yr by 30 yrs out
- Wind 6/10 Major 27% chance of damaging wind over 30 yrs
- Air quality 2/10 Low 2 unhealthy d/yr today · 2 by 30 yrs out
Nearby sold comps map
Loading sold comps map…
Walkable amenities ~0.75 mi
Loading nearby amenities…
Taxation est. · year 1
- Rental income
- $89,823
- − Mortgage interest
- −$30,809
- − Property taxes
- −$12,605
- − Insurance
- −$2,750
- − Repairs & maintenance
- −$7,186
- − Management
- −$7,186
- − Depreciation
- −$16,000
- Taxable income
- $13,289
- Est. tax owed @ 24.0%
- −$3,189
- After-tax cash flow
- $17,806/yr
For passive investors: Depreciation is non-cash, so a rental often shows a tax loss while cash-flowing — sheltering income. Rental losses are passive: they offset passive income freely, and up to $25,000/yr can offset ordinary (W-2) income if you actively participate and your MAGI is under $100k (phasing out to $0 by $150k); unused losses carry forward. On sale, claimed depreciation is recaptured at up to 25%, and gains may owe capital-gains tax (a 1031 exchange can defer both). Figures are a year-1 estimate at your 24.0% rate — not tax advice; consult a CPA.
Schools (NCES district)
- District
- Garland ISD
- NCES district ID
- 4820340
- Math proficiency
- 27% ▼ -23.00%
- Reading proficiency
- 37% ▼ -10.00%
- Median HH income
- $58,392
- Composite
- 28.63/100
- National rank
- #6706
- State rank
- #553 of 826 in TX
Livability — Rowlett
- Score
- 75/100
- State rank
- #147
- US rank
- #4150
Category grades
Schools grade is shown separately in the Schools card above.
Census & demographics
- Census place
- Rowlett, TX
- County
- Dallas County · 2,612,404 people
- City population
- 35,619
- Metro
- Dallas-Fort Worth-Arlington, TX
- Population (ZIP)
- 28,075
- Household income
- $105,313
- Rent vs Own
- Severe rent burden
- 626.0
Population outlook (Dallas County) Hauer SSP2
- Today (2025)
- 2,979,839 people
- By 2030
- 3,191,823 · +7.1%
- By 2040
- 3,619,611 · +21.5%
- By 2050
- 4,026,915 · +35.1%
- By 2075
- 4,957,073 · +66.4%
- By 2100
- 5,508,725 · +84.9%
Race, ethnicity, and origin ACS 2023
- Neighborhood character
- Diverse neighborhood (Simpson 0.62)
- Race & ethnicity
- White 56% Hispanic / Latino 19% Black 18% Two or more races 10% Asian 4%
- Hispanic origin (detail)
- Mexican 15%
- Common ancestry
- Slovak 3% Italian 2% Romanian 2%
- Foreign-born
- 10% · Canada, Vietnam
- Languages at home
- 84% English-only · Spanish 11% Other Indo-European 1% Other Asian/Pacific 1%
Political lean MEDSL · Dallas
- 2024 margin
- Strong D (+22.2) · D 60.2% · R 38.0% · Other 1.8%
- 2008→2024 swing
- +6.9pp toward D · 2008: 15.3pp · 2024: 22.2pp
- All cycles
- 2024: D+22.2 2020: D+31.6 2016: D+26.2 2012: D+15.4 2008: D+15.3
Not yet ingested
- Civics
- —
Market trends
- HPI YoY
- ▼ -6.72%
- Current HPI
- 328.27
- Rent YoY
- ▼ -1.22%
- Metro
- Dallas-Fort Worth-Arlington, TX
- State GDP YoY
- ▲ 3.95%
- F500 in state
- 110
Industry mix (Fortune 500 HQ in TX)
| Industry | F500 HQs | Revenue |
|---|---|---|
| Energy | 16 | $1,198B |
|
||
| Technology | 5 | $198B |
|
||
| Engineering / Construction | 4 | $72B |
|
||
| Energy Services | 3 | $60B |
|
||
| Utilities | 3 | $41B |
|
||
| Healthcare | 2 | $330B |
|
||
Price history
6 events — show timeline
- 2026-05-27 Sold (Public Records) — Public Records
- 2026-05-22 Sold (MLS) — NTREIS
- 2026-05-17 Pending — NTREIS
- 2026-05-14 Contingent — NTREIS
- 2026-05-07 Listed $550,000 NTREIS
- 2001-06-11 Sold (Public Records) — Public Records
Property tax history
+5.1%/yrLatest (2025): $12,605 · +6.8% YoY. Source: county tax records.
Cash-flow waterfall
monthlySold comps — $/sqft
last 12 mo · ≤1 miLoading sold comps…