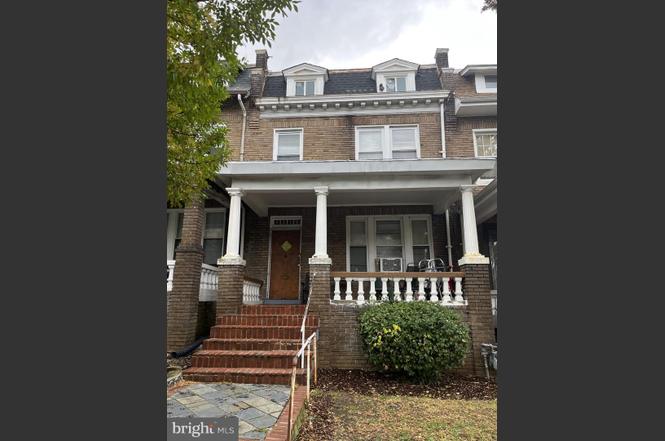
4926 9th St NW · Washington, DC
Flood risk 1/10 · Minimal
- FEMA flood zone
- X (unshaded)
- Chance of flooding over 30 yrs
- 0.0%
- Est. flood insurance / yr
- $473 – $860
Fire risk 2/10 · Minimal
- Est. fire insurance / yr
- $631 – $1,173
Heat risk 7/10 · Major
- Hot days now (above 104°F)
- 7 days/yr
- Hot days in 30 yrs
- 15 days/yr
Wind risk 4/10 · Minor
- Chance of severe wind over 30 yrs
- 15.0%
Air-quality risk 4/10 · Minor
- Unhealthy air days now
- 5 days/yr
- Unhealthy air days in 30 yrs
- 6 days/yr
Risk factors via First Street. Map © Google.
Why this score? — see what drove the D+ grade
The composite is a weighted blend of 9 inputs, each scored 0–100. Each bar is that input's sub-score; the figure is the points it added to the 100-point composite (weight × sub-score).
- ARV discount +15.0/15.0
- Cash flow +14.9/30.0
- DSCR +4.5/10.0
- Livability +3.7/5.0
- Schools +3.6/10.0
- 1% rule +2.9/10.0
- Rent growth +2.9/5.0
- Condition / age +2.5/5.0
- Appreciation +0.0/10.0
$524,000
🖨 Deal sheet 📄 Offer letter ✓ Due diligence
Listing remarks
This classic rowhome is located in the desirable Petworth neighborhood and includes three bedrooms, two full bathrooms, and hardwood floors throughout. This spacious home requires some work to restore its former luster and represents a tremendous opportunity for a handy homeowner or investor. Located on a quiet tree-lined street within walking distance of Georgia Avenue, this home is full of potential.
Key facts
- Tree-lined street
- Hardwood floors
- Built 1923
Tags
Neighborhood map
What this means for you Summary
Snapshot
- This is a 4-bed/1.5-bath townhouse listed at $524k.
Deal economics
- At list price, monthly cash flow is $149 ($2k/yr) — positive.
- The deal already cash-flows at list — no discount required.
- To meet the 1% rule (rent ≥ 1% of price), the offer needs to be $412k (21.3% below list).
- Recommended offer: $412k (21.3% below list) — sets the bar for 1% rule.
- Cap rate 6.6% vs local median 2.5% in Washington — top-decile yield for the area; either an underpriced asset or a hidden risk that comps aren't pricing in. Stress-test before assuming the spread holds.
Location & tenants
- Location reads 73/100 on livability (#1 in DC) — a middle-class / working-renter tenant base. Strengths: amenities A+, commute A+, employment A+; Watch: crime F, cost of living F.
- District Of Columbia Public Schools (urban): math 33% / reading 40% proficiency, ranked #8 of 32 in DC (top 25%) — families likely to look elsewhere, expect single-tenant / working-renter base with shorter leases; 65% free/reduced lunch — lower-income household profile, screen leases tightly.
- Market conditions: Rents rising (+1.4%/yr); 370 active listings in the ZIP; 40 comparable units currently listed for rent nearby; rentals at typical pace (median 20d on market — plan ~3-4 weeks tenant-placement turnaround); high-income renter base; 1,737 units permitted in District of Columbia in 2024 (1,506 in 5+ unit buildings).
- This rent runs 45% of the median local income ($110k/yr) — at the standard rent-burdened threshold; future hikes will face affordability resistance.
Forward outlook
- Local home prices are declining (-3.0%/yr); year-one equity from $4k of loan paydown is wiped out by about $16k of value loss. Plan a longer hold.
- District of Columbia County population projected at +50% by 2050 — long-run rental-demand tailwind backs the buy-and-hold thesis.
Negotiation context
- It's been on market 79 days — a 6% lower offer ($493k) is reasonable based on typical stale-listing flexibility.
- Current owner paid $110k; list at $524k implies a 376% gain — meaningful room to come down on a strong offer.
Risks & watch-outs
- Watch-outs: built in 1923 — expect roof / HVAC / electrical / plumbing capex.
- Climate carrying-cost: extreme-heat days projected 7→15/yr by 2055 (HVAC capex compounding) — expect insurance premiums to compound above CPI over the hold.
Questions for the listing agent
- It's been on market 79 days. Have you received any prior offers? Is the seller open to a 21% concession, seller financing, or rate buy-down credit?
- Built in 1923 — when were the roof, HVAC, electrical panel, plumbing, and water heater last replaced?
- Why hasn't it sold? Are there any deal-killer items the seller is aware of (foundation, flood, title, zoning, code violations)?
- Is there a deadline driving the sale (1031 exchange, divorce, estate, relocation)? That informs how much negotiation room exists.
- Crime grade is F in this area — have there been break-ins, vandalism, or insurance claims at this property in the last 3 years? What carrier currently insures it and at what premium?
- The area grade is low — what's the realistic commute time and amenity access for the typical tenant pool here? Any planned neighborhood developments (good or bad) we should know about?
- What's the average days-on-market for RENTAL listings here right now (not sales)? A rising rental-DOM trend means longer vacancies and softer asking-rent achievability than the comps imply.
- What's the recent tenant-quality profile in this submarket — average credit score on applications, eviction rate, late-payment / NSF rate, and stable-employment percentage? A property-management company in the area should have these aggregated.
- How much new for-sale + rental construction is in the pipeline within 1–3 miles? Heavy new supply typically softens prices + rents 12–24 months out; constrained supply supports both.
Investment metrics
- 1% rule
- 0.79% ✗
- Cap rate
- 6.63%
- Cash-on-cash
- 1.22%
- DSCR
- 1.05
- GRM
- 10.6
CMA / ARV
- ARV (on-the-fly)
- $665,820
- Comps found
- 12
Show comp detail 12 sales within ~0.75 mi
| Address | Dist | Beds/Ba | Sqft | Sold | Price | $/sf | Match |
|---|---|---|---|---|---|---|---|
| 5517 7th St NW Unit B | 0.48mi | 3/2.5 (-1) | 1,600 (-1%) | 0mo | $630,000 | $394 | 66 |
| 5019 7th Pl NW | 0.17mi | 4/2.5 | 1,827 (+13%) | 2mo | $750,000 | $411 | 65 |
| 4928 3rd St NW | 0.52mi | 3/3.0 (-1) | 1,562 (-4%) | 1mo | $559,000 | $358 | 58 |
| 4513 5th St NW | 0.49mi | 3/1.5 (-1) | 1,488 (-8%) | 2mo | $360,000 | $242 | 57 |
| 5337 5th St NW | 0.46mi | 3/3.5 (-1) | 1,735 (+7%) | 1mo | $835,000 | $481 | 53 |
| 822 Crittenden St NW | 0.25mi | 3/3.0 (-1) | 1,845 (+14%) | 2mo | $925,000 | $501 | 52 |
| 4210 New Hampshire Ave NW | 0.64mi | 3/2.0 (-1) | 1,720 (+6%) | 2mo | $530,000 | $308 | 51 |
| 308 Emerson St NW | 0.51mi | 3/2.5 (-1) | 1,784 (+10%) | 1mo | $751,000 | $421 | 50 |
| 525 Kennedy St NW #3 | 0.49mi | 3/2.0 (-1) | 1,400 (-14%) | 0mo | $492,500 | $352 | 47 |
| 246 Gallatin St NW | 0.58mi | 3/3.0 (-1) | 1,784 (+10%) | 2mo | $555,000 | $311 | 44 |
| 609 Upshur St NW #3 | 0.64mi | 3/3.0 (-1) | 1,768 (+9%) | 2mo | $840,000 | $475 | 42 |
| 208 Webster St NW | 0.74mi | 4/3.5 | 1,850 (+14%) | 0mo | $999,000 | $540 | 34 |
Match score weights: distance 35% · size 25% · config 20% · recency 20%. Top-matched comps best support the ARV.
Projected returns pro-forma
-3.0% appreciation · 1.45% rent growth · sell at horizon
- IRR
- -15.9%
- Equity multiple
- 0.44×
- Total profit
- $-82,022
- Equity at exit
- $78,130
- IRR
- -10.2%
- Equity multiple
- 0.42×
- Total profit
- $-85,435
- Equity at exit
- $45,306
Cash invested: $146,720 (down + closing). Projections, not guarantees.
Landlord ↔ Tenant lean methodology
- Overall (CITY)
- 0 Strongly Tenant-Friendly
- State District of Columbia
- 12 Strongly Tenant-Friendly · D+43
- County
- — inherits STATE
- City Washington
- 0 Strongly Tenant-Friendly · D+43
ZIP-level market 20011
- Rents YoY
- 1.4%
- Active inventory
- 370
- Price-to-rent
- 10.6×
Monthly cashflow live
- Estimated rent
- $4,121 high interval (Pro) →
- Mortgage (P&I)
- −$2,748
- Tax from tax record
- −$141 /mo · $1,691/yr
- Insurance
- −$218
- HOA
- −$0
- Vacancy / Maint / Mgmt
- −$865
- Net cashflow
- $149
Break-even live
UW: 25.0% down · 7.5% · 30yr · 1.5% tax · 5.0% vac · 8.0% maint · 8.0% mgmt
Financing live
Cash to close
- Down payment
- $131,000
- Closing costs
- $15,720
- Reserves months
- —
- Total cash needed
- —
Loan-product check · same deal, 3 products live
Conventional
25% down · 7.5% · 30yr
- Down + closing
- —
- Monthly P&I
- —
- Monthly cashflow
- —
- DSCR
- —
- Eligible?
- —
Personal DTI + credit; lowest rate.
DSCR
20% down · 8.5% · 30yr
- Down + closing
- —
- Monthly P&I
- —
- Monthly cashflow
- —
- DSCR
- —
- Eligible?
- —
No personal income docs; deal must DSCR.
Hard money
10% down · 12.0% · 12mo
- Down + closing
- —
- Monthly P&I
- —
- Monthly cashflow
- —
- DSCR
- —
- Eligible?
- —
Short-term bridge; refi at stabilization.
Rent comps 40 comps
| Address | Beds | Baths | Sqft | Rent | $/sqft | DOM | Units | Dist |
|---|---|---|---|---|---|---|---|---|
| 4823 9th St NW Washington, DC | 4.0 | 2.0 | 2144 | $3,750 | $1.75 | 5d | 1 | 0.12mi |
| 5326 9th St NW Unit 1 Washington, DC | 3.0 | 3.5 | 1547 | $4,500 | $2.91 | 18d | 1 | 0.28mi |
| 4605 Georgia Ave NW Washington, DC | 4.0 | 3.0 | 2000 | $4,500 | $2.25 | 7d | 1 | 0.32mi |
| 4527 Georgia Ave NW #2 Washington, DC | 3.0 | 3.0 | 1600 | $4,200 | $2.62 | 24d | 1 | 0.36mi |
| 4617 Arkansas Ave NW Washington, DC | 4.0 | 3.0 | 1538 | $4,350 | $2.83 | 18d | 1 | 0.39mi |
| 440 Delafield Pl NW Washington, DC | 3.0 | 3.5 | 1564 | $3,400 | $2.17 | 18d | 1 | 0.41mi |
| 440 Delafield Pl NW Washington, DC | 3.0 | 2.5 | 1564 | $3,400 | $2.17 | 18d | 1 | 0.41mi |
| 5211 14th St NW Washington, DC | 4.0 | 3.0 | 2220 | $4,500 | $2.03 | 24d | 1 | 0.42mi |
| 521 Kennedy St NW #4 Washington, DC | 3.0 | 2.0 | 1333 | $3,250 | $2.44 | 24d | 1 | 0.48mi |
| 5601 13th St NW Washington, DC | 2.0–4.0 | 1.0–2.0 | 862 | $5,008 | $5.81 | 3d | 21 | 0.49mi |
| 1353 Kennedy St NW Washington, DC | 3.0 | 2.0 | 1738 | $4,400 | $2.53 | 20d | 1 | 0.50mi |
| 5404 4th St NW #1 Washington, DC | 4.0 | 4.5 | 2250 | $5,500 | $2.44 | 4d | 1 | 0.54mi |
| 5404 4th St NW #2 Washington, DC | 4.0 | 3.5 | 2250 | $5,900 | $2.62 | 4d | 1 | 0.54mi |
| 4712 Piney Branch Rd NW Washington, DC | 3.0 | 2.0 | 1560 | $3,950 | $2.53 | 15d | 1 | 0.57mi |
| 242 Emerson St NW Washington, DC | 4.0 | 2.5 | 1800 | $3,775 | $2.10 | 18d | 1 | 0.57mi |
| 424 Missouri Ave NW #4 Washington, DC | 3.0 | 3.0 | 1500 | $4,500 | $3.00 | 24d | 1 | 0.59mi |
| 5201 2nd St NW Unit A Washington, DC | 4.0 | 2.5 | 2000 | $4,000 | $2.00 | 24d | 1 | 0.71mi |
| 225 Missouri Ave NW Washington, DC | 5.0 | 4.5 | 2138 | $7,100 | $3.32 | 1d | 1 | 0.74mi |
| 1419 Upshur St NW #1 Washington, DC | 3.0 | 2.5 | 1164 | $3,239 | $2.78 | 24d | 1 | 0.75mi |
| 207 Kennedy St NW Washington, DC | 5.0 | 2.5 | 1537 | $6,600 | $4.29 | 1d | 1 | 0.76mi |
| 4023 New Hampshire Ave NW Washington, DC | 4.0 | 3.5 | 1946 | $5,950 | $3.06 | 24d | 1 | 0.77mi |
| 118 Longfellow St NW Washington, DC | 3.0 | 2.5 | 1803 | $7,804 | $4.33 | 1d | 1 | 0.86mi |
| 310 Taylor St NW Washington, DC | 3.0 | 2.0 | 1728 | $4,200 | $2.43 | 24d | 1 | 0.88mi |
| 734 Quincy St NW Unit A Washington, DC | 3.0 | 2.5 | 1900 | $3,795 | $2.00 | 24d | 1 | 0.95mi |
| 3821 14th St NW #1 Washington, DC | 3.0 | 2.0 | 1182 | $3,995 | $3.38 | 24d | 1 | 0.95mi |
| 1008 Rittenhouse St NW #15 Washington, DC | 4.0 | 2.5 | 1572 | $4,100 | $2.61 | 24d | 1 | 0.96mi |
| 3716 13th St NW Washington, DC | 3.0 | 3.0 | 2180 | $5,100 | $2.34 | 4d | 1 | 0.97mi |
| 4607 N Capitol St NE Washington, DC | 3.0 | 1.5 | 1536 | $2,975 | $1.94 | 24d | 1 | 0.98mi |
| 1006 Quebec Pl NW Washington, DC | 3.0 | 1.5 | 1584 | $3,400 | $2.15 | 4d | 1 | 0.98mi |
| 5520 N Capitol St NW Washington, DC | 4.0 | 3.5 | 2070 | $5,399 | $2.61 | 4d | 1 | 1.00mi |
| 12 Hawaii Ave NE Washington, DC | 3.0 | 2.0 | 1650 | $4,000 | $2.42 | 24d | 1 | 1.00mi |
| 1305 Rittenhouse St NW Washington, DC | 3.0 | 2.5 | 2177 | $3,850 | $1.77 | 24d | 1 | 1.03mi |
| 66 Allison St NE Unit 66 Washington, DC | 3.0 | 2.0 | 1545 | $3,500 | $2.27 | 24d | 1 | 1.07mi |
| 6302 7th St NW Washington, DC | 3.0 | 2.0 | 1581 | $3,825 | $2.42 | 12d | 1 | 1.07mi |
| 3631 Warder St NW Washington, DC | 5.0 | 3.0 | 1880 | $4,590 | $2.44 | 24d | 1 | 1.08mi |
| 1419 Rittenhouse St NW Washington, DC | 3.0 | 1.5 | 2091 | $3,350 | $1.60 | 12d | 1 | 1.11mi |
| 1005 Otis Pl NW Washington, DC | 4.0 | 2.0 | 1600 | $1,125 | $0.70 | 24d | 1 | 1.12mi |
| 1358 Parkwood Pl NW Washington, DC | 3.0 | 1.0 | 1280 | $4,500 | $3.52 | 7d | 1 | 1.14mi |
| 3613 New Hampshire Ave NW Washington, DC | 4.0 | 2.0 | 1400 | $3,800 | $2.71 | 24d | 1 | 1.14mi |
| 3552 Warder St NW Washington, DC | 3.0 | 3.0 | 1240 | $3,995 | $3.22 | 24d | 1 | 1.22mi |
Listing history 4 events
-
2026-01-21status Pending
-
2025-12-01price $524,000
-
2025-11-03$549,000 Active
-
2000-02-22soldstatus $110,000
ⓘ Source: listings_history table (triggers on properties + properties_extension) + one-shot
backfill from property_details.listing_events for pre-trigger history.
Tax reassessment forecast DC · Partial reset (capped growth)
- Current annual tax
- $1,691 · $141/mo
- Projected year-2 tax
- $2,444 · $204/mo
- Expected delta
- +$753/yr (+$63/mo · 44.5%)
ⓘ Screening estimate from a state-policy table — verify with the county assessor before closing.
Climate risk First Street
- Flood 1/10 Low FEMA zone X (unshaded) · 0% chance over 30 yrs
- Wildfire 2/10 Low
- Heat 7/10 Severe 7 d/yr ≥104°F today · 15 d/yr by 30 yrs out
- Wind 4/10 Moderate 15% chance of damaging wind over 30 yrs
- Air quality 4/10 Moderate 5 unhealthy d/yr today · 6 by 30 yrs out
Nearby sold comps map
Loading sold comps map…
Walkable amenities ~0.75 mi
Loading nearby amenities…
Taxation est. · year 1
- Rental income
- $49,457
- − Mortgage interest
- −$29,352
- − Property taxes
- −$1,691
- − Insurance
- −$2,620
- − Repairs & maintenance
- −$3,957
- − Management
- −$3,957
- − Depreciation
- −$15,244
- Taxable loss
- −$7,363
- Est. tax savings @ 24.0%
- +$1,767
- After-tax cash flow
- $3,552/yr
For passive investors: Depreciation is non-cash, so a rental often shows a tax loss while cash-flowing — sheltering income. Rental losses are passive: they offset passive income freely, and up to $25,000/yr can offset ordinary (W-2) income if you actively participate and your MAGI is under $100k (phasing out to $0 by $150k); unused losses carry forward. On sale, claimed depreciation is recaptured at up to 25%, and gains may owe capital-gains tax (a 1031 exchange can defer both). Figures are a year-1 estimate at your 24.0% rate — not tax advice; consult a CPA.
Schools (NCES district)
- District
- District Of Columbia Public Schools
- NCES district ID
- 1100030
- Math proficiency
- 33% ▲ 3.00%
- Reading proficiency
- 40% ▲ 5.00%
- Median HH income
- $67,671
- Composite
- 35.84/100
- National rank
- #9606
- State rank
- #8 of 32 in DC
Livability — Washington
- Score
- 73/100
- State rank
- #1
- US rank
- #5327
Category grades
Schools grade is shown separately in the Schools card above.
Census & demographics
- Census place
- Washington, DC
- County
- District of Columbia · 671,873 people
- City population
- 671,873
- Metro
- Washington-Arlington-Alexandria, DC-VA-MD-WV
- Population (ZIP)
- 67,434
- Household income
- $110,309
- Rent vs Own
- Severe rent burden
- 3020.0
Population outlook (District of Columbia County) Hauer SSP2
- Today (2025)
- 821,926 people
- By 2030
- 899,517 · +9.4%
- By 2040
- 1,061,162 · +29.1%
- By 2050
- 1,231,493 · +49.8%
- By 2075
- 1,603,312 · +95.1%
- By 2100
- 1,847,141 · +124.7%
Race, ethnicity, and origin ACS 2023
- Neighborhood character
- Diverse neighborhood (Simpson 0.66)
- Race & ethnicity
- Black 50% Hispanic / Latino 23% White 20% Two or more races 10% Asian 2%
- Hispanic origin (detail)
- Mexican 2% Dominican 1%
- Common ancestry
- Lithuanian 1% Romanian 1% Slovak 1%
- Foreign-born
- 21% · Canada
- Languages at home
- 70% English-only · Spanish 20% French/Haitian/Cajun 2% Other Indo-European 1%
Political lean MEDSL · District of Columbia
- 2024 margin
- Solid D (+86.1) · D 91.2% · R 5.1% · Other 3.8%
- 2008→2024 swing
- +0.1pp no change · 2008: 85.9pp · 2024: 86.1pp
- All cycles
- 2024: D+86.1 2020: D+86.8 2016: D+88.7 2012: D+84.2 2008: D+85.9
Not yet ingested
- Civics
- —
Market trends
- HPI YoY
- ▼ -755.96%
- Current HPI
- 378.1083
- Rent YoY
- ▲ 1.45%
- Metro
- Washington-Arlington-Alexandria, DC-VA-MD-WV
- State GDP YoY
- ▲ 1.33%
- F500 in state
- 6
Industry mix (Fortune 500 HQ in DC)
| Industry | F500 HQs | Revenue |
|---|---|---|
| Financial Services | 1 | $153B |
|
||
| Life Sciences / Industrials | 1 | $25B |
|
||
| Industrial Machinery | 1 | $8B |
|
||
Price history
+376.4% since first listed4 events — show timeline
- 2026-01-21 Pending — BRIGHT MLS
- 2025-12-01 Price Changed $524,000 BRIGHT MLS
- 2025-11-03 Listed $549,000 BRIGHT MLS
- 2000-02-22 Sold (Public Records) $110,000 Public Records
Property tax history
-4.2%/yrLatest (2025): $1,691 · +1.3% YoY. Source: county tax records.
Cash-flow waterfall
monthlySold comps — $/sqft
last 12 mo · ≤1 miLoading sold comps…