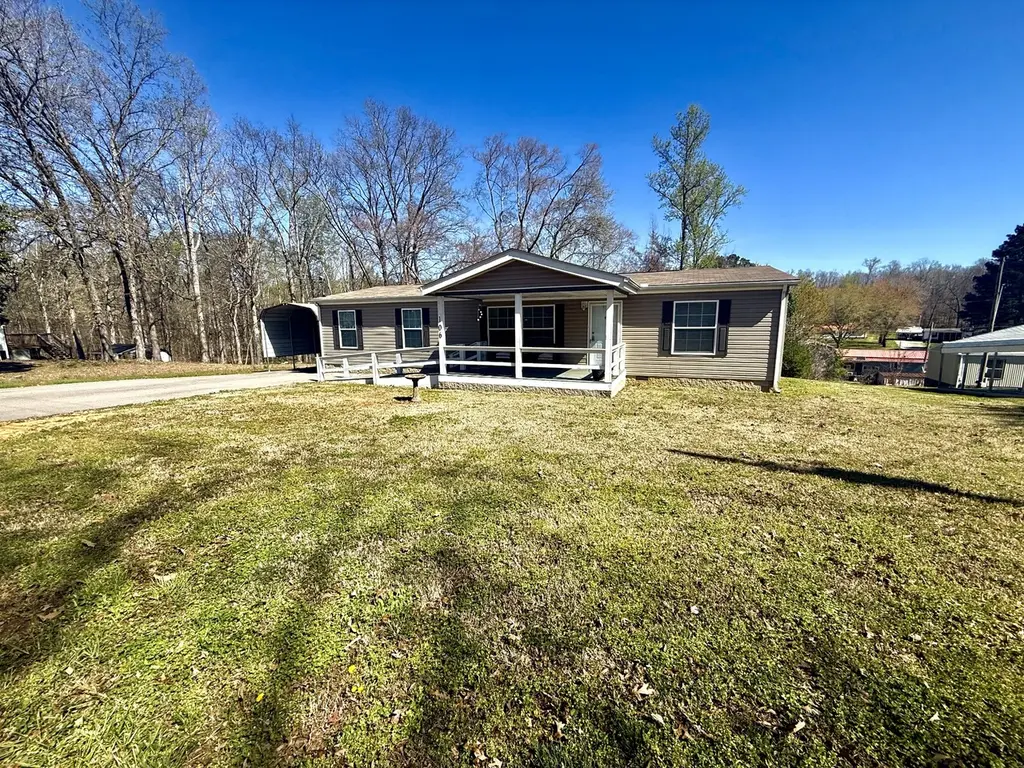
106 Fox Squirrel Dr · Dover, TN
Flood risk 1/10 · Minimal
- FEMA flood zone
- X (unshaded)
- Chance of flooding over 30 yrs
- 0.0%
- Est. flood insurance / yr
- $507 – $1,088
Fire risk 2/10 · Minimal
- Est. fire insurance / yr
- $949 – $1,763
Heat risk 5/10 · Moderate
- Hot days now (above 108°F)
- 7 days/yr
- Hot days in 30 yrs
- 21 days/yr
Wind risk 4/10 · Minor
- Chance of severe wind over 30 yrs
- 11.0%
Air-quality risk 1/10 · Minimal
- Unhealthy air days now
- 0 days/yr
- Unhealthy air days in 30 yrs
- 0 days/yr
Risk factors via First Street. Map © Google.
Why this score? — see what drove the C- grade
The composite is a weighted blend of 9 inputs, each scored 0–100. Each bar is that input's sub-score; the figure is the points it added to the 100-point composite (weight × sub-score).
- Cash flow +16.2/30.0
- Appreciation +10.0/10.0
- ARV discount +7.5/15.0
- DSCR +5.0/10.0
- Livability +3.4/5.0
- 1% rule +3.1/10.0
- Schools +3.0/10.0
- Rent growth +2.5/5.0
- Condition / age +2.5/5.0
$270,000
🖨 Deal sheet 📄 Offer letter ✓ Due diligence
Listing remarks MLS
Walking distance to KY Lake! Immaculate 3 bedroom 2 bath home. Open floor plan with nice living room area with ceiling fan, spacious kitchen with eating bar and pantry. Master has large walk-in closet with master bath featuring double sinks, garden tub and separate shower. Covered front porch with ramp. Sit and relax on the 23.2x15.85 screened in back porch with 2 ceiling fans. 1 car carport and utility building stay. Home is on a permanent Foundation.
Key facts
- 0.34 acre lot
- Parking
- Built 2020
Property features AI
Exterior
- Parking: Detached parking; Carport (1 space); 1 covered parking space (total 1 space)
- Utilities: Private water; Private sewer; Water available
- Home design: Residential manufactured home on land; Single-story
- Construction: Vinyl siding; Asphalt roof; Crawl space foundation; Year/Model: Model
- Exterior features: Deck; Covered porch; Screened porch; Storage structure; Hilly lot
Interior
- Kitchen: Built-in electric range; Dishwasher; Microwave; Refrigerator; Kitchen island
- Bedrooms: 3 bedrooms (all on the main level); Bedroom sizes: 13 x 12; 10 x 12; 10 x 12
- Flooring: Carpet; Laminate; Vinyl
- Bathrooms: 2 full bathrooms; Master bathroom with double vanity
- Heating & cooling: Central heating; Central air
- Interior features: Ceiling fans; Open floor plan; Walk-in closets; Kitchen island
- Laundry & utility: Washer hookup; Electric dryer hookup
Neighborhood map
What this means for you Summary
Snapshot
- This is a 3-bed/3.0-bath manufactured listed at $270k.
Deal economics
- At list price, monthly cash flow is $144 ($2k/yr) — positive.
- The deal already cash-flows at list — no discount required.
- To meet the 1% rule (rent ≥ 1% of price), the offer needs to be $220k (18.5% below list).
- Recommended offer: $220k (18.5% below list) — sets the bar for 1% rule.
Location & tenants
- Location reads 67/100 on livability (#98 in TN) — a middle-class / working-renter tenant base. Strengths: cost of living A+, housing A+, crime A-; Watch: employment D, amenities F, commute F.
- Stewart County (rural): math 36% / reading 35% proficiency, ranked #30 of 139 in TN (top 22%) — families likely to look elsewhere, expect single-tenant / working-renter base with shorter leases.
- Zoned schools: Dover Elementary (math 40% / reading 40%, grade F, #226 of 952 statewide, top 24%, 495 students, 0% FRL); Stewart Co High School (math 2% / reading 32%, grade F, #215 of 332 statewide, top 67%, 627 students, 0% FRL) — zoned schools average 0% FRL vs 50% district-wide (50 pts lower); this property's tenant base skews higher-income than the district average.
- Market conditions: 124 active listings in the ZIP; 1 comparable units currently listed for rent nearby; 15 units permitted in Stewart County in 2024 (0 in 5+ unit buildings).
Forward outlook
- In year one you build about $29k of equity ($2k loan paydown + $27k appreciation (10.0% local appreciation)).
- Stewart County population projected at -12% by 2050 — secular population decline; favor cash flow + early exit over multi-decade hold.
- At projected returns (10.0% appreciation + 3.0% rent growth), your $76k cash investment doubles in ~3 years — after that, you're playing with house money.
- By year 2, paydown + projected appreciation supports a ~$46k cash-out refi (75% LTV) — recoverable capital for the next deal without selling this one.
Negotiation context
- It's been on market 84 days — a 6% lower offer ($254k) is reasonable based on typical stale-listing flexibility.
- 3 sale attempts since 3y ago with the ask held roughly flat each time — persistent listings suggest the price (not the market) is what's stuck; bring a comps-based counter.
- Current owner paid $215k; 26% above their basis — modest negotiation headroom, anchor on the comps not their cost.
Risks & watch-outs
- Climate carrying-cost: extreme-heat days projected 7→21/yr by 2055 (HVAC capex compounding) — expect insurance premiums to compound above CPI over the hold.
Questions for the listing agent
- It's been on market 84 days. Have you received any prior offers? Is the seller open to a 19% concession, seller financing, or rate buy-down credit?
- Why hasn't it sold? Are there any deal-killer items the seller is aware of (foundation, flood, title, zoning, code violations)?
- Is there a deadline driving the sale (1031 exchange, divorce, estate, relocation)? That informs how much negotiation room exists.
- Schools are F-rated, which usually means shorter tenancies and higher turnover. Who's the typical renter profile here, and what's been the actual vacancy rate?
- What's the average days-on-market for RENTAL listings here right now (not sales)? A rising rental-DOM trend means longer vacancies and softer asking-rent achievability than the comps imply.
- What's the recent tenant-quality profile in this submarket — average credit score on applications, eviction rate, late-payment / NSF rate, and stable-employment percentage? A property-management company in the area should have these aggregated.
- How much new for-sale + rental construction is in the pipeline within 1–3 miles? Heavy new supply typically softens prices + rents 12–24 months out; constrained supply supports both.
Investment metrics
- 1% rule
- 0.81% ✗
- Cap rate
- 6.93%
- Cash-on-cash
- 2.29%
- DSCR
- 1.10
- GRM
- 10.2
CMA / ARV
No comps found within radius.
Projected returns pro-forma
10.0% appreciation · 3.0% rent growth · sell at horizon
- IRR
- 25.9%
- Equity multiple
- 3.06×
- Total profit
- $156,103
- Equity at exit
- $243,237
- IRR
- 22.7%
- Equity multiple
- 6.98×
- Total profit
- $452,206
- Equity at exit
- $524,551
Cash invested: $75,600 (down + closing). Projections, not guarantees.
Landlord ↔ Tenant lean methodology
- Overall (STATE)
- 87 Strongly Landlord-Friendly
- State Tennessee
- 87 Strongly Landlord-Friendly · R+13
- County
- — inherits STATE
- City
- — inherits STATE
ZIP-level market 37058
- Home prices YoY
- 9.3%
- Active inventory
- 124
- Price-to-rent
- 10.2×
Monthly cashflow live
- Estimated rent
- $2,200 medium interval (Pro) →
- Mortgage (P&I)
- −$1,416
- Tax from tax record
- −$65 /mo · $784/yr
- Insurance
- −$112
- HOA
- −$0
- Vacancy / Maint / Mgmt
- −$462
- Net cashflow
- $144
Break-even live
UW: 25.0% down · 7.5% · 30yr · 1.5% tax · 5.0% vac · 8.0% maint · 8.0% mgmt
Financing live
Cash to close
- Down payment
- $67,500
- Closing costs
- $8,100
- Reserves months
- —
- Total cash needed
- —
Loan-product check · same deal, 3 products live
Conventional
25% down · 7.5% · 30yr
- Down + closing
- —
- Monthly P&I
- —
- Monthly cashflow
- —
- DSCR
- —
- Eligible?
- —
Personal DTI + credit; lowest rate.
DSCR
20% down · 8.5% · 30yr
- Down + closing
- —
- Monthly P&I
- —
- Monthly cashflow
- —
- DSCR
- —
- Eligible?
- —
No personal income docs; deal must DSCR.
Hard money
10% down · 12.0% · 12mo
- Down + closing
- —
- Monthly P&I
- —
- Monthly cashflow
- —
- DSCR
- —
- Eligible?
- —
Short-term bridge; refi at stabilization.
Rent comps 1 comps
| Address | Beds | Baths | Sqft | Rent | $/sqft | DOM | Units | Dist |
|---|---|---|---|---|---|---|---|---|
| 132 Red Fox Dr Dover, TN | 3.0 | 3.0 | 1456 | $2,200 | $1.51 | 23d | 1 | 0.26mi |
Listing history 20 events
-
2026-06-18days on market $270,000 Active 84 DOM
-
2026-06-17days on market $270,000 Active 83 DOM
-
2026-06-16days on market $270,000 Active 82 DOM
-
2026-06-15days on market $270,000 Active 81 DOM
-
2026-06-13days on market $270,000 Active 79 DOM
-
2026-06-12days on market $270,000 Active 78 DOM
-
2026-06-09days on market $270,000 Active 75 DOM
-
2026-06-08days on market $270,000 Active 74 DOM
-
2026-06-08days on market $270,000 Active 73 DOM
-
2026-06-07days on market $270,000 Active 72 DOM
-
2026-06-03days on market $270,000 Active 69 DOM
-
2026-06-02days on market $270,000 Active 68 DOM
-
2026-06-01days on market $270,000 Active 67 DOM
-
2026-05-31days on market $270,000 Active 66 DOM
-
2026-03-27$270,000 Active
-
2026-03-26$270,000 Active 457-char remark
Show marketing remark (457 chars)
Walking distance to KY Lake! Immaculate 3 bedroom 2 bath home. Open floor plan with nice living room area with ceiling fan, spacious kitchen with eating bar and pantry. Master has large walk-in closet with master bath featuring double sinks, garden tub and separate shower. Covered front porch with ramp. Sit and relax on the 23.2x15.85 screened in back porch with 2 ceiling fans. 1 car carport and utility building stay. Home is on a permanent Foundation.
-
2023-11-01soldstatus $215,000
-
2023-10-31soldstatus $215,000 Closed 265-char remark
Show marketing remark (265 chars)
Beautiful almost new doublewide with extremely close proximity to Kentucky Lake just a short walk from Leatherwood Resort. Three bedrooms and two full baths inside with great kitchen space. Outside you'll find two large porches, with a screened in deck on the back.
-
2023-07-11$234,900 265-char remark
Show marketing remark (265 chars)
Beautiful almost new doublewide with extremely close proximity to Kentucky Lake just a short walk from Leatherwood Resort. Three bedrooms and two full baths inside with great kitchen space. Outside you'll find two large porches, with a screened in deck on the back.
-
2005-08-02soldstatus $59,600
ⓘ Source: listings_history table (triggers on properties + properties_extension) + one-shot
backfill from property_details.listing_events for pre-trigger history.
Tax reassessment forecast TN · Resets to sale price
- Current annual tax
- $784 · $65/mo
- Projected year-2 tax
- $1,917 · $160/mo
- Expected delta
- +$1,133/yr (+$94/mo · 144.5%)
ⓘ Screening estimate from a state-policy table — verify with the county assessor before closing.
Climate risk First Street
- Flood 1/10 Low FEMA zone X (unshaded) · 0% chance over 30 yrs
- Wildfire 2/10 Low
- Heat 5/10 Major 7 d/yr ≥108°F today · 21 d/yr by 30 yrs out
- Wind 4/10 Moderate 11% chance of damaging wind over 30 yrs
- Air quality 1/10 Low 0 unhealthy d/yr today · 0 by 30 yrs out
Nearby sold comps map
Loading sold comps map…
Walkable amenities ~0.75 mi
Loading nearby amenities…
Taxation est. · year 1
- Rental income
- $26,400
- − Mortgage interest
- −$15,124
- − Property taxes
- −$784
- − Insurance
- −$1,350
- − Repairs & maintenance
- −$2,112
- − Management
- −$2,112
- − Depreciation
- −$7,855
- Taxable loss
- −$2,937
- Est. tax savings @ 24.0%
- +$705
- After-tax cash flow
- $2,436/yr
For passive investors: Depreciation is non-cash, so a rental often shows a tax loss while cash-flowing — sheltering income. Rental losses are passive: they offset passive income freely, and up to $25,000/yr can offset ordinary (W-2) income if you actively participate and your MAGI is under $100k (phasing out to $0 by $150k); unused losses carry forward. On sale, claimed depreciation is recaptured at up to 25%, and gains may owe capital-gains tax (a 1031 exchange can defer both). Figures are a year-1 estimate at your 24.0% rate — not tax advice; consult a CPA.
Schools (NCES district)
- District
- Stewart County
- NCES district ID
- 4703960
- Math proficiency
- 36% ▼ -4.00%
- Reading proficiency
- 35% ▼ -5.00%
- Median HH income
- $41,035
- Composite
- 29.92/100
- National rank
- #6383
- State rank
- #30 of 139 in TN
Livability — Dover
- Score
- 67/100
- State rank
- #98
- US rank
- #10364
Category grades
Schools grade is shown separately in the Schools card above.
Census & demographics
- Population (ZIP)
- 7,369
Population outlook (Stewart County) Hauer SSP2
- Today (2025)
- 13,019 people
- By 2030
- 12,780 · -1.8%
- By 2040
- 12,152 · -6.7%
- By 2050
- 11,484 · -11.8%
- By 2075
- 10,249 · -21.3%
- By 2100
- 9,338 · -28.3%
Race, ethnicity, and origin ACS 2023
- Neighborhood character
- Predominantly White (92%)
- Race & ethnicity
- White 92% Two or more races 4% Hispanic / Latino 2% Asian 1%
- Common ancestry
- Italian 7% Serbian 4% Slovak 3%
- Foreign-born
- 2% · South Korea
- Languages at home
- 97% English-only · Korean 1% Other Asian/Pacific 1% Spanish 1%
Political lean MEDSL · Stewart
- 2024 margin
- Solid R (+63.9) · D 17.5% · R 81.4% · Other 1.1%
- 2008→2024 swing
- -55.1pp toward R · 2008: -8.8pp · 2024: -63.9pp
- All cycles
- 2024: R+63.9 2020: R+59.0 2016: R+50.0 2012: R+17.5 2008: R+8.8
Not yet ingested
- Civics
- —
Market trends
- HPI YoY
- ▲ 24.47%
- Current HPI
- 286.5122
- Rent YoY
- —
- Metro
- —
- State GDP YoY
- ▲ 2.78%
- F500 in state
- 22
Industry mix (Fortune 500 HQ in TN)
| Industry | F500 HQs | Revenue |
|---|---|---|
| Healthcare | 3 | $91B |
|
||
| Retail | 3 | $72B |
|
||
| Transportation / Logistics | 1 | $88B |
|
||
| Paper / Packaging | 1 | $19B |
|
||
| Insurance | 1 | $13B |
|
||
| Energy | 1 | $12B |
|
||
Price history
+353.0% since first listed6 events — show timeline
- 2026-03-27 Listed $270,000 REALTRACS as Distributed by MLS Grid
- 2026-03-26 Listed $270,000 TVAR
- 2023-11-01 Sold (Public Records) $215,000 Public Records
- 2023-10-31 Sold (MLS) $215,000 TVAR
- 2023-07-11 Listed $234,900 TVAR
- 2005-08-02 Sold (Public Records) $59,600 Public Records
Property tax history
+6.4%/yrLatest (2025): $784 · +3.0% YoY. Source: county tax records.
Cash-flow waterfall
monthlySold comps — $/sqft
last 12 mo · ≤1 miLoading sold comps…