18061 Biscayne Blvd #301 · Aventura, FL
Flood risk No data
- FEMA flood zone
- —
- Chance of flooding over 30 yrs
- %
- Est. flood insurance / yr
- —
Fire risk No data
- Est. fire insurance / yr
- —
Heat risk No data
- Hot days now (above °F)
- days/yr
- Hot days in 30 yrs
- days/yr
Wind risk No data
- Chance of severe wind over 30 yrs
- %
Air-quality risk No data
- Unhealthy air days now
- days/yr
- Unhealthy air days in 30 yrs
- days/yr
Risk factors via First Street. Map © Google.
Why this score? — see what drove the B grade
The composite is a weighted blend of 9 inputs, each scored 0–100. Each bar is that input's sub-score; the figure is the points it added to the 100-point composite (weight × sub-score).
- Cash flow +27.1/30.0
- 1% rule +10.0/10.0
- DSCR +9.4/10.0
- ARV discount +7.5/15.0
- Appreciation +5.3/10.0
- Schools +4.2/10.0
- Livability +4.0/5.0
- Rent growth +2.7/5.0
- Condition / age +2.5/5.0
$229,900
🖨 Deal sheet 📄 Offer letter ✓ Due diligence
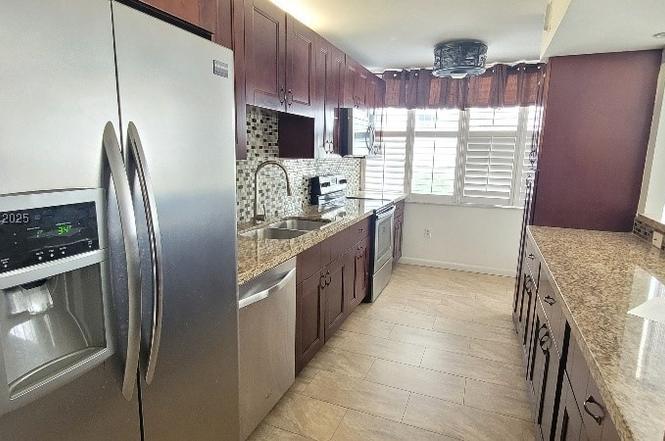
Listing remarks
BOATERES PARADISE . BEST DEAL IN COMPLEX!!UPGRADED LARGE 2 BEDROOMS & 2 FULL BATHS. WATER BAY VIEW FROM 2 BALCONIES IN THE NORTH TOWER. 1565 SQ FT. UPDATED OPEN KITCHEN WITH NEW SS APPLIANCES. HUGE WALKING CLOSETS. COVERED PARKING. 2 POOLS. STORAGE. EXCELLENT LOCATION AND SCHOOLS DISTRICT. NEAR AVENTURA MALL, HOUSE OF WORDSHIP AND BEACHES. MARINA AVAILABLE WITH UNOBSTRUCTED OCEAN ACCESS. . Unit des NOT come with a private boat slip but we do have a private marina on site and marinas available for rent and sale. Maintenance fees covers all services like WIFI, basic cable, pest control, hot water, Service contract with TOTAL APPLIANCES & REPAIR. ( unit just got a renter with a y
Key facts
- $1,150 HOA
- Garage
- Community pool
Neighborhood map
What this means for you Summary
Snapshot
- This is a 2-bed/2.0-bath condo listed at $230k.
Deal economics
- At list price, monthly cash flow is $648 ($8k/yr) — positive.
- The deal already cash-flows at list — no discount required.
- Meets the 1% rule at list price ($4k rent vs $230k).
- Recommended offer: $202k (12.0% below list) — sets the bar for market timing.
- Cap rate 9.7% vs local median 2.6% in Aventura — top-decile yield for the area; either an underpriced asset or a hidden risk that comps aren't pricing in. Stress-test before assuming the spread holds.
Location & tenants
- Location reads 80/100 on livability (#127 in FL, #1,834 nationally) — a professional / high-income tenant draw. Strengths: schools A+, health & safety A+, amenities A; Watch: crime D+, cost of living F.
- Miami-Dade (suburban): math 45% / reading 54% proficiency, ranked #40 of 73 in FL (top 55%) — families likely to look elsewhere, expect single-tenant / working-renter base with shorter leases; 64% free/reduced lunch — lower-income household profile, screen leases tightly.
- Market conditions: Rents flat; 1870 active listings in the ZIP; 10,051 units permitted in Miami-Dade County in 2024 (7,758 in 5+ unit buildings).
- At $4,287/mo this rent would consume 77% of the median local household income ($67k/yr) (locally 3106% of renters already pay >50% of income on rent) — very limited rent-growth headroom before tenants either downsize or default.
Forward outlook
- In year one you build about $3k of equity ($2k loan paydown + $1k appreciation (0.5% local appreciation)).
- Miami-Dade County population projected at +28% by 2050 — long-run rental-demand tailwind backs the buy-and-hold thesis.
- At projected returns (0.5% appreciation + 0.9% rent growth), your $64k cash investment doubles in ~7 years — after that, you're playing with house money.
- By year 10, paydown + projected appreciation supports a ~$32k cash-out refi (75% LTV) — recoverable capital for the next deal without selling this one.
Negotiation context
- It's been on market 248 days — a 12% lower offer ($202k) is reasonable based on typical stale-listing flexibility.
Risks & watch-outs
- Watch-outs: HOA is 27% of rent.
Questions for the listing agent
- It's been on market 248 days. Have you received any prior offers? Is the seller open to a 12% concession, seller financing, or rate buy-down credit?
- Built in 1971 — when were the roof, HVAC, electrical panel, plumbing, and water heater last replaced?
- What does the HOA fee cover, when was the last increase, and are there any pending special assessments or reserve-fund shortfalls?
- Any open or pending special assessments — roof, HVAC, plumbing, elevator, façade? What's the per-unit balance and payoff schedule, and is the seller paying it off at close or rolling it to the buyer?
- Why hasn't it sold? Are there any deal-killer items the seller is aware of (foundation, flood, title, zoning, code violations)?
- Is there a deadline driving the sale (1031 exchange, divorce, estate, relocation)? That informs how much negotiation room exists.
- Schools are A-rated — typically a magnet for longer-tenancy family renters. What's the average tenant stay here, and is there a school-zone premium baked into asking?
- Crime grade is D in this area — have there been break-ins, vandalism, or insurance claims at this property in the last 3 years? What carrier currently insures it and at what premium?
- What's the average days-on-market for RENTAL listings here right now (not sales)? A rising rental-DOM trend means longer vacancies and softer asking-rent achievability than the comps imply.
- What's the recent tenant-quality profile in this submarket — average credit score on applications, eviction rate, late-payment / NSF rate, and stable-employment percentage? A property-management company in the area should have these aggregated.
- How much new apartment / multifamily construction is in the pipeline within 1–3 miles? Heavy new supply (>2% of stock underway) typically softens rents 12–24 months out; light construction supports rent growth.
Investment metrics
- 1% rule
- 1.86% ✓
- Cap rate
- 9.67%
- Cash-on-cash
- 12.07%
- DSCR
- 1.54
- GRM
- 4.5
CMA / ARV
No comps found within radius.
Projected returns pro-forma
0.53% appreciation · 0.94% rent growth · sell at horizon
- IRR
- 10.4%
- Equity multiple
- 1.50×
- Total profit
- $32,344
- Equity at exit
- $72,877
- IRR
- 12.7%
- Equity multiple
- 2.35×
- Total profit
- $86,947
- Equity at exit
- $92,648
Cash invested: $64,372 (down + closing). Projections, not guarantees.
Landlord ↔ Tenant lean methodology
- Overall (STATE)
- 87 Strongly Landlord-Friendly
- State Florida
- 87 Strongly Landlord-Friendly · R+3
- County
- — inherits STATE
- City
- — inherits STATE
ZIP-level market 33160
- Home prices YoY
- 0.2%
- Rents YoY
- 0.9%
- Active inventory
- 1870
- Price-to-rent
- 4.5×
Monthly cashflow live
- Estimated rent
- $4,287 medium interval (Pro) →
- Mortgage (P&I)
- −$1,206
- Tax est. 1.5%
- −$287 /mo · $3,448/yr
- Insurance
- −$96
- HOA
- −$1,150
- Vacancy / Maint / Mgmt
- −$900
- Net cashflow
- $648
Break-even live
UW: 25.0% down · 7.5% · 30yr · 1.5% tax · 5.0% vac · 8.0% maint · 8.0% mgmt
Financing live
Cash to close
- Down payment
- $57,475
- Closing costs
- $6,897
- Reserves months
- —
- Total cash needed
- —
Loan-product check · same deal, 3 products live
Conventional
25% down · 7.5% · 30yr
- Down + closing
- —
- Monthly P&I
- —
- Monthly cashflow
- —
- DSCR
- —
- Eligible?
- —
Personal DTI + credit; lowest rate.
DSCR
20% down · 8.5% · 30yr
- Down + closing
- —
- Monthly P&I
- —
- Monthly cashflow
- —
- DSCR
- —
- Eligible?
- —
No personal income docs; deal must DSCR.
Hard money
10% down · 12.0% · 12mo
- Down + closing
- —
- Monthly P&I
- —
- Monthly cashflow
- —
- DSCR
- —
- Eligible?
- —
Short-term bridge; refi at stabilization.
HOA detail condo
- Monthly dues
- $1,150 · $13,800/yr
- Likely covers
- waterinternetcablepool
- Assessments
- None detected in remarks — confirm with the listing agent.
Listing history 2 events
-
2026-06-18remarks 691-char remark
-
2026-06-18$229,900 Active 248 DOM
ⓘ Source: listings_history table (triggers on properties + properties_extension) + one-shot
backfill from property_details.listing_events for pre-trigger history.
Nearby sold comps map
Loading sold comps map…
Walkable amenities ~0.75 mi
Loading nearby amenities…
Taxation est. · year 1
- Rental income
- $51,440
- − Mortgage interest
- −$12,878
- − Property taxes
- −$3,448
- − Insurance
- −$1,150
- − Repairs & maintenance
- −$4,115
- − Management
- −$4,115
- − HOA
- −$13,800
- − Depreciation
- −$6,688
- Taxable income
- $5,246
- Est. tax owed @ 24.0%
- −$1,259
- After-tax cash flow
- $6,513/yr
For passive investors: Depreciation is non-cash, so a rental often shows a tax loss while cash-flowing — sheltering income. Rental losses are passive: they offset passive income freely, and up to $25,000/yr can offset ordinary (W-2) income if you actively participate and your MAGI is under $100k (phasing out to $0 by $150k); unused losses carry forward. On sale, claimed depreciation is recaptured at up to 25%, and gains may owe capital-gains tax (a 1031 exchange can defer both). Figures are a year-1 estimate at your 24.0% rate — not tax advice; consult a CPA.
Schools (NCES district)
- District
- Miami-Dade
- NCES district ID
- 1200390
- Math proficiency
- 45% ▼ -16.00%
- Reading proficiency
- 54% ▼ -5.00%
- Median HH income
- $43,928
- Composite
- 41.76/100
- National rank
- #3397
- State rank
- #40 of 73 in FL
Livability — Aventura
- Score
- 80/100
- State rank
- #127
- US rank
- #1834
Category grades
Schools grade is shown separately in the Schools card above.
Census & demographics
- Census place
- Aventura, FL
- County
- Miami-Dade County · 2,697,751 people
- City population
- 34,147
- Metro
- Miami-Fort Lauderdale-Pompano Beach, FL
- Population (ZIP)
- 43,718
- Household income
- $67,040
- Rent vs Own
- Severe rent burden
- 3106.0
Population outlook (Miami-Dade County) Hauer SSP2
- Today (2025)
- 3,126,439 people
- By 2030
- 3,325,765 · +6.4%
- By 2040
- 3,697,561 · +18.3%
- By 2050
- 4,012,134 · +28.3%
- By 2075
- 4,605,612 · +47.3%
- By 2100
- 4,866,598 · +55.7%
Race, ethnicity, and origin ACS 2023
- Neighborhood character
- Diverse neighborhood (Simpson 0.59)
- Race & ethnicity
- Hispanic / Latino 46% White 44% Two or more races 27% Black 4% Asian 2%
- Hispanic origin (detail)
- Mexican 1% Puerto Rican 3% Cuban 8% Dominican 1% Salvadoran 4%
- Common ancestry
- Scotch-Irish 8% Hispanic 3% Subsaharan African 3%
- Foreign-born
- 61% · Canada, Jamaica, Dominican Republic
- Languages at home
- 29% English-only · Spanish 45% Russian/Polish/Slavic 12% Other Indo-European 5%
Political lean MEDSL · Miami-Dade
- 2024 margin
- R (+11.4) · D 43.9% · R 55.4%
- 2008→2024 swing
- -27.6pp toward R · 2008: 16.1pp · 2024: -11.4pp
- All cycles
- 2024: R+11.4 2020: D+7.3 2016: D+29.6 2012: D+23.7 2008: D+16.1
Not yet ingested
- Civics
- —
Market trends
- HPI YoY
- ▲ 0.53%
- Current HPI
- 284.9293
- Rent YoY
- ▲ 0.94%
- Metro
- Miami-Fort Lauderdale-Pompano Beach, FL
- State GDP YoY
- ▲ 3.28%
- F500 in state
- 36
Industry mix (Fortune 500 HQ in FL)
| Industry | F500 HQs | Revenue |
|---|---|---|
| Industrial Technology | 2 | $29B |
|
||
| Insurance | 2 | $17B |
|
||
| Retail | 1 | $60B |
|
||
| Technology Distribution | 1 | $58B |
|
||
| Homebuilding | 1 | $35B |
|
||
| Technology Manufacturing | 1 | $35B |
|
||
Cash-flow waterfall
monthlySold comps — $/sqft
last 12 mo · ≤1 miLoading sold comps…