 Duplex
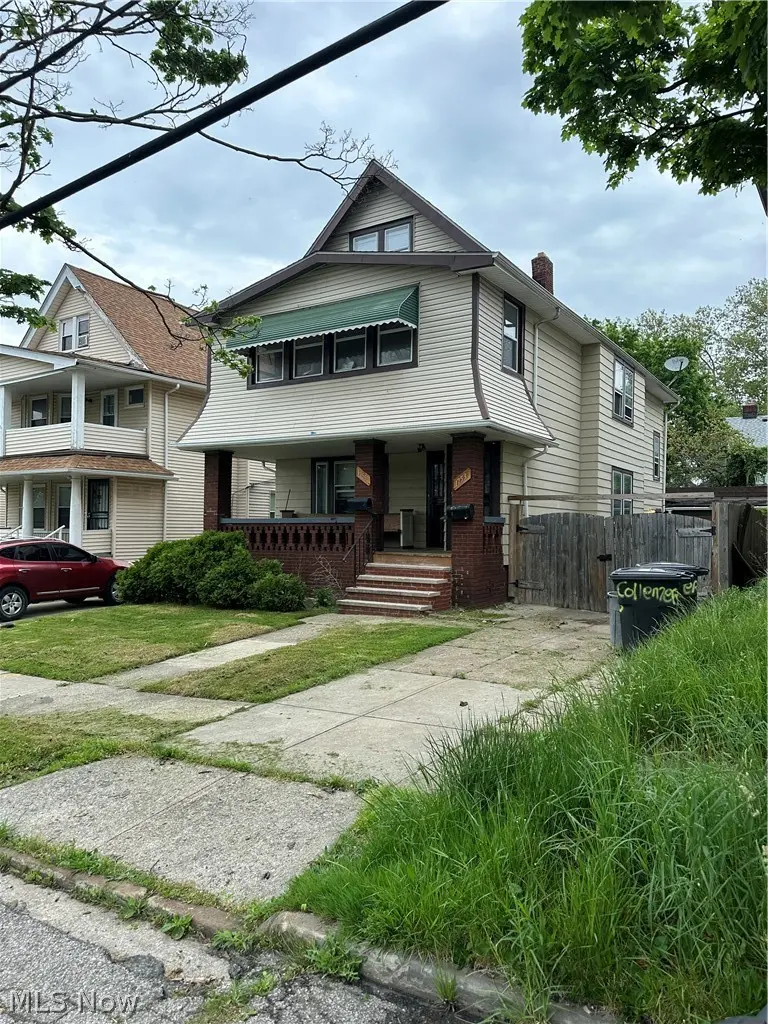
1753 Collamer Ave · East Cleveland, OH
Flood risk 1/10 · Minimal
- FEMA flood zone
- X (unshaded)
- Chance of flooding over 30 yrs
- 0.0%
- Est. flood insurance / yr
- $473 – $860
Fire risk 1/10 · Minimal
- Est. fire insurance / yr
- $713 – $1,323
Heat risk 3/10 · Minor
- Hot days now (above 95°F)
- 7 days/yr
- Hot days in 30 yrs
- 17 days/yr
Wind risk 1/10 · Minimal
- Chance of severe wind over 30 yrs
- —
Air-quality risk 3/10 · Minor
- Unhealthy air days now
- 3 days/yr
- Unhealthy air days in 30 yrs
- 5 days/yr
Risk factors via First Street. Map © Google.
Why this score? — see what drove the C+ grade
The composite is a weighted blend of 9 inputs, each scored 0–100. Each bar is that input's sub-score; the figure is the points it added to the 100-point composite (weight × sub-score).
- Cash flow +30.0/30.0
- 1% rule +10.0/10.0
- DSCR +10.0/10.0
- Rent growth +3.8/5.0
- Livability +3.3/5.0
- Condition / age +2.5/5.0
- Schools +0.7/10.0
- ARV discount +0.0/15.0
- Appreciation +0.0/10.0
$114,900
🖨 Deal sheet (PDF) 📄 Offer letter ✓ Due diligence
Multi-family units
County records classify this as Multi-Family (2-4 Unit). Listing-text estimate: 2 units. confirmed
Listing remarks MLS
This updated duplex is a fantastic investment opportunity! Featuring a newer roof, windows, and hot water tanks, this property is move-in ready and hassle-free. Plenty of new updates throughout the home. Downstairs Unit: Currently vacant and previous tenant was paying $850/month. Upstairs Unit: Eden tenant paying $950 per month Located in East Cleveland, this property offers strong rental income potential with minimal maintenance. Don't miss out on this chance to add a high-performing property to your portfolio!
Key facts
- Newer roof
- New hot water tanks
- New windows
Tags
Neighborhood map
What this means for you Summary
Snapshot
- This is a 2 × 2-bed/1.5-bath units multifamily listed at $115k.
Deal economics
- At list price, monthly cash flow is $621 ($7k/yr) — positive. Per door: $311/mo.
- The deal already cash-flows at list — no discount required.
- Meets the 1% rule at list price ($2k rent vs $115k).
- Recommended offer: $101k (12.0% below list) — sets the bar for market timing.
- Cap rate 12.8% vs local median 17.4% in East Cleveland — below-typical yield; the buyer is paying a premium for something (appreciation thesis, condition, location) that the cap rate doesn't capture.
Location & tenants
- Location reads 66/100 on livability (#650 in OH) — a middle-class / working-renter tenant base. Strengths: commute A+, cost of living A+, health & safety A+; Watch: schools F, crime F, employment F.
- East Cleveland City School District (suburban): math 4% / reading 17% proficiency, ranked #652 of 656 in OH (top 99%) — low school quality limits family demand, transient renter base, plan for 1-2y turnover; 92% free/reduced lunch — lower-income household profile, screen leases tightly.
- Market conditions: Rents rising fast (+5.2%/yr); 101 active listings in the ZIP; 19 comparable units currently listed for rent nearby; rentals at typical pace (median 17d on market — plan ~3-4 weeks tenant-placement turnaround); lower-income renter base — watch delinquency; 1,441 units permitted in Cuyahoga County in 2024 (700 in 5+ unit buildings).
- At $1,752/mo this rent would consume 73% of the median local household income ($29k/yr) (locally 1702% of renters already pay >50% of income on rent) — very limited rent-growth headroom before tenants either downsize or default.
Forward outlook
- Local home prices are declining (-3.0%/yr); year-one equity from $794 of loan paydown is wiped out by about $3k of value loss. Plan a longer hold.
- Cuyahoga County population projected to shrink 8% by 2050 — rents likely to lag national; underwrite the cash flow, not the appreciation.
- At projected returns (-3.0% appreciation + 5.2% rent growth), your $32k cash investment doubles in ~5 years — after that, you're playing with house money.
Negotiation context
- It's been on market 131 days — a 12% lower offer ($101k) is reasonable based on typical stale-listing flexibility.
- 9 sale attempts since 24y ago with the ask held roughly flat each time — persistent listings suggest the price (not the market) is what's stuck; bring a comps-based counter.
- Current owner paid $92k; 25% above their basis — modest negotiation headroom, anchor on the comps not their cost.
Risks & watch-outs
- Watch-outs: built in 1916 — expect roof / HVAC / electrical / plumbing capex.
Questions for the listing agent
- It's been on market 131 days. Have you received any prior offers? Is the seller open to a 12% concession, seller financing, or rate buy-down credit?
- Can we see the unit-by-unit rent roll, current vacancy, and any below-market leases? What's the average tenancy length?
- What capital expenditures (roof, boiler, parking lot, exteriors) have been made in the last 5 years, and what's planned in the next 2?
- Built in 1916 — when were the roof, HVAC, electrical panel, plumbing, and water heater last replaced?
- Why hasn't it sold? Are there any deal-killer items the seller is aware of (foundation, flood, title, zoning, code violations)?
- Is there a deadline driving the sale (1031 exchange, divorce, estate, relocation)? That informs how much negotiation room exists.
- Schools are F-rated, which usually means shorter tenancies and higher turnover. Who's the typical renter profile here, and what's been the actual vacancy rate?
- Crime grade is F in this area — have there been break-ins, vandalism, or insurance claims at this property in the last 3 years? What carrier currently insures it and at what premium?
- What's the average days-on-market for RENTAL listings here right now (not sales)? A rising rental-DOM trend means longer vacancies and softer asking-rent achievability than the comps imply.
- What's the recent tenant-quality profile in this submarket — average credit score on applications, eviction rate, late-payment / NSF rate, and stable-employment percentage? A property-management company in the area should have these aggregated.
- How much new apartment / multifamily construction is in the pipeline within 1–3 miles? Heavy new supply (>2% of stock underway) typically softens rents 12–24 months out; light construction supports rent growth.
Investment metrics
- 1% rule
- 1.52% ✓
- Cap rate
- 12.78%
- Cash-on-cash
- 23.16%
- DSCR
- 2.03
- GRM
- 5.5
CMA / ARV
- ARV (median comp)
- $78,443
- List price
- $114,900
- Delta
- 46.48%
- Verdict
- OVERPRICED
- Comps
- 20 within 1.0 mi
Show comp detail 5 sales within ~0.75 mi
| Address | Dist | Beds/Ba | Sqft | Sold | Price | $/sf | Match |
|---|---|---|---|---|---|---|---|
| 872 Eloise Dr | 0.60mi | 4/2.0 | 1,872 (-3%) | 10mo | $125,000 | $67 | 59 |
| 14810 Shaw Ave | 0.42mi | 4/2.0 | 1,698 (-12%) | 6mo | $35,000 | $21 | 55 |
| 864 Eloise Dr | 0.59mi | 4/2.0 | 1,872 (-3%) | 18mo | $84,256 | $45 | 53 |
| 14310 Potomac Ave | 0.72mi | 5/2.0 (+1) | 1,982 (+3%) | 12mo | $36,000 | $18 | 46 |
| 894 Helmsdale Rd | 0.73mi | 4/2.0 | 2,152 (+12%) | 8mo | $93,000 | $43 | 39 |
Match score weights: distance 35% · size 25% · config 20% · recency 20%. Top-matched comps best support the ARV.
Projected returns pro-forma
-3.0% appreciation · 5.16% rent growth · sell at horizon
- IRR
- 18.5%
- Equity multiple
- 1.77×
- Total profit
- $24,831
- Equity at exit
- $17,132
- IRR
- 28.4%
- Equity multiple
- 3.77×
- Total profit
- $89,266
- Equity at exit
- $9,934
Cash invested: $32,172 (down + closing). Projections, not guarantees.
Landlord ↔ Tenant lean methodology
- Overall (STATE)
- 73 Landlord-Friendly
- State Ohio
- 73 Landlord-Friendly · R+6
- County
- — inherits STATE
- City
- — inherits STATE
ZIP-level market 44112
- Rents YoY
- 5.2%
- Active inventory
- 101
- Price-to-rent
- 10.9×
Monthly cashflow live
- Estimated rent
- $1,752 high interval (Pro) →
- Mortgage (P&I)
- −$603
- Tax from tax record
- −$113 /mo · $1,352/yr
- Insurance
- −$48
- HOA
- −$0
- Vacancy / Maint / Mgmt
- −$368
- Net cashflow
- $621
Break-even live
Sensitivity live
| Price | -10% $686 | -5% $654 | +0% $621 | +5% $588 | +10% $556 |
|---|---|---|---|---|---|
| Rent | -10% $483 | -5% $552 | +0% $621 | +5% $690 | +10% $759 |
| Rate | -1.0pp $679 | -0.5pp $650 | base $621 | +0.5pp $591 | +1.0pp $561 |
2-unit breakdown (identical units grouped — click to expand)
| Units | Beds | Baths | Est. rent |
|---|---|---|---|
| 2× units | 2 | 1.5 | $1,752 |
| #1 | 2 | 1.5 | $876 |
| #2 | 2 | 1.5 | $876 |
| Total (2 units) | $1,752 | ||
UW: 25.0% down · 7.5% · 30yr · 1.5% tax · 5.0% vac · 8.0% maint · 8.0% mgmt
Financing live
Cash to close
- Down payment
- $28,725
- Closing costs
- $3,447
- Reserves months
- —
- Total cash needed
- —
Loan-product check · same deal, 3 products live
Conventional
25% down · 7.5% · 30yr
- Down + closing
- —
- Monthly P&I
- —
- Monthly cashflow
- —
- DSCR
- —
- Eligible?
- —
Personal DTI + credit; lowest rate.
DSCR
20% down · 8.5% · 30yr
- Down + closing
- —
- Monthly P&I
- —
- Monthly cashflow
- —
- DSCR
- —
- Eligible?
- —
No personal income docs; deal must DSCR.
Hard money
10% down · 12.0% · 12mo
- Down + closing
- —
- Monthly P&I
- —
- Monthly cashflow
- —
- DSCR
- —
- Eligible?
- —
Short-term bridge; refi at stabilization.
Rent comps 19 comps
| Address | Beds | Baths | Sqft | Rent | $/sqft | DOM | Units | Dist |
|---|---|---|---|---|---|---|---|---|
| 16000 Terrace Rd Cleveland, OH | 1.0–3.0 | 1.0–2.0 | 1000 | $1,210 | $1.21 | 2d | 39 | 0.26mi |
| 910 Dresden Rd Cleveland, OH | 4.0 | 2.0 | 1839 | $1,800 | $0.98 | 17d | 1 | 0.57mi |
| 15801 Hazel Rd Cleveland, OH | 3.0 | 1.5 | 1908 | $1,550 | $0.81 | 17d | 1 | 0.70mi |
| 821 Nela View Rd Cleveland, OH | 4.0 | 2.5 | 2178 | $2,100 | $0.96 | 8d | 1 | 0.77mi |
| 915 Nela View Rd Cleveland, OH | 4.0 | 1.0 | 1300 | $2,600 | $2.00 | 17d | 1 | 0.78mi |
| 14200 Scioto Ave Cleveland, OH | 3.0 | 1.0 | 1256 | $1,350 | $1.07 | 17d | 1 | 0.82mi |
| 983 Greyton Rd Cleveland, OH | 3.0 | 2.0 | 1457 | $1,495 | $1.03 | 17d | 1 | 0.89mi |
| 1024 Greyton Rd Cleveland, OH | 5.0 | 2.5 | 1800 | $2,500 | $1.39 | 44d | 1 | 0.90mi |
| 963 Selwyn Rd Cleveland, OH | 4.0 | 1.0 | 1300 | $2,650 | $2.04 | 2d | 1 | 0.96mi |
| 3430 Winsford Rd Cleveland, OH | 4.0 | 1.5 | 1800 | $1,590 | $0.88 | 17d | 1 | 0.97mi |
| 3337 Sylvanhurst Rd Cleveland, OH | 3.0 | 1.0 | 1334 | $1,800 | $1.35 | 8d | 1 | 1.01mi |
| 1007 Elbon Rd Cleveland, OH | 3.0 | 1.0 | 1386 | $1,400 | $1.01 | 11d | 1 | 1.13mi |
| 3406 Henderson Rd Cleveland, OH | 4.0 | 1.5 | 1343 | $2,250 | $1.68 | 17d | 1 | 1.13mi |
| 1035 Elbon Rd Cleveland, OH | 4.0 | 1.5 | 1304 | $1,675 | $1.28 | 17d | 1 | 1.16mi |
| 1099 Woodview Rd Cleveland, OH | 4.0 | 1.0 | 1500 | $2,500 | $1.67 | 2d | 1 | 1.17mi |
| 994 Yellowstone Rd Cleveland, OH | 3.0 | 2.0 | 1475 | $1,395 | $0.95 | 3d | 1 | 1.24mi |
| 12819 Edmonton Ave Cleveland, OH | 4.0 | 1.0 | 1423 | $1,795 | $1.26 | 17d | 1 | 1.25mi |
| 2401 N Taylor Rd Cleveland, OH | 3.0 | 1.0 | 1347 | $1,325 | $0.98 | 8d | 1 | 1.34mi |
| 3802 Princeton Blvd Cleveland, OH | 3.0 | 1.5 | 1656 | $2,275 | $1.37 | 2d | 1 | 1.43mi |
Listing history 44 events
-
2026-06-21days on market $114,900 Active 131 DOM
-
2026-06-18days on market $114,900 Active 128 DOM
-
2026-06-17days on market $114,900 Active 127 DOM
-
2026-06-16days on market $114,900 Active 126 DOM
-
2026-06-15days on market $114,900 Active 125 DOM
-
2026-06-13days on market $114,900 Active 123 DOM
-
2026-06-13days on market $114,900 Active 122 DOM
-
2026-06-09days on market $114,900 Active 119 DOM
-
2026-06-08days on market $114,900 Active 118 DOM
-
2026-06-07days on market $114,900 Active 117 DOM
-
2026-06-05days on market $114,900 Active 114 DOM
-
2026-06-03days on market $114,900 Active 113 DOM
-
2026-06-02days on market $114,900 Active 112 DOM
-
2026-06-01days on market $114,900 Active 111 DOM
-
2026-05-31days on market $114,900 Active 110 DOM
-
2026-05-05price $114,900 517-char remark
Show marketing remark (517 chars)
This updated duplex is a fantastic investment opportunity! Featuring a newer roof, windows, and hot water tanks, this property is move-in ready and hassle-free. Plenty of new updates throughout the home. Downstairs Unit: Currently vacant and previous tenant was paying $850/month. Upstairs Unit: Eden tenant paying $950 per month Located in East Cleveland, this property offers strong rental income potential with minimal maintenance. Don't miss out on this chance to add a high-performing property to your portfolio!
-
2026-02-05$119,900 Active 517-char remark
Show marketing remark (517 chars)
This updated duplex is a fantastic investment opportunity! Featuring a newer roof, windows, and hot water tanks, this property is move-in ready and hassle-free. Plenty of new updates throughout the home. Downstairs Unit: Currently vacant and previous tenant was paying $850/month. Upstairs Unit: Eden tenant paying $950 per month Located in East Cleveland, this property offers strong rental income potential with minimal maintenance. Don't miss out on this chance to add a high-performing property to your portfolio!
-
2025-09-27price $114,900
-
2025-07-15price $119,000
-
2025-06-30historical
-
2025-06-17price $119,000
-
2025-05-15$129,999 Active
-
2021-07-27soldstatus $92,000
-
2021-07-23soldstatus $92,000 Closed
-
2021-05-10status Pending
-
2021-05-03$79,900 Active
-
2020-09-17historical
-
2020-08-14$72,500 Active
-
2017-05-02soldstatus $14,929 Sold
-
2017-03-16status Pending
-
2017-03-13historical
-
2017-03-01price $9,500
-
2017-01-02$10,500 Active
-
2012-12-31historical
-
2012-04-20$55,000
-
2010-11-15historical
-
2009-11-23$50,000
-
2004-06-22historical
-
2003-12-22$80,000
-
2003-05-19historical
-
2003-03-14soldstatus $65,000
-
2002-05-20$70,000
-
1987-04-30soldstatus $42,900
-
1986-10-01soldstatus $15,000
ⓘ Source: listings_history table (triggers on properties + properties_extension) + one-shot
backfill from property_details.listing_events for pre-trigger history.
Tax reassessment forecast OH · Partial reset (capped growth)
- Current annual tax
- $1,352 · $113/mo
- Projected year-2 tax
- $1,572 · $131/mo
- Expected delta
- +$220/yr (+$18/mo · 16.3%)
ⓘ Screening estimate from a state-policy table — verify with the county assessor before closing.
Climate risk First Street
- Flood 1/10 Low FEMA zone X (unshaded) · 0% chance over 30 yrs
- Wildfire 1/10 Low
- Heat 3/10 Moderate 7 d/yr ≥95°F today · 17 d/yr by 30 yrs out
- Wind 1/10 Low
- Air quality 3/10 Moderate 3 unhealthy d/yr today · 5 by 30 yrs out
Nearby sold comps map
Loading sold comps map…
Walkable amenities ~0.75 mi
Loading nearby amenities…
Taxation est. · year 1
- Rental income
- $21,024
- − Mortgage interest
- −$6,436
- − Property taxes
- −$1,352
- − Insurance
- −$574
- − Repairs & maintenance
- −$1,682
- − Management
- −$1,682
- − Depreciation
- −$3,343
- Taxable income
- $5,955
- Est. tax owed @ 24.0%
- −$1,429
- After-tax cash flow
- $6,023/yr
For passive investors: Depreciation is non-cash, so a rental often shows a tax loss while cash-flowing — sheltering income. Rental losses are passive: they offset passive income freely, and up to $25,000/yr can offset ordinary (W-2) income if you actively participate and your MAGI is under $100k (phasing out to $0 by $150k); unused losses carry forward. On sale, claimed depreciation is recaptured at up to 25%, and gains may owe capital-gains tax (a 1031 exchange can defer both). Figures are a year-1 estimate at your 24.0% rate — not tax advice; consult a CPA.
Schools (NCES district)
- District
- East Cleveland City School District
- NCES district ID
- 3904390
- Math proficiency
- 4% ▼ -16.00%
- Reading proficiency
- 17% ▼ -13.00%
- Median HH income
- $22,726
- Composite
- 7.38/100
- National rank
- #9954
- State rank
- #652 of 656 in OH
Livability — East Cleveland
- Score
- 66/100
- State rank
- #650
- US rank
- #11510
Category grades
Schools grade is shown separately in the Schools card above.
Census & demographics
- Census place
- East Cleveland, OH
- County
- Cuyahoga County · 1,090,369 people
- City population
- 17,848
- Metro
- Cleveland-Elyria, OH
- Population (ZIP)
- 17,848
- Household income
- $28,799
- Rent vs Own
- Severe rent burden
- 1702.0
Population outlook (Cuyahoga County) Hauer SSP2
- Today (2025)
- 1,244,621 people
- By 2030
- 1,230,093 · -1.2%
- By 2040
- 1,189,108 · -4.5%
- By 2050
- 1,145,706 · -7.9%
- By 2075
- 1,076,557 · -13.5%
- By 2100
- 978,987 · -21.3%
Race, ethnicity, and origin ACS 2023
- Neighborhood character
- Predominantly Black (89%)
- Race & ethnicity
- Black 89% White 7% Two or more races 2% Hispanic / Latino 1%
- Common ancestry
- Lithuanian 1%
- Foreign-born
- 4% · Canada
- Languages at home
- 93% English-only · French/Haitian/Cajun 3% Spanish 2% Russian/Polish/Slavic 1%
Political lean MEDSL · Cuyahoga
- 2024 margin
- Solid D (+31.5) · D 65.4% · R 33.9%
- 2008→2024 swing
- -7.4pp toward R · 2008: 38.9pp · 2024: 31.5pp
- All cycles
- 2024: D+31.5 2020: D+34.1 2016: D+35.0 2012: D+38.7 2008: D+38.9
Not yet ingested
- Civics
- —
Market trends
- HPI YoY
- ▼ -115.61%
- Current HPI
- 67.2162
- Rent YoY
- ▲ 5.16%
- Metro
- Cleveland-Elyria, OH
- State GDP YoY
- ▲ 1.98%
- F500 in state
- 48
Industry mix (Fortune 500 HQ in OH)
| Industry | F500 HQs | Revenue |
|---|---|---|
| Insurance | 3 | $145B |
|
||
| Industrial Machinery | 3 | $49B |
|
||
| Financial Services | 3 | $24B |
|
||
| Consumer Goods | 2 | $93B |
|
||
| Aerospace / Defense | 2 | $47B |
|
||
| Utilities | 2 | $33B |
|
||
Price history
+666.0% since first listed29 events — show timeline
- 2026-05-05 Price Changed $114,900 MLSNOW
- 2026-02-05 Listed $119,900 MLSNOW
- 2025-09-27 Price Changed $114,900 MLSNOW
- 2025-07-15 Price Changed $119,000 MLSNOW
- 2025-06-30 Listing Removed — MLSNOW
- 2025-06-17 Price Changed $119,000 MLSNOW
- 2025-05-15 Listed $129,999 MLSNOW
- 2021-07-27 Sold (Public Records) $92,000 Public Records
- 2021-07-23 Sold (MLS) $92,000 MLSNOW
- 2021-05-10 Pending — MLSNOW
- 2021-05-03 Listed $79,900 MLSNOW
- 2020-09-17 Listing Removed — MLSNOW
- 2020-08-14 Listed $72,500 MLSNOW
- 2017-05-02 Sold (MLS) $14,929 MLSNOW
- 2017-03-16 Pending — MLSNOW
- 2017-03-13 Listing Removed — MLSNOW
- 2017-03-01 Price Changed $9,500 MLSNOW
- 2017-01-02 Listed $10,500 MLSNOW
- 2012-12-31 Listing Removed — MLSNOW
- 2012-04-20 Listed $55,000 MLSNOW
- 2010-11-15 Listing Removed — MLSNOW
- 2009-11-23 Listed $50,000 MLSNOW
- 2004-06-22 Listing Removed — MLSNOW
- 2003-12-22 Listed $80,000 MLSNOW
- 2003-05-19 Listing Removed — MLSNOW
- 2003-03-14 Sold (Public Records) $65,000 Public Records
- 2002-05-20 Listed $70,000 MLSNOW
- 1987-04-30 Sold (Public Records) $42,900 Public Records
- 1986-10-01 Sold (Public Records) $15,000 Public Records
Property tax history
+0.6%/yrLatest (2025): $1,352 · +0.0% YoY. Source: county tax records.
Cash-flow waterfall
monthlySold comps — $/sqft
last 12 mo · ≤1 miLoading sold comps…