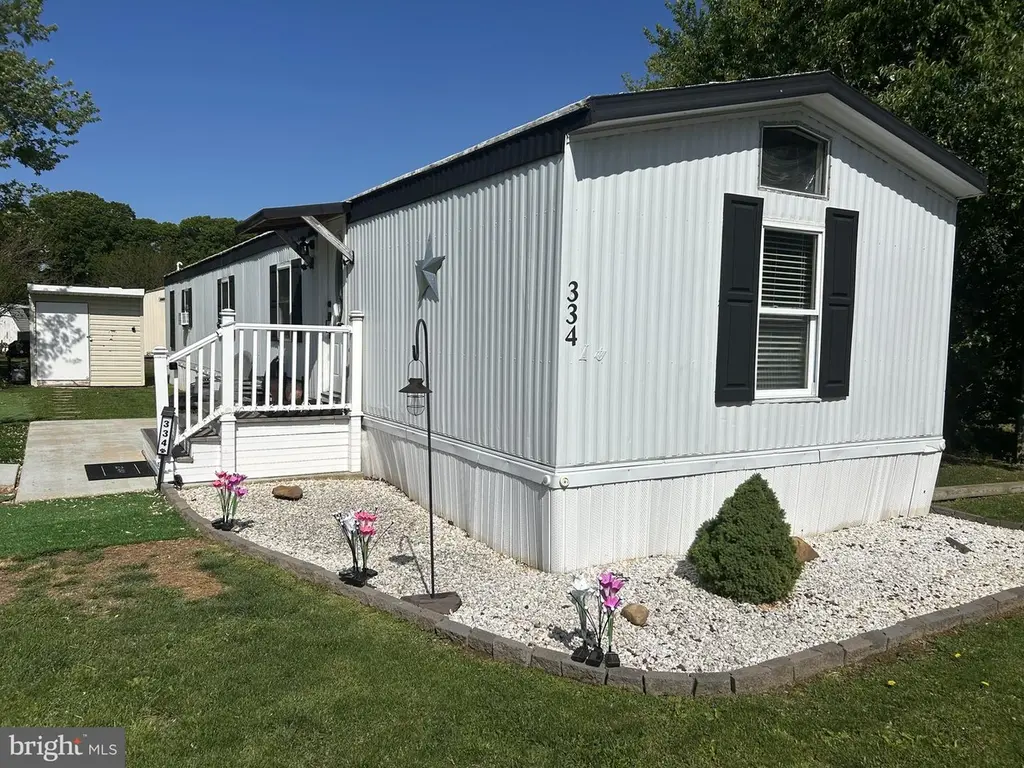
334 Hostetter Blvd · Middletown, DE
Flood risk No data
- FEMA flood zone
- —
- Chance of flooding over 30 yrs
- —
- Est. flood insurance / yr
- —
Fire risk No data
- Est. fire insurance / yr
- —
Heat risk No data
- Hot days now (above threshold)
- —
- Hot days in 30 yrs
- —
Wind risk No data
- Chance of severe wind over 30 yrs
- —
Air-quality risk No data
- Unhealthy air days now
- —
- Unhealthy air days in 30 yrs
- —
Risk factors via First Street. Map © Google.
Why this score? — see what drove the C+ grade
The composite is a weighted blend of 9 inputs, each scored 0–100. Each bar is that input's sub-score; the figure is the points it added to the 100-point composite (weight × sub-score).
- Cash flow +30.0/30.0
- 1% rule +10.0/10.0
- DSCR +10.0/10.0
- Schools +4.2/10.0
- Livability +3.6/5.0
- Rent growth +2.8/5.0
- Condition / age +2.5/5.0
- ARV discount +0.0/15.0
- Appreciation +0.0/10.0
$92,900
🖨 Deal sheet (PDF) 📄 Offer letter ✓ Due diligence
Listing remarks
Welcome to 334 Hostetter Blvd, your dream residence situated in the heart of Middletown, Delaware. Enhanced by its sought-after location within the prestigious Appoquinimink School District. Pride of ownership shows. The property offers vinyl plank flooring throughout the home. Efficient and comfortable lifestyle with its 3 well-proportioned bedrooms and 2 full bathrooms spread across a single level living space. The allure and functionality of the home are immediately apparent as you step onto the trek deck and enter into a generously scaled living room. Transition into the well-equipped kitchen where you’re greeted by glamorous granite countertops and stainless-steel amenities, comp
Key facts
- 2 parking spots
- Built 1986
- Listed 38 days
Property features AI
Finance
- HOA & community: Land lease community; Annual land lease fee of $908; Approximately 3 years remaining on land lease
Exterior
- Parking: Driveway parking (2 spaces); Total of 2 garage/parking spaces
- Utilities: Public water; Public sewer; Electric hot water; Electric cooling
- Home design: Manufactured single-wide home; Estimated year/model: 1986; Above-grade living only (no basement)
- Construction: Aluminum siding; Structure type: Manufactured; Other structures noted above and below grade
- Exterior features: Not in a federal flood zone; Located in Village Brook park
Interior
- Kitchen: Kitchen (appliances not specified)
- Bedrooms: 3 bedrooms on the main level
- Flooring: Laminate plank flooring
- Bathrooms: 2 full bathrooms (including 2 full on main level)
- Heating & cooling: 90% forced air heating; Propane heating (leased); Window air conditioning units (electric)
- Interior features: Drywall walls and ceilings; Estimated living area; 5 total rooms
- Laundry & utility: Laundry area (main level)
Neighborhood map
What this means for you Summary
Snapshot
- This is a 3-bed/2.0-bath other listed at $93k.
Deal economics
- At list price, monthly cash flow is $2k ($18k/yr) — positive.
- The deal already cash-flows at list — no discount required.
- Meets the 1% rule at list price ($3k rent vs $93k).
- Recommended offer: $90k (3.0% below list) — sets the bar for market timing.
- Cap rate 25.8% vs local median 3.0% in Middletown — top-decile yield for the area; either an underpriced asset or a hidden risk that comps aren't pricing in. Stress-test before assuming the spread holds.
Location & tenants
- Location reads 71/100 on livability (#17 in DE) — a middle-class / working-renter tenant base. Strengths: employment A+, housing A+, crime A-; Watch: cost of living C-, commute F.
- Appoquinimink School District (rural): math 37% / reading 52% proficiency, ranked #6 of 26 in DE (top 23%) — families likely to look elsewhere, expect single-tenant / working-renter base with shorter leases; only 18% free/reduced lunch — higher-income household profile.
- Zoned schools: Brick Mill Elementary School (math 32% / reading 42%, grade F, #31 of 105 statewide, top 31%, 451 students, 0% FRL); Redding (Louis L.) Middle School (math 23% / reading 50%, grade F, #9 of 36 statewide, top 23%, 618 students, 0% FRL); Middletown High School (math 41% / reading 61%, grade D+, #5 of 40 statewide, top 10%, 1,355 students, 0% FRL) — zoned schools average 0% FRL vs 18% district-wide (18 pts lower); this property's tenant base skews higher-income than the district average.
- Market conditions: Rents rising (+1.1%/yr); 454 active listings in the ZIP; high-income renter base; 1,367 units permitted in New Castle County in 2024 (201 in 5+ unit buildings).
Forward outlook
- Local home prices are declining (-3.0%/yr); year-one equity from $642 of loan paydown is wiped out by about $3k of value loss. Plan a longer hold.
- New Castle County population projected at +9% by 2050 — modest demand growth; plan on rents tracking national, not racing it.
- At projected returns (-3.0% appreciation + 1.1% rent growth), your $26k cash investment doubles in ~2 years — after that, you're playing with house money.
Negotiation context
- It's been on market 38 days — a 3% lower offer ($90k) is reasonable based on typical stale-listing flexibility.
Questions for the listing agent
- It's been on market 38 days. Have you received any prior offers? Is the seller open to a 3% concession, seller financing, or rate buy-down credit?
- Is there a deadline driving the sale (1031 exchange, divorce, estate, relocation)? That informs how much negotiation room exists.
- Schools are B-rated — typically a magnet for longer-tenancy family renters. What's the average tenant stay here, and is there a school-zone premium baked into asking?
- What's the average days-on-market for RENTAL listings here right now (not sales)? A rising rental-DOM trend means longer vacancies and softer asking-rent achievability than the comps imply.
- What's the recent tenant-quality profile in this submarket — average credit score on applications, eviction rate, late-payment / NSF rate, and stable-employment percentage? A property-management company in the area should have these aggregated.
- How much new for-sale + rental construction is in the pipeline within 1–3 miles? Heavy new supply typically softens prices + rents 12–24 months out; constrained supply supports both.
Investment metrics
- 1% rule
- 2.80% ✓
- Cap rate
- 25.80%
- Cash-on-cash
- 69.65%
- DSCR
- 4.10
- GRM
- 3.0
CMA / ARV
- ARV (median comp)
- $79,405
- List price
- $92,900
- Delta
- 16.99%
- Verdict
- OVERPRICED
- Comps
- 13 within 1.0 mi
Projected returns pro-forma
-3.0% appreciation · 1.07% rent growth · sell at horizon
- IRR
- 67.0%
- Equity multiple
- 3.93×
- Total profit
- $76,127
- Equity at exit
- $13,852
- IRR
- 70.7%
- Equity multiple
- 7.55×
- Total profit
- $170,455
- Equity at exit
- $8,032
Cash invested: $26,012 (down + closing). Projections, not guarantees.
Landlord ↔ Tenant lean methodology
- Overall (STATE)
- 70 Landlord-Friendly
- State Delaware
- 70 Landlord-Friendly · D+7
- County
- — inherits STATE
- City
- — inherits STATE
ZIP-level market 19709
- Home prices YoY
- -21.4%
- Rents YoY
- 1.1%
- Active inventory
- 454
- Price-to-rent
- 3.0×
Monthly cashflow live
- Estimated rent
- $2,603 medium interval (Pro) →
- Mortgage (P&I)
- −$487
- Tax from tax record
- −$21 /mo · $250/yr
- Insurance
- −$39
- HOA
- −$0
- Vacancy / Maint / Mgmt
- −$547
- Net cashflow
- $1,510
Break-even live
Sensitivity live
| Price | -10% $1,562 | -5% $1,536 | +0% $1,510 | +5% $1,484 | +10% $1,457 |
|---|---|---|---|---|---|
| Rent | -10% $1,304 | -5% $1,407 | +0% $1,510 | +5% $1,613 | +10% $1,715 |
| Rate | -1.0pp $1,557 | -0.5pp $1,533 | base $1,510 | +0.5pp $1,486 | +1.0pp $1,461 |
UW: 25.0% down · 7.5% · 30yr · 1.5% tax · 5.0% vac · 8.0% maint · 8.0% mgmt
Financing live
Cash to close
- Down payment
- $23,225
- Closing costs
- $2,787
- Reserves months
- —
- Total cash needed
- —
Loan-product check · same deal, 3 products live
Conventional
25% down · 7.5% · 30yr
- Down + closing
- —
- Monthly P&I
- —
- Monthly cashflow
- —
- DSCR
- —
- Eligible?
- —
Personal DTI + credit; lowest rate.
DSCR
20% down · 8.5% · 30yr
- Down + closing
- —
- Monthly P&I
- —
- Monthly cashflow
- —
- DSCR
- —
- Eligible?
- —
No personal income docs; deal must DSCR.
Hard money
10% down · 12.0% · 12mo
- Down + closing
- —
- Monthly P&I
- —
- Monthly cashflow
- —
- DSCR
- —
- Eligible?
- —
Short-term bridge; refi at stabilization.
Listing history 17 events
-
2026-06-21days on market $92,900 Active 38 DOM
-
2026-06-18days on market $92,900 Active 35 DOM
-
2026-06-17days on market $92,900 Active 34 DOM
-
2026-06-16days on market $92,900 Active 33 DOM
-
2026-06-15price $92,900 Active 32 DOM
-
2026-06-15days on market $94,900 Active 32 DOM
-
2026-06-13days on market $94,900 Active 30 DOM
-
2026-06-09days on market $94,900 Active 26 DOM
-
2026-06-08days on market $94,900 Active 25 DOM
-
2026-06-07days on market $94,900 Active 24 DOM
-
2026-06-04days on market $94,900 Active 21 DOM
-
2026-06-03days on market $94,900 Active 20 DOM
-
2026-06-02days on market $94,900 Active 19 DOM
-
2026-06-01days on market $94,900 Active 18 DOM
-
2026-05-31days on market $94,900 Active 17 DOM
-
2026-05-14$94,900 Active 2491-char remark
-
2026-05-11historical $94,900 2491-char remark
ⓘ Source: listings_history table (triggers on properties + properties_extension) + one-shot
backfill from property_details.listing_events for pre-trigger history.
Tax reassessment forecast DE · Partial reset (capped growth)
- Current annual tax
- $250 · $21/mo
- Projected year-2 tax
- $395 · $33/mo
- Expected delta
- +$144/yr (+$12/mo · 57.6%)
ⓘ Screening estimate from a state-policy table — verify with the county assessor before closing.
Nearby sold comps map
Loading sold comps map…
Walkable amenities ~0.75 mi
Loading nearby amenities…
Taxation est. · year 1
- Rental income
- $31,239
- − Mortgage interest
- −$5,204
- − Property taxes
- −$250
- − Insurance
- −$464
- − Repairs & maintenance
- −$2,499
- − Management
- −$2,499
- − Depreciation
- −$2,703
- Taxable income
- $17,619
- Est. tax owed @ 24.0%
- −$4,229
- After-tax cash flow
- $13,889/yr
For passive investors: Depreciation is non-cash, so a rental often shows a tax loss while cash-flowing — sheltering income. Rental losses are passive: they offset passive income freely, and up to $25,000/yr can offset ordinary (W-2) income if you actively participate and your MAGI is under $100k (phasing out to $0 by $150k); unused losses carry forward. On sale, claimed depreciation is recaptured at up to 25%, and gains may owe capital-gains tax (a 1031 exchange can defer both). Figures are a year-1 estimate at your 24.0% rate — not tax advice; consult a CPA.
Schools (NCES district)
- District
- Appoquinimink School District
- NCES district ID
- 1000080
- Math proficiency
- 37% ▼ -13.00%
- Reading proficiency
- 52% ▼ -13.00%
- Median HH income
- $93,397
- Composite
- 42.32/100
- National rank
- #3256
- State rank
- #6 of 26 in DE
Livability — Middletown
- Score
- 71/100
- State rank
- #17
- US rank
- #6446
Category grades
Schools grade is shown separately in the Schools card above.
Census & demographics
- Census place
- Middletown, DE
- County
- New Castle County · 483,412 people
- City population
- 53,234
- Metro
- Philadelphia-Camden-Wilmington, PA-NJ-DE-MD
- Population (ZIP)
- 53,234
- Household income
- $132,956
- Rent vs Own
- Severe rent burden
- 268.0
Population outlook (New Castle County) Hauer SSP2
- Today (2025)
- 594,686 people
- By 2030
- 609,164 · +2.4%
- By 2040
- 632,154 · +6.3%
- By 2050
- 649,068 · +9.1%
- By 2075
- 687,771 · +15.7%
- By 2100
- 694,961 · +16.9%
Race, ethnicity, and origin ACS 2023
- Neighborhood character
- Diverse neighborhood (Simpson 0.59)
- Race & ethnicity
- White 59% Black 23% Asian 7% Two or more races 6% Hispanic / Latino 6%
- Hispanic origin (detail)
- Mexican 1% Puerto Rican 3%
- Common ancestry
- Romanian 5% Slovak 1% Iranian 1%
- Foreign-born
- 11% · Canada, China
- Languages at home
- 87% English-only · Other Indo-European 4% Spanish 3% French/Haitian/Cajun 1%
Political lean MEDSL · New Castle
- 2024 margin
- Solid D (+32.6) · D 65.5% · R 32.9% · Other 1.6%
- 2008→2024 swing
- -8.1pp toward R · 2008: 40.6pp · 2024: 32.6pp
- All cycles
- 2024: D+32.6 2020: D+37.1 2016: D+29.6 2012: D+34.1 2008: D+40.6
Not yet ingested
- Civics
- —
Market trends
- HPI YoY
- ▼ -86.40%
- Current HPI
- 317.1386
- Rent YoY
- ▲ 1.07%
- Metro
- Philadelphia-Camden-Wilmington, PA-NJ-DE-MD
- State GDP YoY
- —
- F500 in state
- 0
Price history
-2.1% since first listed3 events — show timeline
- 2026-06-15 Price Changed $92,900 BRIGHT MLS
- 2026-05-14 Listed $94,900 BRIGHT MLS
- 2026-05-11 Coming Soon $94,900 BRIGHT MLS
Property tax history
+5.1%/yrLatest (2024): $250 · +19.6% YoY. Source: county tax records.
Cash-flow waterfall
monthlySold comps — $/sqft
last 12 mo · ≤1 miLoading sold comps…