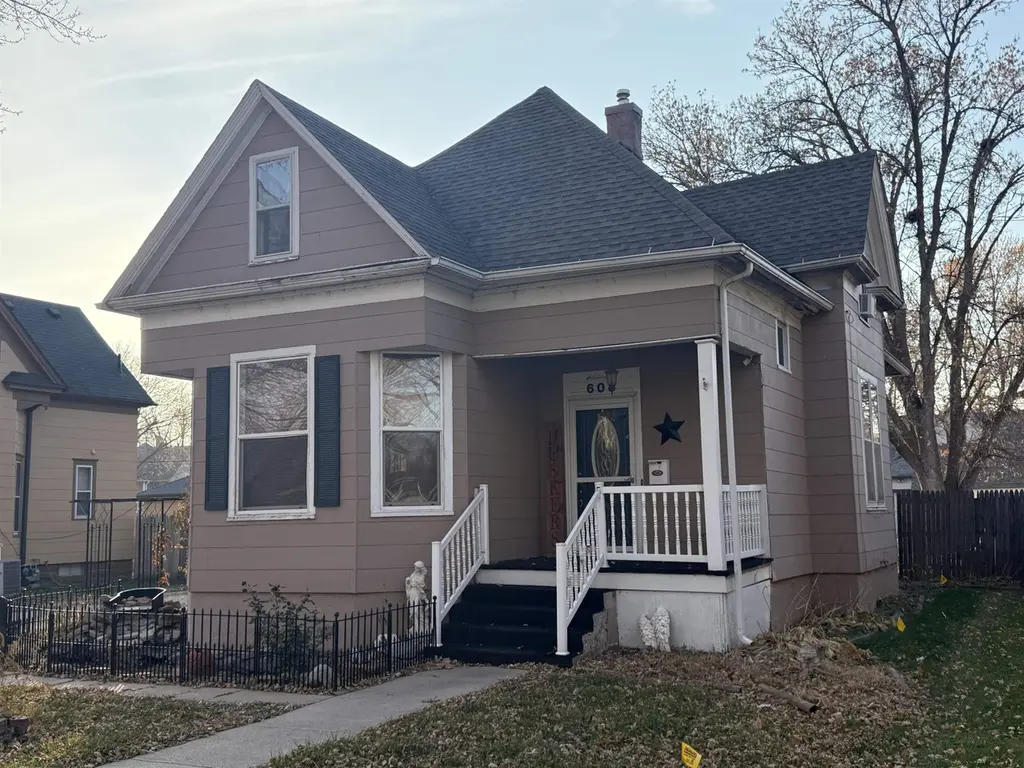
608 9th St · Norfolk, NE
Flood risk 1/10 · Minimal
- FEMA flood zone
- X (unshaded)
- Chance of flooding over 30 yrs
- 0.0%
- Est. flood insurance / yr
- $473 – $860
Fire risk 2/10 · Minimal
- Est. fire insurance / yr
- $1,161 – $2,155
Heat risk 3/10 · Minor
- Hot days now (above 102°F)
- 7 days/yr
- Hot days in 30 yrs
- 15 days/yr
Wind risk 2/10 · Minimal
- Chance of severe wind over 30 yrs
- —
Air-quality risk 2/10 · Minimal
- Unhealthy air days now
- 1 days/yr
- Unhealthy air days in 30 yrs
- 1 days/yr
Risk factors via First Street. Map © Google.
Why this score? — see what drove the B grade
The composite is a weighted blend of 9 inputs, each scored 0–100. Each bar is that input's sub-score; the figure is the points it added to the 100-point composite (weight × sub-score).
- Cash flow +27.4/30.0
- ARV discount +15.0/15.0
- DSCR +9.6/10.0
- 1% rule +7.2/10.0
- Livability +3.9/5.0
- Schools +3.8/10.0
- Rent growth +3.3/5.0
- Condition / age +2.5/5.0
- Appreciation +0.0/10.0
$149,900
🖨 Deal sheet 📄 Offer letter ✓ Due diligence
Listing remarks MLS
Everything you need for less. this 4-bedroom 2 bath home has strong bones, lots of space and the major components have been updated. The HVAC, roof, gutters, water line and electric panel are all newer. The large, updated kitchen is open to the living room and there is a main floor bedroom and full bath. The upstairs adds 3-4 more bedrooms and a bathroom that is currently a powder room but could be put back to a full bath.
Key facts
- Newer electric panel
- Updated roof
- Updated hvac
Tags
Neighborhood map
What this means for you Summary
Snapshot
- This is a 4-bed/2.0-bath single-family listed at $150k.
Deal economics
- At list price, monthly cash flow is $437 ($5k/yr) — positive.
- The deal already cash-flows at list — no discount required.
- Meets the 1% rule at list price ($2k rent vs $150k).
- Recommended offer: $132k (12.0% below list) — sets the bar for market timing.
- Cap rate 9.8% vs local median 3.2% in Norfolk — top-decile yield for the area; either an underpriced asset or a hidden risk that comps aren't pricing in. Stress-test before assuming the spread holds.
Location & tenants
- Location reads 78/100 on livability (#54 in NE, #2,611 nationally) — a middle-class / working-renter tenant base. Strengths: cost of living A+, housing A+, health & safety A+; Watch: employment C-, amenities F, commute F.
- Norfolk Public Schools (town): math 44% / reading 46% proficiency, ranked #84 of 111 in NE (top 76%) — families likely to look elsewhere, expect single-tenant / working-renter base with shorter leases.
- Market conditions: Rents rising (+3.3%/yr); 230 active listings in the ZIP; 1 comparable units currently listed for rent nearby; 270 units permitted in Madison County in 2024 (196 in 5+ unit buildings).
- This rent runs 35% of the median local income ($63k/yr) — at the standard rent-burdened threshold; future hikes will face affordability resistance.
Forward outlook
- Local home prices are declining (-3.0%/yr); year-one equity from $1k of loan paydown is wiped out by about $4k of value loss. Plan a longer hold.
- At projected returns (-3.0% appreciation + 3.3% rent growth), your $42k cash investment doubles in ~9 years — after that, you're playing with house money.
Negotiation context
- It's been on market 164 days — a 12% lower offer ($132k) is reasonable based on typical stale-listing flexibility.
- 2 sale attempts since 10y ago; this cycle's ask has dropped $10k (6%) from the opening price — seller is motivated, your offer sets the floor, not the list.
- Current owner paid $79k; list at $150k implies a 90% gain — meaningful room to come down on a strong offer.
Risks & watch-outs
- Watch-outs: built in 1915 — expect roof / HVAC / electrical / plumbing capex.
Questions for the listing agent
- It's been on market 164 days. Have you received any prior offers? Is the seller open to a 12% concession, seller financing, or rate buy-down credit?
- Built in 1915 — when were the roof, HVAC, electrical panel, plumbing, and water heater last replaced?
- Why hasn't it sold? Are there any deal-killer items the seller is aware of (foundation, flood, title, zoning, code violations)?
- Is there a deadline driving the sale (1031 exchange, divorce, estate, relocation)? That informs how much negotiation room exists.
- Schools are B-rated — typically a magnet for longer-tenancy family renters. What's the average tenant stay here, and is there a school-zone premium baked into asking?
- What's the average days-on-market for RENTAL listings here right now (not sales)? A rising rental-DOM trend means longer vacancies and softer asking-rent achievability than the comps imply.
- What's the recent tenant-quality profile in this submarket — average credit score on applications, eviction rate, late-payment / NSF rate, and stable-employment percentage? A property-management company in the area should have these aggregated.
- How much new for-sale + rental construction is in the pipeline within 1–3 miles? Heavy new supply typically softens prices + rents 12–24 months out; constrained supply supports both.
Investment metrics
- 1% rule
- 1.22% ✓
- Cap rate
- 9.80%
- Cash-on-cash
- 12.51%
- DSCR
- 1.56
- GRM
- 6.8
CMA / ARV
- ARV (median comp)
- $220,000
- List price
- $149,900
- Delta
- -31.86%
- Verdict
- UNDERPRICED
- Comps
- 20 within 1.0 mi
Show comp detail 12 sales within ~0.75 mi
| Address | Dist | Beds/Ba | Sqft | Sold | Price | $/sf | Match |
|---|---|---|---|---|---|---|---|
| 608 9th St | 0.00mi | 4/2.0 | 1,521 (0%) | 1mo | $132,500 | $87 | 100 |
| 511 8th St | 0.11mi | 5/2.0 (+1) | 1,632 (+7%) | 1mo | $220,000 | $135 | 77 |
| 825 8th St | 0.27mi | 3/2.0 (-1) | 1,530 (+1%) | 12mo | $290,000 | $190 | 72 |
| 811 5th St | 0.35mi | 4/2.0 | 1,472 (-3%) | 11mo | $199,900 | $136 | 69 |
| 213 9th St | 0.59mi | 4/2.0 | 1,528 (+0%) | 6mo | $208,500 | $136 | 66 |
| 211 13th St | 0.71mi | 4/2.0 | 1,536 (+1%) | 3mo | $185,000 | $120 | 63 |
| 918 5th St | 0.40mi | 3/1.0 (-1) | 1,591 (+5%) | 4mo | $160,000 | $101 | 62 |
| 300 Pasewalk Ave | 0.46mi | 3/2.0 (-1) | 1,434 (-6%) | 3mo | $125,000 | $87 | 61 |
| 925 1st St | 0.72mi | 4/1.0 | 1,525 (+0%) | 11mo | $184,900 | $121 | 52 |
| 1210 Taylor Ave | 0.24mi | 3/3.0 (-1) | 1,326 (-13%) | 13mo | $192,900 | $145 | 48 |
| 603 4th St | 0.41mi | 3/1.0 (-1) | 1,355 (-11%) | 8mo | $184,000 | $136 | 47 |
| 921 1st St | 0.72mi | 3/2.0 (-1) | 1,672 (+10%) | 12mo | $196,000 | $117 | 35 |
Match score weights: distance 35% · size 25% · config 20% · recency 20%. Top-matched comps best support the ARV.
Projected returns pro-forma
-3.0% appreciation · 3.31% rent growth · sell at horizon
- IRR
- 2.6%
- Equity multiple
- 1.10×
- Total profit
- $4,153
- Equity at exit
- $22,351
- IRR
- 12.4%
- Equity multiple
- 2.00×
- Total profit
- $41,888
- Equity at exit
- $12,961
Cash invested: $41,972 (down + closing). Projections, not guarantees.
Landlord ↔ Tenant lean methodology
- Overall (STATE)
- 83 Strongly Landlord-Friendly
- State Nebraska
- 83 Strongly Landlord-Friendly · R+13
- County
- — inherits STATE
- City
- — inherits STATE
ZIP-level market 68701
- Rents YoY
- 3.3%
- Active inventory
- 230
- Price-to-rent
- 6.8×
Monthly cashflow live
- Estimated rent
- $1,825 medium interval (Pro) →
- Mortgage (P&I)
- −$786
- Tax from tax record
- −$156 /mo · $1,873/yr
- Insurance
- −$62
- HOA
- −$0
- Vacancy / Maint / Mgmt
- −$383
- Net cashflow
- $437
Break-even live
UW: 25.0% down · 7.5% · 30yr · 1.5% tax · 5.0% vac · 8.0% maint · 8.0% mgmt
Financing live
Cash to close
- Down payment
- $37,475
- Closing costs
- $4,497
- Reserves months
- —
- Total cash needed
- —
Loan-product check · same deal, 3 products live
Conventional
25% down · 7.5% · 30yr
- Down + closing
- —
- Monthly P&I
- —
- Monthly cashflow
- —
- DSCR
- —
- Eligible?
- —
Personal DTI + credit; lowest rate.
DSCR
20% down · 8.5% · 30yr
- Down + closing
- —
- Monthly P&I
- —
- Monthly cashflow
- —
- DSCR
- —
- Eligible?
- —
No personal income docs; deal must DSCR.
Hard money
10% down · 12.0% · 12mo
- Down + closing
- —
- Monthly P&I
- —
- Monthly cashflow
- —
- DSCR
- —
- Eligible?
- —
Short-term bridge; refi at stabilization.
Rent comps 1 comps
| Address | Beds | Baths | Sqft | Rent | $/sqft | DOM | Units | Dist |
|---|---|---|---|---|---|---|---|---|
| 1208 Koenigstein Ave Norfolk, NE | 3.0 | 1.5 | 1140 | $2,200 | $1.93 | 43d | 1 | 0.60mi |
Listing history 8 events
-
2026-05-04status Pending 426-char remark
Show marketing remark (426 chars)
Everything you need for less. this 4-bedroom 2 bath home has strong bones, lots of space and the major components have been updated. The HVAC, roof, gutters, water line and electric panel are all newer. The large, updated kitchen is open to the living room and there is a main floor bedroom and full bath. The upstairs adds 3-4 more bedrooms and a bathroom that is currently a powder room but could be put back to a full bath.
-
2026-04-13price $149,900 426-char remark
Show marketing remark (426 chars)
Everything you need for less. this 4-bedroom 2 bath home has strong bones, lots of space and the major components have been updated. The HVAC, roof, gutters, water line and electric panel are all newer. The large, updated kitchen is open to the living room and there is a main floor bedroom and full bath. The upstairs adds 3-4 more bedrooms and a bathroom that is currently a powder room but could be put back to a full bath.
-
2026-01-16price $154,900 426-char remark
Show marketing remark (426 chars)
Everything you need for less. this 4-bedroom 2 bath home has strong bones, lots of space and the major components have been updated. The HVAC, roof, gutters, water line and electric panel are all newer. The large, updated kitchen is open to the living room and there is a main floor bedroom and full bath. The upstairs adds 3-4 more bedrooms and a bathroom that is currently a powder room but could be put back to a full bath.
-
2025-11-21$160,000 Active 426-char remark
Show marketing remark (426 chars)
Everything you need for less. this 4-bedroom 2 bath home has strong bones, lots of space and the major components have been updated. The HVAC, roof, gutters, water line and electric panel are all newer. The large, updated kitchen is open to the living room and there is a main floor bedroom and full bath. The upstairs adds 3-4 more bedrooms and a bathroom that is currently a powder room but could be put back to a full bath.
-
2016-12-15soldstatus $79,000 341-char remark
Show marketing remark (341 chars)
4 bedroom, 2 bath, 1711 sq. ft. , 1.5 story home. New roof, updated kitchen, open floor plan, updated electrical, fenced in backyard, laminate floors, stainless appliances, newer high effect gas furnace, newer central air and updated windows. Fish pond, new sidewalk and much more. Great starter home or a great home to flip. Priced to sell.
-
2016-11-08$79,000 341-char remark
Show marketing remark (341 chars)
4 bedroom, 2 bath, 1711 sq. ft. , 1.5 story home. New roof, updated kitchen, open floor plan, updated electrical, fenced in backyard, laminate floors, stainless appliances, newer high effect gas furnace, newer central air and updated windows. Fish pond, new sidewalk and much more. Great starter home or a great home to flip. Priced to sell.
-
2005-10-01soldstatus $52,000
-
2004-10-01soldstatus $25,000
ⓘ Source: listings_history table (triggers on properties + properties_extension) + one-shot
backfill from property_details.listing_events for pre-trigger history.
Tax reassessment forecast NE · Resets to sale price
- Current annual tax
- $1,873 · $156/mo
- Projected year-2 tax
- $2,593 · $216/mo
- Expected delta
- +$720/yr (+$60/mo · 38.4%)
ⓘ Screening estimate from a state-policy table — verify with the county assessor before closing.
Climate risk First Street
- Flood 1/10 Low FEMA zone X (unshaded) · 0% chance over 30 yrs
- Wildfire 2/10 Low
- Heat 3/10 Moderate 7 d/yr ≥102°F today · 15 d/yr by 30 yrs out
- Wind 2/10 Low
- Air quality 2/10 Low 1 unhealthy d/yr today · 1 by 30 yrs out
Nearby sold comps map
Loading sold comps map…
Walkable amenities ~0.75 mi
Loading nearby amenities…
Taxation est. · year 1
- Rental income
- $21,906
- − Mortgage interest
- −$8,397
- − Property taxes
- −$1,873
- − Insurance
- −$750
- − Repairs & maintenance
- −$1,752
- − Management
- −$1,752
- − Depreciation
- −$4,361
- Taxable income
- $3,021
- Est. tax owed @ 24.0%
- −$725
- After-tax cash flow
- $4,525/yr
For passive investors: Depreciation is non-cash, so a rental often shows a tax loss while cash-flowing — sheltering income. Rental losses are passive: they offset passive income freely, and up to $25,000/yr can offset ordinary (W-2) income if you actively participate and your MAGI is under $100k (phasing out to $0 by $150k); unused losses carry forward. On sale, claimed depreciation is recaptured at up to 25%, and gains may owe capital-gains tax (a 1031 exchange can defer both). Figures are a year-1 estimate at your 24.0% rate — not tax advice; consult a CPA.
Schools (NCES district)
- District
- Norfolk Public Schools
- NCES district ID
- 3174430
- Math proficiency
- 44% ▼ -7.00%
- Reading proficiency
- 46% ▼ -7.00%
- Median HH income
- $46,579
- Composite
- 38.31/100
- National rank
- #4227
- State rank
- #84 of 111 in NE
Livability — Norfolk
- Score
- 78/100
- State rank
- #54
- US rank
- #2611
Category grades
Schools grade is shown separately in the Schools card above.
Census & demographics
- Census place
- Norfolk, NE
- County
- Madison County · 31,417 people
- City population
- 31,417
- Metro
- Norfolk, NE
- Population (ZIP)
- 31,417
- Household income
- $62,633
- Rent vs Own
- Severe rent burden
- 861.0
Population outlook (Madison County) Hauer SSP2
- Today (2025)
- 35,536 people
- By 2030
- 35,518 · -0.1%
- By 2040
- 35,170 · -1.0%
- By 2050
- 34,606 · -2.6%
- By 2075
- 34,522 · -2.9%
- By 2100
- 34,307 · -3.5%
Race, ethnicity, and origin ACS 2023
- Neighborhood character
- Predominantly White (80%)
- Race & ethnicity
- White 80% Hispanic / Latino 14% Two or more races 9% Native American 1% Black 1%
- Hispanic origin (detail)
- Mexican 11% Cuban 1%
- Common ancestry
- Portuguese 2% Romanian 1% Lithuanian 1%
- Foreign-born
- 6% · Canada
- Languages at home
- 90% English-only · Spanish 9%
Political lean MEDSL · Madison
- 2024 margin
- Solid R (+56.0) · D 21.4% · R 77.4% · Other 1.2%
- 2008→2024 swing
- -16.8pp toward R · 2008: -39.2pp · 2024: -56.0pp
- All cycles
- 2024: R+56.0 2020: R+53.5 2016: R+56.3 2012: R+48.1 2008: R+39.2
Not yet ingested
- Civics
- —
Market trends
- HPI YoY
- ▼ -172.61%
- Current HPI
- 260.5574
- Rent YoY
- ▲ 3.31%
- Metro
- Norfolk, NE
- State GDP YoY
- ▲ 0.68%
- F500 in state
- 2
Industry mix (Fortune 500 HQ in NE)
| Industry | F500 HQs | Revenue |
|---|---|---|
| Conglomerate | 1 | $371B |
|
||
Price history
+499.6% since first listed8 events — show timeline
- 2026-05-04 Pending — NNEMLS
- 2026-04-13 Price Changed $149,900 NNEMLS
- 2026-01-16 Price Changed $154,900 NNEMLS
- 2025-11-21 Listed $160,000 NNEMLS
- 2016-12-15 Sold (MLS) $79,000 NNEMLS
- 2016-11-08 Listed $79,000 NNEMLS
- 2005-10-01 Sold (Public Records) $52,000 Public Records
- 2004-10-01 Sold (Public Records) $25,000 Public Records
Property tax history
+3.8%/yrLatest (2025): $1,873 · +0.5% YoY. Source: county tax records.
Cash-flow waterfall
monthlySold comps — $/sqft
last 12 mo · ≤1 miLoading sold comps…