2235 Gloaming Way · Los Angeles, CA
Flood risk 1/10 · Minimal
- FEMA flood zone
- X (unshaded)
- Chance of flooding over 30 yrs
- 0.0%
- Est. flood insurance / yr
- $507 – $1,088
Fire risk 5/10 · Moderate
- Est. fire insurance / yr
- $659 – $1,223
Heat risk 4/10 · Minor
- Hot days now (above 92°F)
- 4 days/yr
- Hot days in 30 yrs
- 12 days/yr
Wind risk 1/10 · Minimal
- Chance of severe wind over 30 yrs
- —
Air-quality risk 5/10 · Moderate
- Unhealthy air days now
- 7 days/yr
- Unhealthy air days in 30 yrs
- 7 days/yr
Risk factors via First Street. Map © Google.
Why this score? — see what drove the D grade
The composite is a weighted blend of 9 inputs, each scored 0–100. Each bar is that input's sub-score; the figure is the points it added to the 100-point composite (weight × sub-score).
- ARV discount +14.8/15.0
- Appreciation +9.8/10.0
- Cash flow +6.1/30.0
- Schools +3.6/10.0
- Livability +3.4/5.0
- Rent growth +2.9/5.0
- Condition / age +2.5/5.0
- 1% rule +0.4/10.0
- DSCR +0.4/10.0
$1,995,000
🖨 Deal sheet (PDF) 📄 Offer letter ✓ Due diligence
Listing remarks
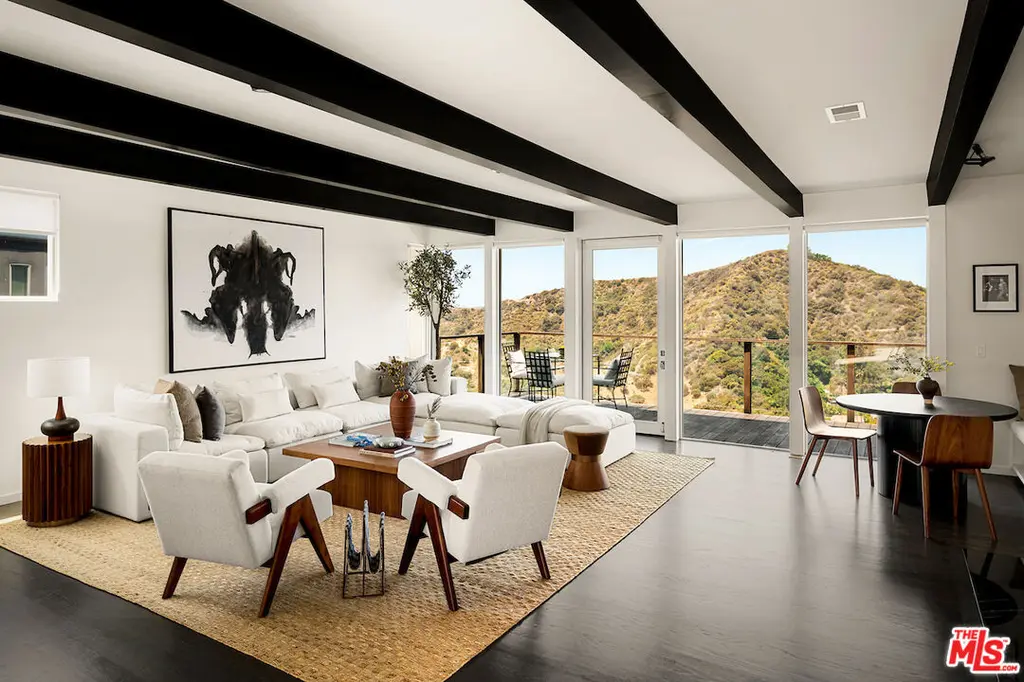
Set at the end of a quiet cul-de-sac in Beverly Hills, this meticulously renovated architectural residence offers unparalleled privacy and sweeping panoramic views spanning the canyon, mountains, city skyline, and Pacific Ocean. The home's curated design is centered around its remarkable setting, with expansive walls of glass that flood the interiors with natural light and frame the ever-changing landscape beyond. A substantial Brazilian Ipe terrace stretches across the residence, creating a dramatic extension of the living spaces and offering a striking backdrop for both everyday living and entertaining. Inside, the main living room pairs clean architectural lines with warmth and character
Key facts
- Wet bar
- Panoramic views
- Bespoke built-ins
Tags
Property features AI
Exterior
- Parking: One-car garage; One carport space; Two total parking spaces
- Home design: Detached single-family home; One level (single-story)
- Construction: No other detached structures
- Exterior features: Panoramic views including hills, mountains, canyon, city and city lights
Interior
- Kitchen: Dishwasher; Range/oven; Microwave; Freezer
- Flooring: Hardwood floors; Stone floors
- Bathrooms: Two full bathrooms
- Heating & cooling: Central heating; Central cooling
- Interior features: Alarm system; Built-in cabinetry; Cable and satellite available; Fireplace in living room; Breakfast area; Dining area; Living room; Open patio; Powder room; As-is disclosure
- Laundry & utility: Laundry area with washer and dryer included
Neighborhood map
What this means for you Summary
Snapshot
- This is a 2-bed/2.0-bath single-family listed at $2.00M.
Deal economics
- At list price, monthly cash flow is $-4k ($-45k/yr) — negative.
- To cash-flow at today's rent, offer at most $1.33M (33.2% below list).
- To meet the 1% rule (rent ≥ 1% of price), the offer needs to be $1.08M (46.1% below list).
- Recommended offer: $1.08M (46.1% below list) — sets the bar for 1% rule.
- Cap rate 4.0% vs local median 2.1% in Los Angeles — top-decile yield for the area; either an underpriced asset or a hidden risk that comps aren't pricing in. Stress-test before assuming the spread holds.
Location & tenants
- Location reads 68/100 on livability (#273 in CA) — a middle-class / working-renter tenant base. Strengths: amenities A+, commute A+, employment B; Watch: health & safety C-, crime F, cost of living F.
- Los Angeles Unified (urban): math 29% / reading 54% proficiency, ranked #223 of 517 in CA (top 43%) — families likely to look elsewhere, expect single-tenant / working-renter base with shorter leases; 67% free/reduced lunch — lower-income household profile, screen leases tightly.
- Zoned schools: West Hollywood Elementary (307 students, 30% FRL); Emerson Community Charter (492 students, 51% FRL, charter); University High School Charter (math 40% / reading 66%, grade C-, #285 of 1,170 statewide, top 25%, 1,338 students, 72% FRL, charter) — zoned schools average 51% FRL vs 67% district-wide (17 pts lower); this property's tenant base skews higher-income than the district average.
- Market conditions: Rents rising (+1.7%/yr); 310 active listings in the ZIP; 24 comparable units currently listed for rent nearby; rentals at typical pace (median 26d on market — plan ~3-4 weeks tenant-placement turnaround); high-income renter base; 19,697 units permitted in Los Angeles County in 2024 (9,426 in 5+ unit buildings).
- At $10,762/mo this rent would consume 69% of the median local household income ($188k/yr) (locally 911% of renters already pay >50% of income on rent) — very limited rent-growth headroom before tenants either downsize or default.
Forward outlook
- In year one you build about $204k of equity ($14k loan paydown + $191k appreciation (9.6% local appreciation)).
- Los Angeles County population projected at +9% by 2050 — modest demand growth; plan on rents tracking national, not racing it.
- By year 2, paydown + projected appreciation supports a ~$328k cash-out refi (75% LTV) — recoverable capital for the next deal without selling this one.
Negotiation context
- It's been on market 37 days — a 3% lower offer ($1.94M) is reasonable based on typical stale-listing flexibility.
- 3 sale attempts; this cycle's ask has dropped $200k (9%) from the opening price — seller is motivated, your offer sets the floor, not the list.
- Current owner paid $277k; list at $2.00M implies a 620% gain — meaningful room to come down on a strong offer.
Risks & watch-outs
- Climate carrying-cost: moderate wildfire risk — expect insurance premiums to compound above CPI over the hold.
Questions for the listing agent
- What do current leases actually rent for vs. the listed asking? Can we see a recent rent roll and the last 12 months of T-12 income?
- It's been on market 37 days. Have you received any prior offers? Is the seller open to a 46% concession, seller financing, or rate buy-down credit?
- Built in 1961 — when were the roof, HVAC, electrical panel, plumbing, and water heater last replaced?
- Is there a deadline driving the sale (1031 exchange, divorce, estate, relocation)? That informs how much negotiation room exists.
- Schools are D-rated, which usually means shorter tenancies and higher turnover. Who's the typical renter profile here, and what's been the actual vacancy rate?
- Crime grade is F in this area — have there been break-ins, vandalism, or insurance claims at this property in the last 3 years? What carrier currently insures it and at what premium?
- The area grade is low — what's the realistic commute time and amenity access for the typical tenant pool here? Any planned neighborhood developments (good or bad) we should know about?
- What's the average days-on-market for RENTAL listings here right now (not sales)? A rising rental-DOM trend means longer vacancies and softer asking-rent achievability than the comps imply.
- What's the recent tenant-quality profile in this submarket — average credit score on applications, eviction rate, late-payment / NSF rate, and stable-employment percentage? A property-management company in the area should have these aggregated.
- How much new for-sale + rental construction is in the pipeline within 1–3 miles? Heavy new supply typically softens prices + rents 12–24 months out; constrained supply supports both.
Investment metrics
- 1% rule
- 0.54% ✗
- Cap rate
- 4.04%
- Cash-on-cash
- -8.06%
- DSCR
- 0.64
- GRM
- 15.4
CMA / ARV
- ARV (median comp)
- $2,379,465
- List price
- $1,995,000
- Delta
- -16.16%
- Verdict
- UNDERPRICED
- Comps
- 20 within 1.0 mi
Show comp detail 2 sales within ~0.75 mi
| Address | Dist | Beds/Ba | Sqft | Sold | Price | $/sf | Match |
|---|---|---|---|---|---|---|---|
| 8877 Sunset Crest Pl | 0.72mi | 3/2.0 (+1) | 1,853 (+11%) | 13mo | $2,050,000 | $1,106 | 32 |
| 8871 Sunset Crest Pl | 0.74mi | 3/3.0 (+1) | 1,911 (+15%) | 16mo | $2,200,000 | $1,151 | 19 |
Match score weights: distance 35% · size 25% · config 20% · recency 20%. Top-matched comps best support the ARV.
Projected returns pro-forma
9.56% appreciation · 1.73% rent growth · sell at horizon
- IRR
- 17.3%
- Equity multiple
- 2.38×
- Total profit
- $772,820
- Equity at exit
- $1,733,133
- IRR
- 16.1%
- Equity multiple
- 5.33×
- Total profit
- $2,421,424
- Equity at exit
- $3,671,372
Cash invested: $558,600 (down + closing). Projections, not guarantees.
Landlord ↔ Tenant lean methodology
- Overall (CITY)
- 0 Strongly Tenant-Friendly
- State California
- 18 Strongly Tenant-Friendly · D+13
- County
- — inherits STATE
- City Los Angeles
- 0 Strongly Tenant-Friendly · D+22
ZIP-level market 90210
- Home prices YoY
- 2.0%
- Rents YoY
- 1.7%
- Active inventory
- 310
- Price-to-rent
- 15.4×
Monthly cashflow live
- Estimated rent
- $10,762 high interval (Pro) →
- Mortgage (P&I)
- −$10,462
- Tax from tax record
- −$962 /mo · $11,548/yr
- Insurance
- −$831
- HOA
- −$0
- Vacancy / Maint / Mgmt
- −$2,260
- Net cashflow
- $-3,754
Break-even live
Sensitivity live
| Price | -10% $-2,624 | -5% $-3,189 | +0% $-3,754 | +5% $-4,318 | +10% $-4,883 |
|---|---|---|---|---|---|
| Rent | -10% $-4,604 | -5% $-4,179 | +0% $-3,754 | +5% $-3,329 | +10% $-2,904 |
| Rate | -1.0pp $-2,749 | -0.5pp $-3,246 | base $-3,754 | +0.5pp $-4,271 | +1.0pp $-4,797 |
UW: 25.0% down · 7.5% · 30yr · 1.5% tax · 5.0% vac · 8.0% maint · 8.0% mgmt
Financing live
Cash to close
- Down payment
- $498,750
- Closing costs
- $59,850
- Reserves months
- —
- Total cash needed
- —
Loan-product check · same deal, 3 products live
Conventional
25% down · 7.5% · 30yr
- Down + closing
- —
- Monthly P&I
- —
- Monthly cashflow
- —
- DSCR
- —
- Eligible?
- —
Personal DTI + credit; lowest rate.
DSCR
20% down · 8.5% · 30yr
- Down + closing
- —
- Monthly P&I
- —
- Monthly cashflow
- —
- DSCR
- —
- Eligible?
- —
No personal income docs; deal must DSCR.
Hard money
10% down · 12.0% · 12mo
- Down + closing
- —
- Monthly P&I
- —
- Monthly cashflow
- —
- DSCR
- —
- Eligible?
- —
Short-term bridge; refi at stabilization.
Rent comps 24 comps
| Address | Beds | Baths | Sqft | Rent | $/sqft | DOM | Units | Dist |
|---|---|---|---|---|---|---|---|---|
| 9549 Dalegrove Dr Beverly Hills, CA | 3.0 | 2.0 | 1655 | $7,995 | $4.83 | 46d | 1 | 0.13mi |
| 2107 El Roble Ln Beverly Hills, CA | 3.0 | 2.0 | 1826 | $11,750 | $6.43 | 26d | 1 | 0.19mi |
| 2221 Bowmont Dr Beverly Hills, CA | 3.0 | 3.0 | 1983 | $16,999 | $8.57 | 45d | 1 | 0.24mi |
| 2001 Coldwater Canyon Dr Beverly Hills, CA | 3.0 | 4.0 | 2194 | $11,995 | $5.47 | 45d | 1 | 0.38mi |
| 8500 W Sunset Crest Pl Los Angeles, CA | 2.0 | 2.0 | 1212 | $15,000 | $12.38 | 45d | 1 | 0.73mi |
| 9249 Crescent Dr Los Angeles, CA | 3.0 | 2.0 | 1950 | $12,500 | $6.41 | 45d | 1 | 0.79mi |
| 2154 Ridgemont Dr Los Angeles, CA | 2.0 | 2.0 | 1623 | $8,500 | $5.24 | 20d | 1 | 0.85mi |
| 8870 Wonderland Ave Los Angeles, CA | 3.0 | 2.0 | 1495 | $7,500 | $5.02 | 22d | 1 | 0.92mi |
| 8743 Hollywood Hills Rd Los Angeles, CA | 2.0 | 2.0 | 1402 | $6,450 | $4.60 | 26d | 1 | 0.98mi |
| 8743 Hollywood Hills Rd Los Angeles, CA | 2.0 | 2.0 | 1402 | $6,450 | $4.60 | 18d | 1 | 0.98mi |
| 8831 Lookout Mountain Ave Los Angeles, CA | 3.0 | 2.0 | 1673 | $9,500 | $5.68 | 9d | 1 | 1.07mi |
| 2144 Sunset Plaza Dr Los Angeles, CA | 2.0 | 2.0 | 1464 | $11,500 | $7.86 | 45d | 1 | 1.14mi |
| 8895 Appian Way Los Angeles, CA | 3.0 | 2.5 | 1812 | $8,495 | $4.69 | 45d | 1 | 1.19mi |
| 2013 Cyprean Dr Los Angeles, CA | 2.0 | 2.0 | 1441 | $6,950 | $4.82 | 7d | 1 | 1.20mi |
| 1174 Coldwater Canyon Dr Beverly Hills, CA | 1.0 | 2.0 | 1100 | $4,800 | $4.36 | 6d | 1 | 1.21mi |
| 8570 Wonderland Ave Los Angeles, CA | 2.0 | 2.0 | 1083 | $4,950 | $4.57 | 26d | 1 | 1.25mi |
| 9119 Thrasher Ave Los Angeles, CA | 2.0 | 2.0 | 1440 | $13,500 | $9.38 | 45d | 1 | 1.30mi |
| 1919 San Ysidro Dr Beverly Hills, CA | 3.0 | 2.0 | 1884 | $10,500 | $5.57 | 26d | 1 | 1.33mi |
| 1367 N Beverly Dr Beverly Hills, CA | 3.0 | 3.0 | 1765 | $9,995 | $5.66 | 20d | 1 | 1.37mi |
| 1923 Sunset Plaza Dr Los Angeles, CA | 3.0 | 3.0 | 1800 | $12,995 | $7.22 | 45d | 1 | 1.37mi |
| 8581 Appian Way Los Angeles, CA | 2.0 | 2.0 | 1415 | $12,500 | $8.83 | 16d | 1 | 1.40mi |
| 8581 Appian Way Los Angeles, CA | 2.0 | 2.0 | 1415 | $11,995 | $8.48 | 7d | 1 | 1.40mi |
| 1528 Rising Glen Rd Los Angeles, CA | 2.0 | 2.0 | 1676 | $7,550 | $4.50 | 1d | 1 | 1.43mi |
| 1568 Viewsite Dr Los Angeles, CA | 2.0 | 2.0 | 1500 | $15,000 | $10.00 | 20d | 1 | 1.49mi |
Listing history 22 events
-
2026-06-21days on market $1,995,000 Active 37 DOM
-
2026-06-18price $1,995,000 Active 34 DOM
-
2026-06-18days on market $2,195,000 Active 34 DOM
-
2026-06-17days on market $2,195,000 Active 33 DOM
-
2026-06-16days on market $2,195,000 Active 32 DOM
-
2026-06-15days on market $2,195,000 Active 31 DOM
-
2026-06-13days on market $2,195,000 Active 29 DOM
-
2026-06-09days on market $2,195,000 Active 25 DOM
-
2026-06-08days on market $2,195,000 Active 24 DOM
-
2026-06-07days on market $2,195,000 Active 23 DOM
-
2026-06-04days on market $2,195,000 Active 20 DOM
-
2026-06-03days on market $2,195,000 Active 19 DOM
-
2026-06-02days on market $2,195,000 Active 18 DOM
-
2026-06-01days on market $2,195,000 Active 17 DOM
-
2026-05-31days on market $2,195,000 Active 16 DOM
-
2026-05-15$2,195,000 Active 2034-char remark
-
2025-12-10historical $11,000
-
2025-10-17price $11,000
-
2025-10-15$11,500
-
2025-09-10Active
-
1986-11-14soldstatus $277,000
-
1985-02-25soldstatus $253,000
ⓘ Source: listings_history table (triggers on properties + properties_extension) + one-shot
backfill from property_details.listing_events for pre-trigger history.
Tax reassessment forecast CA · Resets to sale price
- Current annual tax
- $11,548 · $962/mo
- Projected year-2 tax
- $15,162 · $1,264/mo
- Expected delta
- +$3,614/yr (+$301/mo · 31.3%)
ⓘ Screening estimate from a state-policy table — verify with the county assessor before closing.
Climate risk First Street
- Flood 1/10 Low FEMA zone X (unshaded) · 0% chance over 30 yrs
- Wildfire 5/10 Major
- Heat 4/10 Moderate 4 d/yr ≥92°F today · 12 d/yr by 30 yrs out
- Wind 1/10 Low
- Air quality 5/10 Major 7 unhealthy d/yr today · 7 by 30 yrs out
Nearby sold comps map
Loading sold comps map…
Walkable amenities ~0.75 mi
Loading nearby amenities…
Taxation est. · year 1
- Rental income
- $129,142
- − Mortgage interest
- −$111,751
- − Property taxes
- −$11,548
- − Insurance
- −$9,975
- − Repairs & maintenance
- −$10,331
- − Management
- −$10,331
- − Depreciation
- −$58,036
- Taxable loss
- −$82,831
- Est. tax savings @ 24.0%
- +$19,879
- After-tax cash flow
- $-25,165/yr
For passive investors: Depreciation is non-cash, so a rental often shows a tax loss while cash-flowing — sheltering income. Rental losses are passive: they offset passive income freely, and up to $25,000/yr can offset ordinary (W-2) income if you actively participate and your MAGI is under $100k (phasing out to $0 by $150k); unused losses carry forward. On sale, claimed depreciation is recaptured at up to 25%, and gains may owe capital-gains tax (a 1031 exchange can defer both). Figures are a year-1 estimate at your 24.0% rate — not tax advice; consult a CPA.
Schools (NCES district)
- District
- Los Angeles Unified
- NCES district ID
- 0622710
- Math proficiency
- 29% ▼ -4.00%
- Reading proficiency
- 54% ▲ 10.00%
- Median HH income
- $50,403
- Composite
- 35.67/100
- National rank
- #4875
- State rank
- #223 of 517 in CA
Livability — Los Angeles
- Score
- 68/100
- State rank
- #273
- US rank
- #9237
Category grades
Schools grade is shown separately in the Schools card above.
Census & demographics
- Census place
- Los Angeles, CA
- County
- Los Angeles County · 9,444,647 people
- City population
- 3,838,149
- Metro
- Los Angeles-Long Beach-Anaheim, CA
- Population (ZIP)
- 19,004
- Household income
- $187,801
- Rent vs Own
- Severe rent burden
- 911.0
Population outlook (Los Angeles County) Hauer SSP2
- Today (2025)
- 10,940,515 people
- By 2030
- 11,256,481 · +2.9%
- By 2040
- 11,729,929 · +7.2%
- By 2050
- 11,948,407 · +9.2%
- By 2075
- 11,818,114 · +8.0%
- By 2100
- 10,842,928 · -0.9%
Race, ethnicity, and origin ACS 2023
- Neighborhood character
- Predominantly White (81%)
- Race & ethnicity
- White 81% Two or more races 8% Asian 7% Hispanic / Latino 6% Black 2%
- Hispanic origin (detail)
- Mexican 3%
- Common ancestry
- Scotch-Irish 5% Italian 4% Romanian 3%
- Foreign-born
- 36% · Canada, China, South Korea
- Languages at home
- 59% English-only · Other Indo-European 21% Spanish 4% French/Haitian/Cajun 3%
Political lean MEDSL · Los Angeles
- 2024 margin
- Solid D (+32.9) · D 64.8% · R 31.9% · Other 3.3%
- 2008→2024 swing
- -7.4pp toward R · 2008: 40.4pp · 2024: 32.9pp
- All cycles
- 2024: D+32.9 2020: D+44.2 2016: D+48.0 2012: D+40.0 2008: D+40.4
Not yet ingested
- Civics
- —
Market trends
- HPI YoY
- ▲ 9.56%
- Current HPI
- 495.052
- Rent YoY
- ▲ 1.73%
- Metro
- Los Angeles-Long Beach-Anaheim, CA
- State GDP YoY
- ▲ 3.21%
- F500 in state
- 116
Industry mix (Fortune 500 HQ in CA)
| Industry | F500 HQs | Revenue |
|---|---|---|
| Technology | 27 | $1,492B |
|
||
| Financial Services | 3 | $174B |
|
||
| Retail | 3 | $44B |
|
||
| Insurance | 3 | $26B |
|
||
| Media / Entertainment | 2 | $115B |
|
||
| Pharmaceuticals / Biotech | 2 | $62B |
|
||
Price history
+767.6% since first listed7 events — show timeline
- 2026-05-15 Listed $2,195,000 TheMLS
- 2025-12-10 Rental Removed $11,000 CLAW
- 2025-10-17 Price Changed $11,000 CLAW
- 2025-10-15 Listed for Rent $11,500 CLAW
- 2025-09-10 Listed — TheMLS
- 1986-11-14 Sold (Public Records) $277,000 Public Records
- 1985-02-25 Sold (Public Records) $253,000 Public Records
Property tax history
+5.0%/yrLatest (2025): $11,548 · +1.9% YoY. Source: county tax records.
Cash-flow waterfall
monthlySold comps — $/sqft
last 12 mo · ≤1 miLoading sold comps…