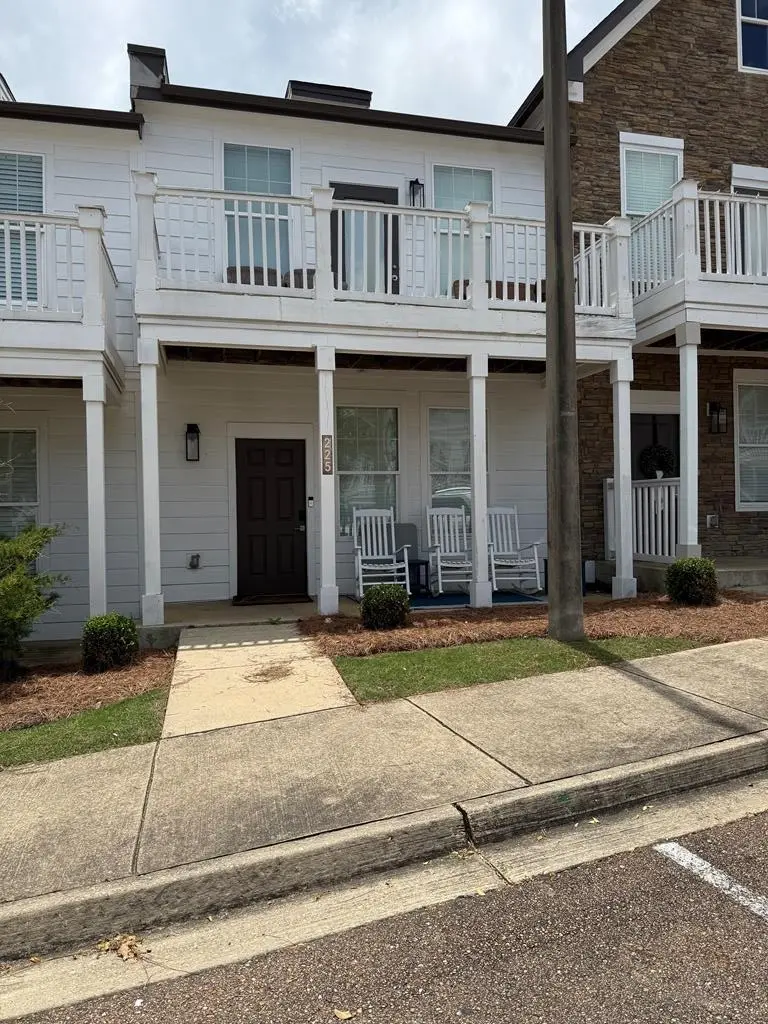
225 Town Center Dr · Oxford, MS
Flood risk No data
- FEMA flood zone
- —
- Chance of flooding over 30 yrs
- —
- Est. flood insurance / yr
- —
Fire risk No data
- Est. fire insurance / yr
- —
Heat risk No data
- Hot days now (above threshold)
- —
- Hot days in 30 yrs
- —
Wind risk No data
- Chance of severe wind over 30 yrs
- —
Air-quality risk No data
- Unhealthy air days now
- —
- Unhealthy air days in 30 yrs
- —
Risk factors via First Street. Map © Google.
Why this score? — see what drove the D grade
The composite is a weighted blend of 9 inputs, each scored 0–100. Each bar is that input's sub-score; the figure is the points it added to the 100-point composite (weight × sub-score).
- Cash flow +12.3/30.0
- ARV discount +7.5/15.0
- Livability +4.4/5.0
- Schools +4.3/10.0
- DSCR +3.7/10.0
- Rent growth +3.7/5.0
- Condition / age +2.5/5.0
- 1% rule +2.2/10.0
- Appreciation +0.0/10.0
$399,000
🖨 Deal sheet (PDF) 📄 Offer letter ✓ Due diligence
Listing remarks MLS
If you have ever wanted a condo close to everything that Oxford and the university has to offer, nows your chance. This beautiful town home offers 3 bedrooms 3 full bath rooms. This unit is just steps away from massive walk in pool and many of the other amenities. Amenities include 3 pools, walking trails, dog parks, a beautiful club house with game room, volley ball and basketball courts and all less than 2 miles from both the university and the square. Come see the beautiful finishes that Rowandale has to offer for yourself before they're gone!
Key facts
- Clubhouse
- Large sparkling pool
- Built 2013
Tags
Property features AI
Exterior
- Utilities: Public water; Public sewer
- Home design: Residential townhouse; Located in Rowandale subdivision; Subdivision governed by covenants
- Construction: Slab foundation
- Exterior features: Porch
Interior
- Kitchen: Microwave; Dishwasher; Disposal; Electric range
- Flooring: Carpet
- Bathrooms: 3 full bathrooms
- Heating & cooling: Central air; Ceiling fan(s)
- Interior features: Walk-in closet(s)
- Laundry & utility: Electric water heater
Neighborhood map
What this means for you Summary
Snapshot
- This is a 3-bed/1.0-bath townhouse listed at $399k.
Deal economics
- At list price, monthly cash flow is $-73 ($-877/yr) — negative.
- To cash-flow at today's rent, offer at most $386k (3.2% below list).
- To meet the 1% rule (rent ≥ 1% of price), the offer needs to be $288k (27.7% below list).
- Recommended offer: $288k (27.7% below list) — sets the bar for 1% rule.
- Cap rate 6.1% vs local median 2.8% in Oxford — top-decile yield for the area; either an underpriced asset or a hidden risk that comps aren't pricing in. Stress-test before assuming the spread holds.
Location & tenants
- Location reads 87/100 on livability (#1 in MS, #285 nationally) — a professional / high-income tenant draw. Strengths: amenities A+, commute A+, health & safety A+; Watch: employment C-.
- Oxford School District (town): math 53% / reading 49% proficiency, ranked #12 of 130 in MS (top 9%) — acceptable for families but not a draw, mixed tenant base, ~2y average lease.
- Zoned schools: Bramlett Elementary School (742 students, 100% FRL); Oxford Middle School (math 55% / reading 48%, grade C, #27 of 179 statewide, top 16%, 697 students, 100% FRL); Oxford High School (math 33% / reading 49%, grade F, #49 of 197 statewide, top 25%, 1,345 students, 100% FRL) — zoned schools average 100% FRL vs 42% district-wide (58 pts higher); higher-poverty schools than district average — tighter screening recommended.
- Market conditions: Rents rising fast (+4.8%/yr); 856 active listings in the ZIP; 2 comparable units currently listed for rent nearby; 503 units permitted in Lafayette County in 2024 (0 in 5+ unit buildings).
- At $2,883/mo this rent would consume 51% of the median local household income ($68k/yr) (locally 1892% of renters already pay >50% of income on rent) — very limited rent-growth headroom before tenants either downsize or default.
Forward outlook
- Local home prices are declining (-3.0%/yr); year-one equity from $3k of loan paydown is wiped out by about $12k of value loss. Plan a longer hold.
- Lafayette County population projected at +61% by 2050 — long-run rental-demand tailwind backs the buy-and-hold thesis.
Negotiation context
- It's been on market 20 days — a 2% lower offer ($393k) is reasonable based on typical stale-listing flexibility.
- 2 sale attempts since 4y ago with the ask held roughly flat each time — persistent listings suggest the price (not the market) is what's stuck; bring a comps-based counter.
Questions for the listing agent
- What do current leases actually rent for vs. the listed asking? Can we see a recent rent roll and the last 12 months of T-12 income?
- Is there a deadline driving the sale (1031 exchange, divorce, estate, relocation)? That informs how much negotiation room exists.
- Schools are B-rated — typically a magnet for longer-tenancy family renters. What's the average tenant stay here, and is there a school-zone premium baked into asking?
- The area grade is low — what's the realistic commute time and amenity access for the typical tenant pool here? Any planned neighborhood developments (good or bad) we should know about?
- What's the average days-on-market for RENTAL listings here right now (not sales)? A rising rental-DOM trend means longer vacancies and softer asking-rent achievability than the comps imply.
- What's the recent tenant-quality profile in this submarket — average credit score on applications, eviction rate, late-payment / NSF rate, and stable-employment percentage? A property-management company in the area should have these aggregated.
- How much new for-sale + rental construction is in the pipeline within 1–3 miles? Heavy new supply typically softens prices + rents 12–24 months out; constrained supply supports both.
Investment metrics
- 1% rule
- 0.72% ✗
- Cap rate
- 6.07%
- Cash-on-cash
- -0.79%
- DSCR
- 0.97
- GRM
- 11.5
CMA / ARV
No comps found within radius.
Projected returns pro-forma
-3.0% appreciation · 4.85% rent growth · sell at horizon
- IRR
- -15.9%
- Equity multiple
- 0.43×
- Total profit
- $-64,052
- Equity at exit
- $59,492
- IRR
- -5.0%
- Equity multiple
- 0.65×
- Total profit
- $-39,316
- Equity at exit
- $34,498
Cash invested: $111,720 (down + closing). Projections, not guarantees.
Landlord ↔ Tenant lean methodology
- Overall (STATE)
- 90 Strongly Landlord-Friendly
- State Mississippi
- 90 Strongly Landlord-Friendly · R+11
- County
- — inherits STATE
- City
- — inherits STATE
ZIP-level market 38655
- Rents YoY
- 4.8%
- Active inventory
- 856
- Price-to-rent
- 11.5×
Monthly cashflow live
- Estimated rent
- $2,883 medium interval (Pro) →
- Mortgage (P&I)
- −$2,092
- Tax from tax record
- −$92 /mo · $1,106/yr
- Insurance
- −$166
- HOA
- −$0
- Vacancy / Maint / Mgmt
- −$605
- Net cashflow
- $-73
Break-even live
Sensitivity live
| Price | -10% $153 | -5% $40 | +0% $-73 | +5% $-186 | +10% $-299 |
|---|---|---|---|---|---|
| Rent | -10% $-301 | -5% $-187 | +0% $-73 | +5% $41 | +10% $155 |
| Rate | -1.0pp $128 | -0.5pp $28 | base $-73 | +0.5pp $-176 | +1.0pp $-282 |
UW: 25.0% down · 7.5% · 30yr · 1.5% tax · 5.0% vac · 8.0% maint · 8.0% mgmt
Financing live
Cash to close
- Down payment
- $99,750
- Closing costs
- $11,970
- Reserves months
- —
- Total cash needed
- —
Loan-product check · same deal, 3 products live
Conventional
25% down · 7.5% · 30yr
- Down + closing
- —
- Monthly P&I
- —
- Monthly cashflow
- —
- DSCR
- —
- Eligible?
- —
Personal DTI + credit; lowest rate.
DSCR
20% down · 8.5% · 30yr
- Down + closing
- —
- Monthly P&I
- —
- Monthly cashflow
- —
- DSCR
- —
- Eligible?
- —
No personal income docs; deal must DSCR.
Hard money
10% down · 12.0% · 12mo
- Down + closing
- —
- Monthly P&I
- —
- Monthly cashflow
- —
- DSCR
- —
- Eligible?
- —
Short-term bridge; refi at stabilization.
Rent comps 2 comps
| Address | Beds | Baths | Sqft | Rent | $/sqft | DOM | Units | Dist |
|---|---|---|---|---|---|---|---|---|
| 301 Baldwin Dr Oxford, MS | 1.0–3.0 | 1.0–3.0 | 935 | $3,075 | $3.29 | 25d | 6 | 0.38mi |
| 814 Claremont Ave Oxford, MS | 1.0–3.0 | 1.0–2.0 | 1108 | $2,655 | $2.40 | 3d | 97 | 0.72mi |
Listing history 13 events
-
2026-06-21days on market $399,000 Active 20 DOM
-
2026-06-19days on market $399,000 Active 18 DOM
-
2026-06-18days on market $399,000 Active 17 DOM
-
2026-06-17days on market $399,000 Active 16 DOM
-
2026-06-16days on market $399,000 Active 15 DOM
-
2026-06-15days on market $399,000 Active 14 DOM
-
2026-06-14days on market $399,000 Active 12 DOM
-
2026-06-12days on market $399,000 Active 11 DOM
-
2026-06-09days on market $399,000 Active 8 DOM
-
2026-06-08days on market $399,000 Active 7 DOM
-
2026-06-07days on market $399,000 Active 6 DOM
-
2026-06-02remarks 656-char remark
-
2026-06-02$399,000 Active 1 DOM
ⓘ Source: listings_history table (triggers on properties + properties_extension) + one-shot
backfill from property_details.listing_events for pre-trigger history.
Tax reassessment forecast MS · Resets to sale price
- Current annual tax
- $1,106 · $92/mo
- Projected year-2 tax
- $3,152 · $263/mo
- Expected delta
- +$2,046/yr (+$170/mo · 184.9%)
ⓘ Screening estimate from a state-policy table — verify with the county assessor before closing.
Nearby sold comps map
Loading sold comps map…
Walkable amenities ~0.75 mi
Loading nearby amenities…
Taxation est. · year 1
- Rental income
- $34,599
- − Mortgage interest
- −$22,350
- − Property taxes
- −$1,106
- − Insurance
- −$1,995
- − Repairs & maintenance
- −$2,768
- − Management
- −$2,768
- − Depreciation
- −$11,607
- Taxable loss
- −$7,996
- Est. tax savings @ 24.0%
- +$1,919
- After-tax cash flow
- $1,042/yr
For passive investors: Depreciation is non-cash, so a rental often shows a tax loss while cash-flowing — sheltering income. Rental losses are passive: they offset passive income freely, and up to $25,000/yr can offset ordinary (W-2) income if you actively participate and your MAGI is under $100k (phasing out to $0 by $150k); unused losses carry forward. On sale, claimed depreciation is recaptured at up to 25%, and gains may owe capital-gains tax (a 1031 exchange can defer both). Figures are a year-1 estimate at your 24.0% rate — not tax advice; consult a CPA.
Schools (NCES district)
- District
- Oxford School District
- NCES district ID
- 2803450
- Math proficiency
- 53% ▼ -17.00%
- Reading proficiency
- 49% ▼ -8.00%
- Median HH income
- $40,878
- Composite
- 42.77/100
- National rank
- #3152
- State rank
- #12 of 130 in MS
Livability — Oxford
- Score
- 87/100
- State rank
- #1
- US rank
- #285
Category grades
Schools grade is shown separately in the Schools card above.
Census & demographics
- Census place
- Oxford, MS
- County
- Lafayette County · 46,156 people
- City population
- 46,156
- Metro
- Oxford, MS
- Population (ZIP)
- 46,156
- Household income
- $68,235
- Rent vs Own
- Severe rent burden
- 1892.0
Population outlook (Lafayette County) Hauer SSP2
- Today (2025)
- 66,984 people
- By 2030
- 74,726 · +11.6%
- By 2040
- 90,806 · +35.6%
- By 2050
- 108,114 · +61.4%
- By 2075
- 151,215 · +125.7%
- By 2100
- 187,997 · +180.7%
Race, ethnicity, and origin ACS 2023
- Neighborhood character
- Predominantly White (68%)
- Race & ethnicity
- White 68% Black 24% Hispanic / Latino 4% Asian 2% Two or more races 2%
- Common ancestry
- Slovak 3% Serbian 2% Lithuanian 1%
- Foreign-born
- 4% · Canada, China, Vietnam
- Languages at home
- 95% English-only · Spanish 2% Other Indo-European 1% Vietnamese 1%
Political lean MEDSL · Lafayette
- 2024 margin
- Strong R (+21.8) · D 38.3% · R 60.0% · Other 1.7%
- 2008→2024 swing
- -9.4pp toward R · 2008: -12.4pp · 2024: -21.8pp
- All cycles
- 2024: R+21.8 2020: R+12.3 2016: R+14.8 2012: R+15.6 2008: R+12.4
Not yet ingested
- Civics
- —
Market trends
- HPI YoY
- ▼ -204.86%
- Current HPI
- 211.5486
- Rent YoY
- ▲ 4.85%
- Metro
- Oxford, MS
- State GDP YoY
- —
- F500 in state
- 0
Price history
+86.4% since first listed4 events — show timeline
- 2026-06-01 Listed $399,000 NCMBR
- 2023-06-09 Sold (MLS) — NCMBR
- 2022-07-11 Delisted — NCMBR
- 2022-07-11 Listed $214,000 NCMBR
Property tax history
+4.6%/yrLatest (2025): $1,106 · +17.2% YoY. Source: county tax records.
Cash-flow waterfall
monthlySold comps — $/sqft
last 12 mo · ≤1 miLoading sold comps…