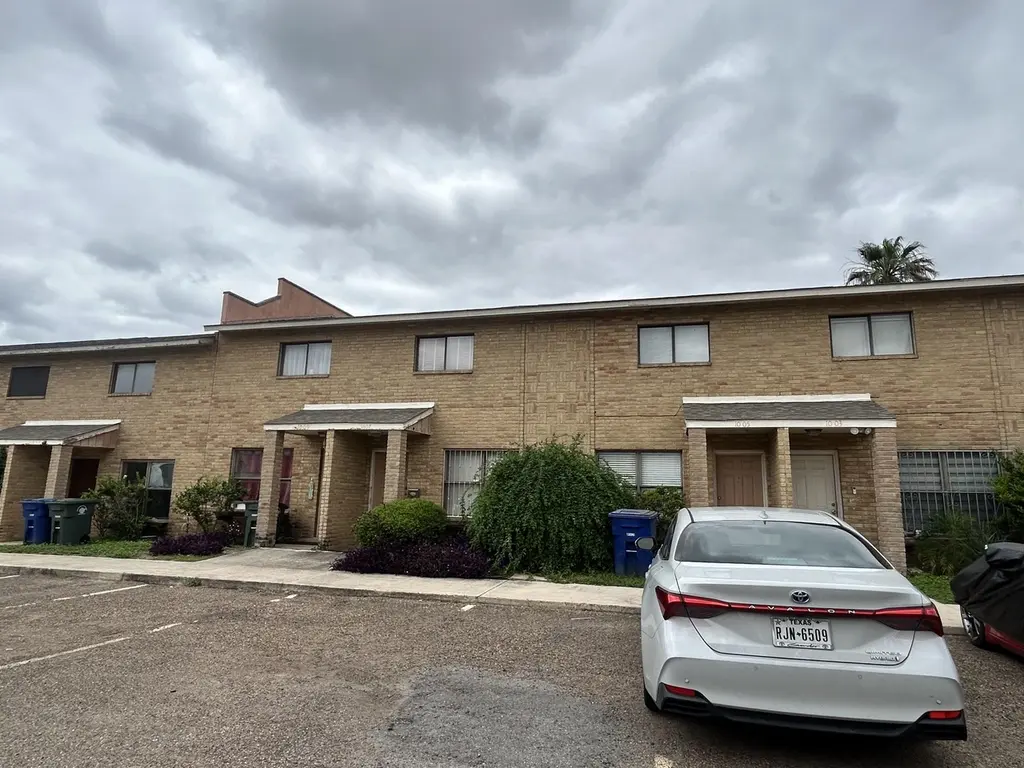
1005 Castle Heights Dr Unit N/A · Laredo, TX
Flood risk No data
- FEMA flood zone
- —
- Chance of flooding over 30 yrs
- —
- Est. flood insurance / yr
- —
Fire risk No data
- Est. fire insurance / yr
- —
Heat risk No data
- Hot days now (above threshold)
- —
- Hot days in 30 yrs
- —
Wind risk No data
- Chance of severe wind over 30 yrs
- —
Air-quality risk No data
- Unhealthy air days now
- —
- Unhealthy air days in 30 yrs
- —
Risk factors via First Street. Map © Google.
Why this score? — see what drove the D+ grade
The composite is a weighted blend of 9 inputs, each scored 0–100. Each bar is that input's sub-score; the figure is the points it added to the 100-point composite (weight × sub-score).
- Cash flow +15.0/30.0
- ARV discount +7.5/15.0
- 1% rule +5.0/10.0
- DSCR +5.0/10.0
- Condition / age +3.8/5.0
- Rent growth +3.7/5.0
- Livability +3.7/5.0
- Schools +2.8/10.0
- Appreciation +0.0/10.0
$1,300
🖨 Deal sheet 📄 Offer letter ✓ Due diligence
Listing remarks
Realtor owned. Prime location in north Laredo. Within walking distance to schools, supermarket, restaurants, shops and metro bus stops. Spacious two bedrooms upstairs. Living and kitchen/ dining area are downstairs. Back porch area is fenced. Unit does not have washer and dryer connection.
Key facts
- Built 1981
- Listed 11 days
Neighborhood map
What this means for you Summary
Snapshot
- This is a 2-bed/1.0-bath single-family listed at $1k. Condition is rated good.
Deal economics
- At list price, monthly cash flow is $952 ($11k/yr) — positive.
- The deal already cash-flows at list — no discount required.
- Meets the 1% rule at list price ($1k rent vs $1k).
- Cap rate 885.4% vs local median 4.1% in Laredo — top-decile yield for the area; either an underpriced asset or a hidden risk that comps aren't pricing in. Stress-test before assuming the spread holds.
Location & tenants
- Location reads 73/100 on livability (#227 in TX) — a middle-class / working-renter tenant base. Strengths: cost of living A+, housing A+, health & safety A+; Watch: schools C-, crime C-, employment D+.
- United ISD (urban): math 27% / reading 38% proficiency, ranked #568 of 826 in TX (top 69%) — families likely to look elsewhere, expect single-tenant / working-renter base with shorter leases; 72% free/reduced lunch — lower-income household profile, screen leases tightly.
- Market conditions: Rents rising fast (+4.7%/yr); 383 active listings in the ZIP; 26 comparable units currently listed for rent nearby; rentals lingering (median 44d on market — plan ~5-8 weeks vacancy on turnover, expect pricing pressure); 100% of comp listings sitting > 30 days — soft ceiling on asking rent; solid renter incomes; 1,448 units permitted in Webb County in 2024 (245 in 5+ unit buildings).
- This rent is only 16% of the median local income ($91k/yr) — well below the 30% rent-burden line; pricing power to push rent on renewal without tenant pushback.
Forward outlook
- Local home prices are declining (-3.0%/yr); year-one equity from $9 of loan paydown is wiped out by about $39 of value loss. Plan a longer hold.
- Webb County population projected at +23% by 2050 — long-run rental-demand tailwind backs the buy-and-hold thesis.
- At projected returns (-3.0% appreciation + 4.7% rent growth), your $364 cash investment doubles in ~1 year — after that, you're playing with house money.
Negotiation context
- Only 12 days on market — expect competitive offers; lowballing is unlikely to land.
- 2 sale attempts with the ask held roughly flat each time — persistent listings suggest the price (not the market) is what's stuck; bring a comps-based counter.
Questions for the listing agent
- Is there a deadline driving the sale (1031 exchange, divorce, estate, relocation)? That informs how much negotiation room exists.
- The area grade is low — what's the realistic commute time and amenity access for the typical tenant pool here? Any planned neighborhood developments (good or bad) we should know about?
- What's the average days-on-market for RENTAL listings here right now (not sales)? A rising rental-DOM trend means longer vacancies and softer asking-rent achievability than the comps imply.
- What's the recent tenant-quality profile in this submarket — average credit score on applications, eviction rate, late-payment / NSF rate, and stable-employment percentage? A property-management company in the area should have these aggregated.
- How much new for-sale + rental construction is in the pipeline within 1–3 miles? Heavy new supply typically softens prices + rents 12–24 months out; constrained supply supports both.
Investment metrics
- 1% rule
- 93.60% ✓
- Cap rate
- 885.36%
- Cash-on-cash
- 3139.54%
- DSCR
- 140.69
- GRM
- 0.1
CMA / ARV
No comps found within radius.
Projected returns pro-forma
-3.0% appreciation · 4.7% rent growth · sell at horizon
- IRR
- —
- Equity multiple
- 172.92×
- Total profit
- $62,579
- Equity at exit
- $194
- IRR
- —
- Equity multiple
- 390.18×
- Total profit
- $141,661
- Equity at exit
- $112
Cash invested: $364 (down + closing). Projections, not guarantees.
Landlord ↔ Tenant lean methodology
- Overall (STATE)
- 87 Strongly Landlord-Friendly
- State Texas
- 87 Strongly Landlord-Friendly · R+5
- County
- — inherits STATE
- City
- — inherits STATE
ZIP-level market 78045
- Home prices YoY
- -34.5%
- Rents YoY
- 4.7%
- Active inventory
- 383
- Price-to-rent
- 0.1×
Monthly cashflow live
- Estimated rent
- $1,217 high interval (Pro) →
- Mortgage (P&I)
- −$7
- Tax est. 1.5%
- −$2 /mo · $20/yr
- Insurance
- −$1
- HOA
- −$0
- Vacancy / Maint / Mgmt
- −$256
- Net cashflow
- $952
Break-even live
UW: 25.0% down · 7.5% · 30yr · 1.5% tax · 5.0% vac · 8.0% maint · 8.0% mgmt
Financing live
Cash to close
- Down payment
- $325
- Closing costs
- $39
- Reserves months
- —
- Total cash needed
- —
Loan-product check · same deal, 3 products live
Conventional
25% down · 7.5% · 30yr
- Down + closing
- —
- Monthly P&I
- —
- Monthly cashflow
- —
- DSCR
- —
- Eligible?
- —
Personal DTI + credit; lowest rate.
DSCR
20% down · 8.5% · 30yr
- Down + closing
- —
- Monthly P&I
- —
- Monthly cashflow
- —
- DSCR
- —
- Eligible?
- —
No personal income docs; deal must DSCR.
Hard money
10% down · 12.0% · 12mo
- Down + closing
- —
- Monthly P&I
- —
- Monthly cashflow
- —
- DSCR
- —
- Eligible?
- —
Short-term bridge; refi at stabilization.
Rent comps 26 comps
| Address | Beds | Baths | Sqft | Rent | $/sqft | DOM | Units | Dist |
|---|---|---|---|---|---|---|---|---|
| 7605 Green Meadow Dr Laredo, TX | 2.0 | 2.0 | 980 | $1,225 | $1.25 | 43d | 2 | 0.55mi |
| 7550 Country Club Dr Laredo, TX | 1.0–3.0 | 1.0–2.0 | 826 | $1,375 | $1.66 | 43d | 23 | 0.69mi |
| 104 Belaire Dr Unit 9 Laredo, TX | 2.0 | 2.0 | 735 | $1,000 | $1.36 | 43d | 1 | 0.80mi |
| 1601 Jacaman Rd Laredo, TX | 2.0 | 2.0 | 1005 | $1,349 | $1.34 | 43d | 1 | 0.82mi |
| 1601 B Jacaman Rd Laredo, TX | 1.0 | 1.0 | 750 | $1,010 | $1.35 | 43d | 1 | 0.83mi |
| 1205 International Blvd #11 Laredo, TX | 2.0 | 2.0 | 943 | $1,150 | $1.22 | 43d | 1 | 0.98mi |
| 401 International Blvd Unit 11 Laredo, TX | 1.0 | 1.5 | 1000 | $1,200 | $1.20 | 43d | 1 | 1.08mi |
| 1502 Calle del Norte Unit 47 Up Laredo, TX | 2.0 | 1.0 | 850 | $950 | $1.12 | 43d | 1 | 1.09mi |
| 1616 Calle del Norte Laredo, TX | 1.0–2.0 | 1.0 | 755 | $950 | $1.26 | 43d | 1 | 1.10mi |
| 1502 Calle del Norte Laredo, TX | 1.0 | 1.0 | 660 | $760 | $1.15 | 43d | 1 | 1.12mi |
| 508 Gale St Apt 9 Laredo, TX | 2.0 | 1.0 | 850 | $975 | $1.15 | 43d | 1 | 1.21mi |
| 508 Gale St Apt 21 Laredo, TX | 2.0 | 1.0 | 850 | $950 | $1.12 | 43d | 1 | 1.21mi |
| 508 Gale St Laredo, TX | 1.0 | 1.0 | 660 | $760 | $1.15 | 43d | 1 | 1.22mi |
| 7402 Springfield Ave Laredo, TX | 1.0–2.0 | 1.0–2.0 | 887 | $1,646 | $1.86 | 43d | 13 | 1.23mi |
| 501 Shiloh Dr Unit 203 Laredo, TX | 2.0 | 2.0 | 980 | $1,150 | $1.17 | 44d | 1 | 1.28mi |
| 511 Shiloh Dr Unit 16 Laredo, TX | 1.0 | 1.0 | 532 | $850 | $1.60 | 43d | 1 | 1.29mi |
| 511 Shiloh Dr Unit 6 Laredo, TX | 1.0 | 1.0 | 532 | $860 | $1.62 | 43d | 1 | 1.29mi |
| 511 Shiloh Dr Unit 11 Laredo, TX | 1.0 | 1.0 | 532 | $795 | $1.49 | 43d | 1 | 1.29mi |
| 507 Shiloh Dr Unit 2 Laredo, TX | 2.0 | 1.0 | 833 | $1,000 | $1.20 | 43d | 1 | 1.29mi |
| 413 Shiloh Dr #102 Laredo, TX | 2.0 | 2.0 | 855 | $1,250 | $1.46 | 43d | 1 | 1.32mi |
| 7305 Wagner Ct Unit A Laredo, TX | 2.0 | 1.0 | 818 | $1,100 | $1.34 | 43d | 1 | 1.33mi |
| 502 Shiloh Dr Unit 101E Laredo, TX | 1.0 | 1.0 | 832 | $1,850 | $2.22 | 43d | 1 | 1.35mi |
| 5816 Longoria Loop Laredo, TX | 3.0 | 2.0 | 1007 | $1,300 | $1.29 | 43d | 1 | 1.35mi |
| 502 Shiloh Dr Unit 301E Laredo, TX | 1.0 | 1.0 | 845 | $1,175 | $1.39 | 43d | 1 | 1.36mi |
| 408 Shiloh Dr Unit 103 Laredo, TX | 2.0 | 2.0 | 969 | $1,200 | $1.24 | 43d | 1 | 1.40mi |
| 7613 King Arthurs Ct Laredo, TX | 1.0–3.0 | 1.5–2.5 | 1160 | $1,875 | $1.62 | 43d | 1 | 1.46mi |
Listing history 9 events
-
2026-06-16days on market $1,300 Active 12 DOM
-
2026-06-15days on market $1,300 Active 11 DOM
-
2026-06-14days on market $1,300 Active 9 DOM
-
2026-06-13days on market $1,300 Active 8 DOM
-
2026-06-10days on market $1,300 Active 6 DOM
-
2026-06-09days on market $1,300 Active 5 DOM
-
2026-06-08days on market $1,300 Active 4 DOM
-
2026-06-07pricedays on market $1,300 Active 3 DOM
-
2026-05-14$139,800 Active 290-char remark
ⓘ Source: listings_history table (triggers on properties + properties_extension) + one-shot
backfill from property_details.listing_events for pre-trigger history.
Nearby sold comps map
Loading sold comps map…
Walkable amenities ~0.75 mi
Loading nearby amenities…
Taxation est. · year 1
- Rental income
- $14,602
- − Mortgage interest
- −$73
- − Property taxes
- −$20
- − Insurance
- −$6
- − Repairs & maintenance
- −$1,168
- − Management
- −$1,168
- − Depreciation
- −$38
- Taxable income
- $12,129
- Est. tax owed @ 24.0%
- −$2,911
- After-tax cash flow
- $8,517/yr
For passive investors: Depreciation is non-cash, so a rental often shows a tax loss while cash-flowing — sheltering income. Rental losses are passive: they offset passive income freely, and up to $25,000/yr can offset ordinary (W-2) income if you actively participate and your MAGI is under $100k (phasing out to $0 by $150k); unused losses carry forward. On sale, claimed depreciation is recaptured at up to 25%, and gains may owe capital-gains tax (a 1031 exchange can defer both). Figures are a year-1 estimate at your 24.0% rate — not tax advice; consult a CPA.
Condition & rehab AI · 14 photos
This property is in good condition with modern updates and a prime location. It is ready for immediate occupancy and can be further enhanced with minor exterior painting and HVAC upgrades.
Value-add opportunities
- Both Painting the exterior brick — Enhances curb appeal and can increase both resale and rental value
- Both Upgrading the HVAC system — Improves comfort and energy efficiency, attracting more buyers
- Both Adding a washer and dryer connection — Solves a major inconvenience and increases the property's functionality
Renovation cost estimate screening
Value-add ROI direction
- Both Painting the exterior brick — Enhances curb appeal and can increase both resale and rental value ↑
- Both Upgrading the HVAC system — Improves comfort and energy efficiency, attracting more buyers ↑
- Both Adding a washer and dryer connection — Solves a major inconvenience and increases the property's functionality ↑
ⓘ Cost ranges are severity-bucket heuristics (US national rule-of-thumb). Get contractor quotes + a written scope before underwriting a rehab budget.
Schools (NCES district)
- District
- United ISD
- NCES district ID
- 4843650
- Math proficiency
- 27% ▼ -36.00%
- Reading proficiency
- 38% ▼ -11.00%
- Median HH income
- $47,780
- Composite
- 28.02/100
- National rank
- #6848
- State rank
- #568 of 826 in TX
Livability — Laredo
- Score
- 73/100
- State rank
- #227
- US rank
- #5399
Category grades
Schools grade is shown separately in the Schools card above.
Census & demographics
- Census place
- Laredo, TX
- County
- Webb County · 67,333 people
- City population
- 67,333
- Metro
- Laredo, TX
- Population (ZIP)
- 67,333
- Household income
- $90,608
- Rent vs Own
- Severe rent burden
- 1042.0
Population outlook (Webb County) Hauer SSP2
- Today (2025)
- 301,387 people
- By 2030
- 316,307 · +5.0%
- By 2040
- 345,636 · +14.7%
- By 2050
- 370,647 · +23.0%
- By 2075
- 413,907 · +37.3%
- By 2100
- 416,458 · +38.2%
Race, ethnicity, and origin ACS 2023
- Neighborhood character
- Predominantly Hispanic (93%)
- Race & ethnicity
- Hispanic / Latino 93% Two or more races 50% White 5%
- Hispanic origin (detail)
- Mexican 87%
- Foreign-born
- 26% · Canada
- Languages at home
- 16% English-only · Spanish 82%
Political lean MEDSL · Webb
- 2024 margin
- Toss-up / Even · D 48.5% · R 50.7%
- 2008→2024 swing
- -45.6pp toward R · 2008: 43.4pp · 2024: -2.2pp
- All cycles
- 2024: R+2.2 2020: D+23.3 2016: D+51.6 2012: D+54.0 2008: D+43.4
Not yet ingested
- Civics
- —
Market trends
- HPI YoY
- ▼ -88.24%
- Current HPI
- 167.3597
- Rent YoY
- ▲ 4.70%
- Metro
- Laredo, TX
- State GDP YoY
- ▲ 3.95%
- F500 in state
- 110
Industry mix (Fortune 500 HQ in TX)
| Industry | F500 HQs | Revenue |
|---|---|---|
| Energy | 16 | $1,198B |
|
||
| Technology | 5 | $198B |
|
||
| Engineering / Construction | 4 | $72B |
|
||
| Energy Services | 3 | $60B |
|
||
| Utilities | 3 | $41B |
|
||
| Healthcare | 2 | $330B |
|
||
Price history
-99.1% since first listed2 events — show timeline
- 2026-06-17 Listed for Rent $1,300 LAOR
- 2026-05-14 Listed $139,800 LAOR
Cash-flow waterfall
monthlySold comps — $/sqft
last 12 mo · ≤1 miLoading sold comps…