118 N Guegnon St · Abbeville, LA
Flood risk 6/10 · Moderate
- FEMA flood zone
- X (shaded)
- Chance of flooding over 30 yrs
- 0.57%
- Est. flood insurance / yr
- $507 – $1,088
Fire risk 2/10 · Minimal
- Est. fire insurance / yr
- $1,269 – $2,357
Heat risk 10/10 · Severe
- Hot days now (above 108°F)
- 7 days/yr
- Hot days in 30 yrs
- 22 days/yr
Wind risk 9/10 · Severe
- Chance of severe wind over 30 yrs
- 99.0%
Air-quality risk 1/10 · Minimal
- Unhealthy air days now
- 0 days/yr
- Unhealthy air days in 30 yrs
- 0 days/yr
Risk factors via First Street. Map © Google.
Why this score? — see what drove the B- grade
The composite is a weighted blend of 9 inputs, each scored 0–100. Each bar is that input's sub-score; the figure is the points it added to the 100-point composite (weight × sub-score).
- Cash flow +30.0/30.0
- 1% rule +10.0/10.0
- DSCR +10.0/10.0
- ARV discount +7.5/15.0
- Schools +3.9/10.0
- Livability +3.4/5.0
- Rent growth +2.5/5.0
- Condition / age +2.5/5.0
- Appreciation +0.0/10.0
$99,000
🖨 Deal sheet 📄 Offer letter ✓ Due diligence
Listing remarks
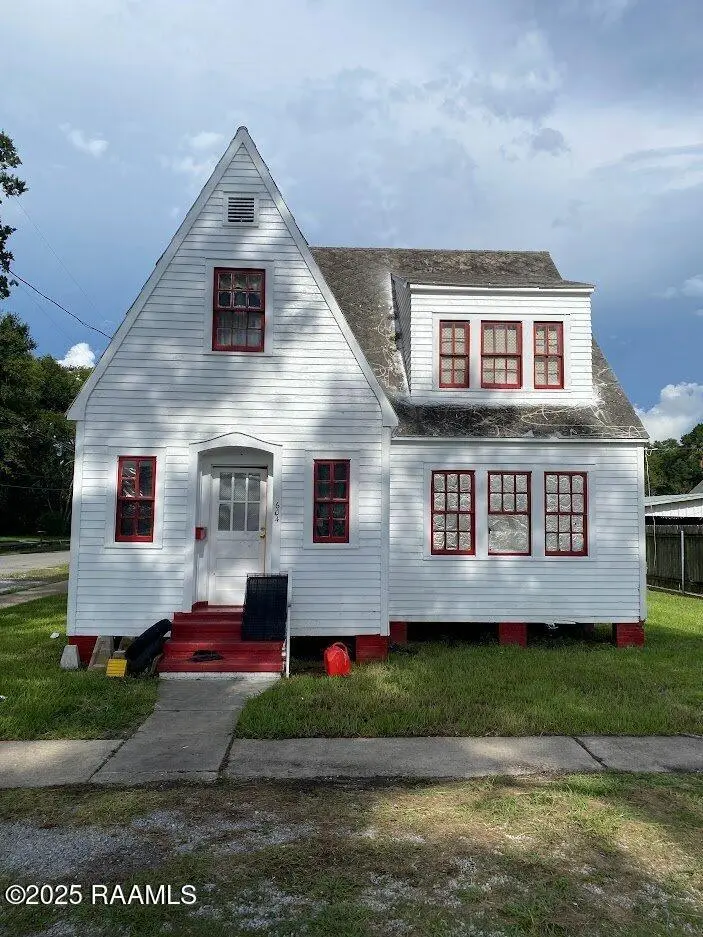
reat investment property fully rented. Currently being used as a triplex, two units are 1 bedroom, 1 bath and the one unit is 2 bedrooms 1 bath.
Key facts
- 4 parking spots
- Listed 7 days
Property features AI
Finance
- Financial info: All 3 units are currently leased
Exterior
- Parking: On-street parking available for approximately 4 vehicles; Open parking available
- Utilities: Cable available; Public sewer
- Home design: Multi-family property; 3 total units
- Construction: Frame construction with wood siding; Slate roof
- Exterior features: Lighting; No fencing
Interior
- Kitchen: Electric cooktop
- Bedrooms: Multifamily property with 3 separate units (unit-level bedroom counts not provided)
- Flooring: Tile
- Bathrooms: 3 full bathrooms (total for property)
- Heating & cooling: Window units and AC units for cooling; Heat units (other heating type indicated)
- Interior features: Tile flooring; Lighting (interior/exterior lighting noted)
- Laundry & utility: No appliances listed besides electric cooktop (washer/dryer not specified)
Neighborhood map
What this means for you Summary
Snapshot
- This is a 12-bed/9.0-bath single-family listed at $99k.
Deal economics
- At list price, monthly cash flow is $704 ($8k/yr) — positive.
- The deal already cash-flows at list — no discount required.
- Meets the 1% rule at list price ($2k rent vs $99k).
- Cap rate 14.8% vs local median 6.6% in Abbeville — top-decile yield for the area; either an underpriced asset or a hidden risk that comps aren't pricing in. Stress-test before assuming the spread holds.
Location & tenants
- Location reads 68/100 on livability (#94 in LA) — a middle-class / working-renter tenant base. Strengths: cost of living A+, housing A+, health & safety A+; Watch: crime F, amenities F, commute F.
- Vermilion Parish (town): math 40% / reading 53% proficiency, ranked #15 of 98 in LA (top 15%) — families likely to look elsewhere, expect single-tenant / working-renter base with shorter leases.
- Zoned schools: Eaton Park Elementary School (439 students, 90% FRL); J.H. Williams Middle School (math 13% / reading 30%, grade F, #158 of 218 statewide, top 73%, 528 students, 84% FRL); Abbeville High School (math 12% / reading 32%, grade F, #171 of 265 statewide, top 66%, 607 students, 81% FRL) — zoned schools average 85% FRL vs 53% district-wide (32 pts higher); higher-poverty schools than district average — tighter screening recommended.
- Zoned-school proficiency averages 22% at this address vs 46% district-wide (-25 pts) — the specific schools serving this property underperform the Vermilion Parish average; the district grade overstates school quality for this exact location.
- Market conditions: 180 active listings in the ZIP; 228 units permitted in Vermilion Parish in 2024 (0 in 5+ unit buildings).
Forward outlook
- Local home prices are declining (-3.0%/yr); year-one equity from $684 of loan paydown is wiped out by about $3k of value loss. Plan a longer hold.
- Vermilion County population projected at +10% by 2050 — modest demand growth; plan on rents tracking national, not racing it.
- At projected returns (-3.0% appreciation + 3.0% rent growth), your $28k cash investment doubles in ~4 years — after that, you're playing with house money.
Negotiation context
- Only 7 days on market — expect competitive offers; lowballing is unlikely to land.
- 2 sale attempts with the ask held roughly flat each time — persistent listings suggest the price (not the market) is what's stuck; bring a comps-based counter.
Risks & watch-outs
- Climate carrying-cost: major flood risk; severe wind risk, 99% chance of damaging wind over 30y; extreme-heat days projected 7→22/yr by 2055 (HVAC capex compounding) — expect insurance premiums to compound above CPI over the hold.
Questions for the listing agent
- Is there a deadline driving the sale (1031 exchange, divorce, estate, relocation)? That informs how much negotiation room exists.
- Schools are B-rated — typically a magnet for longer-tenancy family renters. What's the average tenant stay here, and is there a school-zone premium baked into asking?
- Crime grade is F in this area — have there been break-ins, vandalism, or insurance claims at this property in the last 3 years? What carrier currently insures it and at what premium?
- What's the average days-on-market for RENTAL listings here right now (not sales)? A rising rental-DOM trend means longer vacancies and softer asking-rent achievability than the comps imply.
- What's the recent tenant-quality profile in this submarket — average credit score on applications, eviction rate, late-payment / NSF rate, and stable-employment percentage? A property-management company in the area should have these aggregated.
- How much new for-sale + rental construction is in the pipeline within 1–3 miles? Heavy new supply typically softens prices + rents 12–24 months out; constrained supply supports both.
Investment metrics
- 1% rule
- 1.66% ✓
- Cap rate
- 14.82%
- Cash-on-cash
- 30.46%
- DSCR
- 2.36
- GRM
- 5.0
CMA / ARV
No comps found within radius.
Projected returns pro-forma
-3.0% appreciation · 3.0% rent growth · sell at horizon
- IRR
- 25.1%
- Equity multiple
- 2.04×
- Total profit
- $28,741
- Equity at exit
- $14,761
- IRR
- 32.9%
- Equity multiple
- 3.98×
- Total profit
- $82,609
- Equity at exit
- $8,560
Cash invested: $27,720 (down + closing). Projections, not guarantees.
Landlord ↔ Tenant lean methodology
- Overall (STATE)
- 90 Strongly Landlord-Friendly
- State Louisiana
- 90 Strongly Landlord-Friendly · R+12
- County
- — inherits STATE
- City
- — inherits STATE
ZIP-level market 70510
- Active inventory
- 180
- Price-to-rent
- 5.0×
Monthly cashflow live
- Estimated rent
- $1,644 medium interval (Pro) →
- Mortgage (P&I)
- −$519
- Tax from tax record
- −$35 /mo · $416/yr
- Insurance
- −$41
- HOA
- −$0
- Vacancy / Maint / Mgmt
- −$345
- Net cashflow
- $704
Break-even live
UW: 25.0% down · 7.5% · 30yr · 1.5% tax · 5.0% vac · 8.0% maint · 8.0% mgmt
Financing live
Cash to close
- Down payment
- $24,750
- Closing costs
- $2,970
- Reserves months
- —
- Total cash needed
- —
Loan-product check · same deal, 3 products live
Conventional
25% down · 7.5% · 30yr
- Down + closing
- —
- Monthly P&I
- —
- Monthly cashflow
- —
- DSCR
- —
- Eligible?
- —
Personal DTI + credit; lowest rate.
DSCR
20% down · 8.5% · 30yr
- Down + closing
- —
- Monthly P&I
- —
- Monthly cashflow
- —
- DSCR
- —
- Eligible?
- —
No personal income docs; deal must DSCR.
Hard money
10% down · 12.0% · 12mo
- Down + closing
- —
- Monthly P&I
- —
- Monthly cashflow
- —
- DSCR
- —
- Eligible?
- —
Short-term bridge; refi at stabilization.
Listing history 7 events
-
2026-06-18days on market $99,000 Active 7 DOM
-
2026-06-17days on market $99,000 Active 6 DOM
-
2026-06-16days on market $99,000 Active 5 DOM
-
2026-06-15days on market $99,000 Active 4 DOM
-
2026-06-14days on market $99,000 Active 2 DOM
-
2026-06-13remarks 144-char remark
-
2026-06-13$99,000 Active 1 DOM
ⓘ Source: listings_history table (triggers on properties + properties_extension) + one-shot
backfill from property_details.listing_events for pre-trigger history.
Tax reassessment forecast LA · Resets to sale price
- Current annual tax
- $416 · $35/mo
- Projected year-2 tax
- $544 · $45/mo
- Expected delta
- +$129/yr (+$11/mo · 31.0%)
ⓘ Screening estimate from a state-policy table — verify with the county assessor before closing.
Climate risk First Street
- Flood 6/10 Major FEMA zone X (shaded) · 57% chance over 30 yrs
- Wildfire 2/10 Low
- Heat 10/10 Extreme 7 d/yr ≥108°F today · 22 d/yr by 30 yrs out
- Wind 9/10 Extreme 99% chance of damaging wind over 30 yrs
- Air quality 1/10 Low 0 unhealthy d/yr today · 0 by 30 yrs out
Nearby sold comps map
Loading sold comps map…
Walkable amenities ~0.75 mi
Loading nearby amenities…
Taxation est. · year 1
- Rental income
- $19,727
- − Mortgage interest
- −$5,546
- − Property taxes
- −$416
- − Insurance
- −$495
- − Repairs & maintenance
- −$1,578
- − Management
- −$1,578
- − Depreciation
- −$2,880
- Taxable income
- $7,234
- Est. tax owed @ 24.0%
- −$1,736
- After-tax cash flow
- $6,707/yr
For passive investors: Depreciation is non-cash, so a rental often shows a tax loss while cash-flowing — sheltering income. Rental losses are passive: they offset passive income freely, and up to $25,000/yr can offset ordinary (W-2) income if you actively participate and your MAGI is under $100k (phasing out to $0 by $150k); unused losses carry forward. On sale, claimed depreciation is recaptured at up to 25%, and gains may owe capital-gains tax (a 1031 exchange can defer both). Figures are a year-1 estimate at your 24.0% rate — not tax advice; consult a CPA.
Schools (NCES district)
- District
- Vermilion Parish
- NCES district ID
- 2201800
- Math proficiency
- 40% ▼ -38.00%
- Reading proficiency
- 53% ▼ -32.00%
- Median HH income
- $45,115
- Composite
- 39.37/100
- National rank
- #3974
- State rank
- #15 of 98 in LA
Livability — Abbeville
- Score
- 68/100
- State rank
- #94
- US rank
- #9800
Category grades
Schools grade is shown separately in the Schools card above.
Census & demographics
- Census place
- Abbeville, LA
- Population (ZIP)
- 23,909
Population outlook (Vermilion County) Hauer SSP2
- Today (2025)
- 64,095 people
- By 2030
- 65,915 · +2.8%
- By 2040
- 68,985 · +7.6%
- By 2050
- 70,804 · +10.5%
- By 2075
- 73,897 · +15.3%
- By 2100
- 71,793 · +12.0%
Race, ethnicity, and origin ACS 2023
- Neighborhood character
- Majority White (65%)
- Race & ethnicity
- White 65% Black 24% Two or more races 4% Hispanic / Latino 4% Asian 4%
- Common ancestry
- Lithuanian 15% Italian 1%
- Foreign-born
- 5% · Vietnam, Canada
- Languages at home
- 87% English-only · French/Haitian/Cajun 6% Vietnamese 3% Spanish 2%
Political lean MEDSL · Vermilion
- 2024 margin
- Solid R (+63.8) · D 17.6% · R 81.4% · Other 1.1%
- 2008→2024 swing
- -16.3pp toward R · 2008: -47.5pp · 2024: -63.8pp
- All cycles
- 2024: R+63.8 2020: R+61.9 2016: R+59.6 2012: R+52.8 2008: R+47.5
Not yet ingested
- Civics
- —
Market trends
- HPI YoY
- ▼ -70.44%
- Current HPI
- 97.6131
- Rent YoY
- —
- Metro
- —
- State GDP YoY
- ▲ 3.29%
- F500 in state
- 10
Industry mix (Fortune 500 HQ in LA)
| Industry | F500 HQs | Revenue |
|---|---|---|
| Telecommunications | 2 | $23B |
|
||
| Utilities | 1 | $12B |
|
||
| Wholesale / Distribution | 1 | $5B |
|
||
| Advertising | 1 | $2B |
|
||
Price history
-1.0% since first listed2 events — show timeline
- 2026-06-02 Listed $99,000 AcadianaMLS
- 2025-10-27 Listed $100,000 AcadianaMLS
Property tax history
+0.7%/yrLatest (2025): $416 · -0.3% YoY. Source: county tax records.
Cash-flow waterfall
monthlySold comps — $/sqft
last 12 mo · ≤1 miLoading sold comps…