8935 Old Cedar Ave S #211 · Bloomington, MN
Flood risk 1/10 · Minimal
- FEMA flood zone
- X (unshaded)
- Chance of flooding over 30 yrs
- 0.0%
- Est. flood insurance / yr
- $473 – $860
Fire risk 4/10 · Minor
- Est. fire insurance / yr
- $888 – $1,650
Heat risk 2/10 · Minimal
- Hot days now (above 98°F)
- 7 days/yr
- Hot days in 30 yrs
- 14 days/yr
Wind risk 2/10 · Minimal
- Chance of severe wind over 30 yrs
- —
Air-quality risk 2/10 · Minimal
- Unhealthy air days now
- 1 days/yr
- Unhealthy air days in 30 yrs
- 1 days/yr
Risk factors via First Street. Map © Google.
Why this score? — see what drove the F grade
The composite is a weighted blend of 9 inputs, each scored 0–100. Each bar is that input's sub-score; the figure is the points it added to the 100-point composite (weight × sub-score).
- ARV discount +7.5/15.0
- 1% rule +7.0/10.0
- Cash flow +6.6/30.0
- Livability +3.8/5.0
- Schools +3.7/10.0
- Condition / age +2.5/5.0
- Rent growth +2.2/5.0
- DSCR +0.8/10.0
- Appreciation +0.0/10.0
$139,900
🖨 Deal sheet 📄 Offer letter ✓ Due diligence
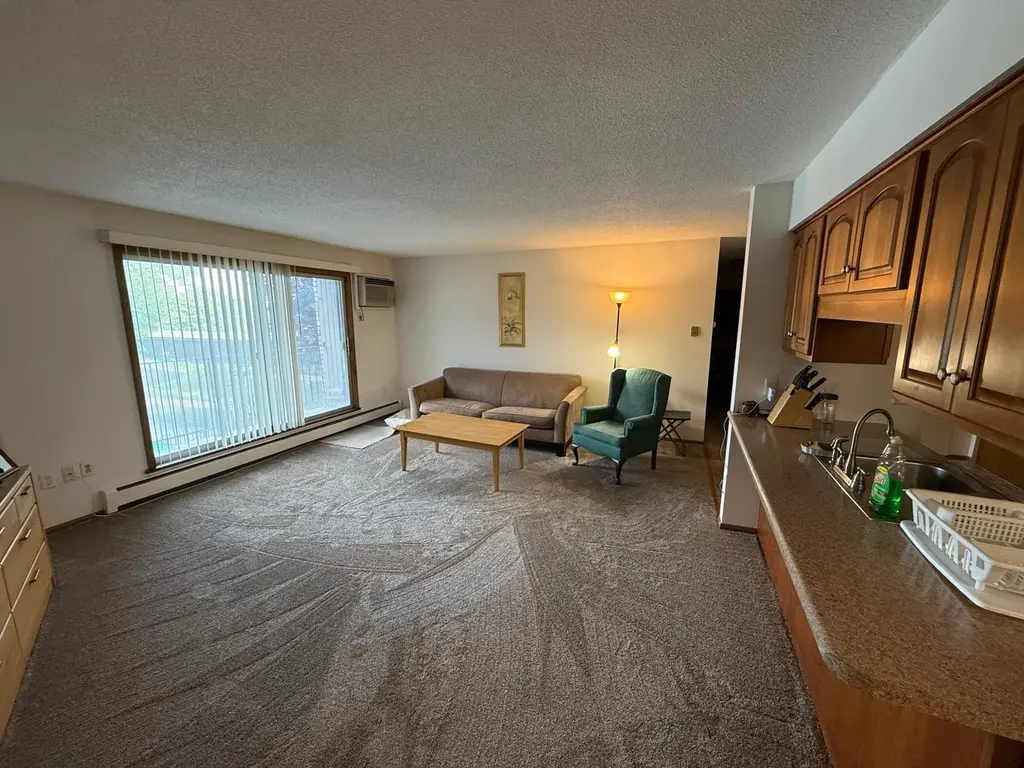
Listing remarks MLS
Great location, near Mall of America, & Airport Pool, Sauna, Storage locker, Building Security Camera's. New refrigerator, New Rang and new dish washer will be delivered on 07/16. New hard wood floor in the dining room, new carpet & fresh paint 6 month ago. Private storage. New garbage disposal & new electric panel box. Party room available.
Key facts
- Party room available
- Sauna
- Private storage
Tags
Neighborhood map
What this means for you Summary
Snapshot
- This is a 2-bed/1.5-bath condo listed at $140k.
Deal economics
- At list price, monthly cash flow is $-233 ($-3k/yr) — negative.
- To cash-flow at today's rent, offer at most $99k (29.4% below list).
- Meets the 1% rule at list price ($2k rent vs $140k).
- Recommended offer: $99k (29.4% below list) — sets the bar for cash-flow.
- Cap rate 4.3% vs local median 3.5% in Bloomington — meaningfully above typical; check what's discounted (condition, days-on-market, listing class) to confirm the premium yield is real.
Location & tenants
- Location reads 76/100 on livability (#168 in MN, #3,640 nationally) — a middle-class / working-renter tenant base. Strengths: commute A+, employment A+, housing A+; Watch: crime D-, amenities F, health & safety F.
- Bloomington Public School District (urban): math 35% / reading 49% proficiency, ranked #192 of 301 in MN (top 64%) — families likely to look elsewhere, expect single-tenant / working-renter base with shorter leases.
- Market conditions: Rents soft (-1.3%/yr); 20 active listings in the ZIP; 13 comparable units currently listed for rent nearby; rentals leasing fast (median 5d on market — plan ~1-2 weeks tenant-placement turnaround); solid renter incomes; 4,651 units permitted in Hennepin County in 2024 (2,443 in 5+ unit buildings).
Forward outlook
- Local home prices are declining (-3.0%/yr); year-one equity from $967 of loan paydown is wiped out by about $4k of value loss. Plan a longer hold.
- Hennepin County population projected at +30% by 2050 — long-run rental-demand tailwind backs the buy-and-hold thesis.
Negotiation context
- It's been on market 343 days — a 12% lower offer ($123k) is reasonable based on typical stale-listing flexibility.
- 4 sale attempts since 25y ago with the ask held roughly flat each time — persistent listings suggest the price (not the market) is what's stuck; bring a comps-based counter.
- Current owner paid $95k; 47% above their basis — modest negotiation headroom, anchor on the comps not their cost.
Risks & watch-outs
- Watch-outs: HOA is 39% of rent.
Questions for the listing agent
- What do current leases actually rent for vs. the listed asking? Can we see a recent rent roll and the last 12 months of T-12 income?
- It's been on market 343 days. Have you received any prior offers? Is the seller open to a 29% concession, seller financing, or rate buy-down credit?
- Built in 1972 — when were the roof, HVAC, electrical panel, plumbing, and water heater last replaced?
- What does the HOA fee cover, when was the last increase, and are there any pending special assessments or reserve-fund shortfalls?
- Any open or pending special assessments — roof, HVAC, plumbing, elevator, façade? What's the per-unit balance and payoff schedule, and is the seller paying it off at close or rolling it to the buyer?
- Why hasn't it sold? Are there any deal-killer items the seller is aware of (foundation, flood, title, zoning, code violations)?
- Is there a deadline driving the sale (1031 exchange, divorce, estate, relocation)? That informs how much negotiation room exists.
- Schools are B-rated — typically a magnet for longer-tenancy family renters. What's the average tenant stay here, and is there a school-zone premium baked into asking?
- Crime grade is D in this area — have there been break-ins, vandalism, or insurance claims at this property in the last 3 years? What carrier currently insures it and at what premium?
- The area grade is low — what's the realistic commute time and amenity access for the typical tenant pool here? Any planned neighborhood developments (good or bad) we should know about?
- What's the average days-on-market for RENTAL listings here right now (not sales)? A rising rental-DOM trend means longer vacancies and softer asking-rent achievability than the comps imply.
- What's the recent tenant-quality profile in this submarket — average credit score on applications, eviction rate, late-payment / NSF rate, and stable-employment percentage? A property-management company in the area should have these aggregated.
- How much new apartment / multifamily construction is in the pipeline within 1–3 miles? Heavy new supply (>2% of stock underway) typically softens rents 12–24 months out; light construction supports rent growth.
Investment metrics
- 1% rule
- 1.20% ✓
- Cap rate
- 4.30%
- Cash-on-cash
- -7.13%
- DSCR
- 0.68
- GRM
- 7.0
CMA / ARV
- ARV (median comp)
- $356,381
- List price
- $139,900
- Delta
- -60.74%
- Verdict
- UNDERPRICED
- Comps
- 3 within 2.0 mi
Projected returns pro-forma
-3.0% appreciation · 0.0% rent growth · sell at horizon
- IRR
- -34.5%
- Equity multiple
- -0.07×
- Total profit
- $-42,024
- Equity at exit
- $20,860
- IRR
- -88.2%
- Equity multiple
- -0.87×
- Total profit
- $-73,091
- Equity at exit
- $12,096
Cash invested: $39,172 (down + closing). Projections, not guarantees.
Landlord ↔ Tenant lean methodology
- Overall (STATE)
- 46 Balanced
- State Minnesota
- 46 Balanced · D+2
- County
- — inherits STATE
- City
- — inherits STATE
ZIP-level market 55425
- Home prices YoY
- -22.1%
- Rents YoY
- -1.3%
- Active inventory
- 20
- Price-to-rent
- 7.0×
Monthly cashflow live
- Estimated rent
- $1,675 high interval (Pro) →
- Mortgage (P&I)
- −$734
- Tax from tax record
- −$110 /mo · $1,323/yr
- Insurance
- −$58
- HOA
- −$654
- Vacancy / Maint / Mgmt
- −$352
- Net cashflow
- $-233
Break-even live
UW: 25.0% down · 7.5% · 30yr · 1.5% tax · 5.0% vac · 8.0% maint · 8.0% mgmt
Financing live
Cash to close
- Down payment
- $34,975
- Closing costs
- $4,197
- Reserves months
- —
- Total cash needed
- —
Loan-product check · same deal, 3 products live
Conventional
25% down · 7.5% · 30yr
- Down + closing
- —
- Monthly P&I
- —
- Monthly cashflow
- —
- DSCR
- —
- Eligible?
- —
Personal DTI + credit; lowest rate.
DSCR
20% down · 8.5% · 30yr
- Down + closing
- —
- Monthly P&I
- —
- Monthly cashflow
- —
- DSCR
- —
- Eligible?
- —
No personal income docs; deal must DSCR.
Hard money
10% down · 12.0% · 12mo
- Down + closing
- —
- Monthly P&I
- —
- Monthly cashflow
- —
- DSCR
- —
- Eligible?
- —
Short-term bridge; refi at stabilization.
Rent comps 13 comps
| Address | Beds | Baths | Sqft | Rent | $/sqft | DOM | Units | Dist |
|---|---|---|---|---|---|---|---|---|
| 8935 Old Cedar Ave S #202 Minneapolis, MN | 2.0 | 1.5 | 1030 | $1,850 | $1.80 | 14d | 1 | 0.01mi |
| 8813 18th Ave S Unit 3 Bloomington, MN | 2.0 | 1.0 | 750 | $1,275 | $1.70 | 17d | 1 | 0.16mi |
| 9100 Old Cedar Ave S Minneapolis, MN | 2.0 | 1.0 | 850 | $1,310 | $1.54 | 4d | 4 | 0.27mi |
| 8600 Old Cedar Ave S Minneapolis, MN | 1.0–2.0 | 1.0 | 1012 | $1,380 | $1.36 | 17d | 1 | 0.39mi |
| 1930 E 86th St Bloomington, MN | 2.0 | 1.0 | 787 | $1,449 | $1.84 | 2d | 65 | 0.47mi |
| 1926 E 86th St Bloomington, MN | 2.0 | 1.0 | 884 | $1,696 | $1.92 | 4d | 19 | 0.53mi |
| 9400 Old Cedar Ave S Bloomington, MN | 1.0–2.0 | 1.0–1.5 | 840 | $2,000 | $2.38 | 4d | 2 | 0.61mi |
| 9400 Old Cedar Ave S #219 Minneapolis, MN | 2.0 | 1.5 | 980 | $2,000 | $2.04 | 2d | 1 | 0.62mi |
| 9119 10th Ave S Minneapolis, MN | 3.0 | 1.0 | 1100 | $2,295 | $2.09 | 20d | 1 | 0.72mi |
| 8162 Bloomington Ave Minneapolis, MN | 2.0–3.0 | 1.5 | 1095 | $1,815 | $1.66 | 2d | 9 | 1.04mi |
| 8100 12th Ave S Minneapolis, MN | 1.0–2.0 | 1.0–2.0 | 805 | $1,375 | $1.71 | 4d | 6 | 1.14mi |
| 7962 Bloomington Ave S Unit 7962 Bloomington, MN | 3.0 | 1.5 | 1200 | $1,800 | $1.50 | 4d | 1 | 1.19mi |
| 8100 31st Ave S Minneapolis, MN | 2.0 | 1.0–2.0 | 881 | $2,708 | $3.07 | 1d | 29 | 1.37mi |
HOA detail condo
- Monthly dues
- $654 · $7,848/yr
- Likely covers
- trashelectricpoolsecurity
- Assessments
- None detected in remarks — confirm with the listing agent.
Listing history 27 events
-
2026-06-18days on market $139,900 Active 343 DOM
-
2026-06-17days on market $139,900 Active 342 DOM
-
2026-06-16days on market $139,900 Active 341 DOM
-
2026-06-15days on market $139,900 Active 340 DOM
-
2026-06-13days on market $139,900 Active 338 DOM
-
2026-06-09days on market $139,900 Active 334 DOM
-
2026-06-08days on market $139,900 Active 333 DOM
-
2026-06-07days on market $139,900 Active 332 DOM
-
2026-06-04days on market $139,900 Active 329 DOM
-
2026-06-03days on market $139,900 Active 328 DOM
-
2026-06-02days on market $139,900 Active 327 DOM
-
2026-06-01days on market $139,900 Active 326 DOM
-
2026-05-31days on market $139,900 Active 325 DOM
-
2026-03-20price $139,900 355-char remark
Show marketing remark (355 chars)
Great location, near Mall of America, & Airport Pool, Sauna, Storage locker, Building Security Camera's. New refrigerator, New Rang and new dish washer will be delivered on 07/16. New hard wood floor in the dining room, new carpet & fresh paint 6 month ago. Private storage. New garbage disposal & new electric panel box. Party room available.
-
2025-07-10$144,000 Active 355-char remark
Show marketing remark (355 chars)
Great location, near Mall of America, & Airport Pool, Sauna, Storage locker, Building Security Camera's. New refrigerator, New Rang and new dish washer will be delivered on 07/16. New hard wood floor in the dining room, new carpet & fresh paint 6 month ago. Private storage. New garbage disposal & new electric panel box. Party room available.
-
2016-05-05soldstatus $94,900 Sold 329-char remark
Show marketing remark (329 chars)
Newly Updated 2 Bedroom, 2 Bathroom Condo near Mall of America with a Spacious Living Room. Large Walk-in Closet, Balcony Overlooking Pool. Newer Carpet, Fresh Paint. Side by Side Stalls in Underground Garage. With additional Amenities of Outdoor Pool, Sauna, Party Room, Elevator, Storage Locker, and Building Security Camera's.
-
2016-03-25status Pending 329-char remark
Show marketing remark (329 chars)
Newly Updated 2 Bedroom, 2 Bathroom Condo near Mall of America with a Spacious Living Room. Large Walk-in Closet, Balcony Overlooking Pool. Newer Carpet, Fresh Paint. Side by Side Stalls in Underground Garage. With additional Amenities of Outdoor Pool, Sauna, Party Room, Elevator, Storage Locker, and Building Security Camera's.
-
2016-03-09historical Contingent - Subject to Statutory Rescission 329-char remark
Show marketing remark (329 chars)
Newly Updated 2 Bedroom, 2 Bathroom Condo near Mall of America with a Spacious Living Room. Large Walk-in Closet, Balcony Overlooking Pool. Newer Carpet, Fresh Paint. Side by Side Stalls in Underground Garage. With additional Amenities of Outdoor Pool, Sauna, Party Room, Elevator, Storage Locker, and Building Security Camera's.
-
2016-03-07$94,900 Active 329-char remark
Show marketing remark (329 chars)
Newly Updated 2 Bedroom, 2 Bathroom Condo near Mall of America with a Spacious Living Room. Large Walk-in Closet, Balcony Overlooking Pool. Newer Carpet, Fresh Paint. Side by Side Stalls in Underground Garage. With additional Amenities of Outdoor Pool, Sauna, Party Room, Elevator, Storage Locker, and Building Security Camera's.
-
2003-02-11soldstatus $121,000
-
2003-01-17soldstatus $121,000
-
2003-01-06historical
-
2002-10-18$124,900
-
2002-02-15soldstatus $114,900
-
2001-09-28soldstatus $114,900
-
2001-07-22historical
-
2001-07-20$114,900
ⓘ Source: listings_history table (triggers on properties + properties_extension) + one-shot
backfill from property_details.listing_events for pre-trigger history.
Tax reassessment forecast MN · Partial reset (capped growth)
- Current annual tax
- $1,323 · $110/mo
- Projected year-2 tax
- $1,445 · $120/mo
- Expected delta
- +$122/yr (+$10/mo · 9.2%)
ⓘ Screening estimate from a state-policy table — verify with the county assessor before closing.
Climate risk First Street
- Flood 1/10 Low FEMA zone X (unshaded) · 0% chance over 30 yrs
- Wildfire 4/10 Moderate
- Heat 2/10 Low 7 d/yr ≥98°F today · 14 d/yr by 30 yrs out
- Wind 2/10 Low
- Air quality 2/10 Low 1 unhealthy d/yr today · 1 by 30 yrs out
Nearby sold comps map
Loading sold comps map…
Walkable amenities ~0.75 mi
Loading nearby amenities…
Taxation est. · year 1
- Rental income
- $20,101
- − Mortgage interest
- −$7,837
- − Property taxes
- −$1,323
- − Insurance
- −$700
- − Repairs & maintenance
- −$1,608
- − Management
- −$1,608
- − HOA
- −$7,848
- − Depreciation
- −$4,070
- Taxable loss
- −$4,892
- Est. tax savings @ 24.0%
- +$1,174
- After-tax cash flow
- $-1,621/yr
For passive investors: Depreciation is non-cash, so a rental often shows a tax loss while cash-flowing — sheltering income. Rental losses are passive: they offset passive income freely, and up to $25,000/yr can offset ordinary (W-2) income if you actively participate and your MAGI is under $100k (phasing out to $0 by $150k); unused losses carry forward. On sale, claimed depreciation is recaptured at up to 25%, and gains may owe capital-gains tax (a 1031 exchange can defer both). Figures are a year-1 estimate at your 24.0% rate — not tax advice; consult a CPA.
Schools (NCES district)
- District
- Bloomington Public School District
- NCES district ID
- 2705790
- Math proficiency
- 35% ▼ -12.00%
- Reading proficiency
- 49% ▼ -4.00%
- Median HH income
- $63,279
- Composite
- 37.37/100
- National rank
- #4431
- State rank
- #192 of 301 in MN
Livability — Bloomington
- Score
- 76/100
- State rank
- #168
- US rank
- #3640
Category grades
Schools grade is shown separately in the Schools card above.
Census & demographics
- Census place
- Bloomington, MN
- County
- Hennepin County · 1,150,272 people
- City population
- 88,605
- Metro
- Minneapolis-St. Paul-Bloomington, MN-WI
- Population (ZIP)
- 10,908
- Household income
- $76,274
- Rent vs Own
- Severe rent burden
- 504.0
Population outlook (Hennepin County) Hauer SSP2
- Today (2025)
- 1,405,227 people
- By 2030
- 1,492,650 · +6.2%
- By 2040
- 1,660,157 · +18.1%
- By 2050
- 1,823,498 · +29.8%
- By 2075
- 2,221,283 · +58.1%
- By 2100
- 2,509,976 · +78.6%
Race, ethnicity, and origin ACS 2023
- Neighborhood character
- Highly diverse neighborhood (Simpson 0.71)
- Race & ethnicity
- White 43% Black 22% Hispanic / Latino 22% Two or more races 13% Asian 6% Native American 1%
- Hispanic origin (detail)
- Mexican 16% Puerto Rican 3%
- Common ancestry
- Portuguese 7% Swiss 2% Romanian 2%
- Foreign-born
- 20% · Canada, China, Vietnam
- Languages at home
- 65% English-only · Spanish 17% Other Asian/Pacific 2% Vietnamese 1%
Political lean MEDSL · Hennepin
- 2024 margin
- Solid D (+42.6) · D 70.2% · R 27.5% · Other 2.3%
- 2008→2024 swing
- +14.0pp toward D · 2008: 28.6pp · 2024: 42.6pp
- All cycles
- 2024: D+42.6 2020: D+43.2 2016: D+35.3 2012: D+27.1 2008: D+28.6
Not yet ingested
- Civics
- —
Market trends
- HPI YoY
- ▼ -74.59%
- Current HPI
- 262.1563
- Rent YoY
- ▼ -1.26%
- Metro
- Minneapolis-St. Paul-Bloomington, MN-WI
- State GDP YoY
- ▲ 2.41%
- F500 in state
- 34
Industry mix (Fortune 500 HQ in MN)
| Industry | F500 HQs | Revenue |
|---|---|---|
| Healthcare | 2 | $407B |
|
||
| Retail | 2 | $150B |
|
||
| Consumer Goods | 2 | $32B |
|
||
| Industrial Machinery | 2 | $6B |
|
||
| Agriculture | 1 | $40B |
|
||
| Healthcare / Medical Devices | 1 | $32B |
|
||
Price history
+21.8% since first listed14 events — show timeline
- 2026-03-20 Price Changed $139,900 NORTHSTARMLS as Distributed by MLS Grid
- 2025-07-10 Listed $144,000 NORTHSTARMLS as Distributed by MLS Grid
- 2016-05-05 Sold (MLS) $94,900 NORTHSTARMLS as Distributed by MLS Grid
- 2016-03-25 Pending — NORTHSTARMLS as Distributed by MLS Grid
- 2016-03-09 Contingent — NORTHSTARMLS as Distributed by MLS Grid
- 2016-03-07 Listed $94,900 NORTHSTARMLS as Distributed by MLS Grid
- 2003-02-11 Sold (Public Records) $121,000 Public Records
- 2003-01-17 Sold (MLS) $121,000 NORTHSTARMLS as Distributed by MLS Grid
- 2003-01-06 Listing Removed — NORTHSTARMLS as Distributed by MLS Grid
- 2002-10-18 Listed $124,900 NORTHSTARMLS as Distributed by MLS Grid
- 2002-02-15 Sold (Public Records) $114,900 Public Records
- 2001-09-28 Sold (MLS) $114,900 NORTHSTARMLS as Distributed by MLS Grid
- 2001-07-22 Listing Removed — NORTHSTARMLS as Distributed by MLS Grid
- 2001-07-20 Listed $114,900 NORTHSTARMLS as Distributed by MLS Grid
Property tax history
+4.8%/yrLatest (2025): $1,323 · -4.9% YoY. Source: county tax records.
Cash-flow waterfall
monthlySold comps — $/sqft
last 12 mo · ≤1 miLoading sold comps…