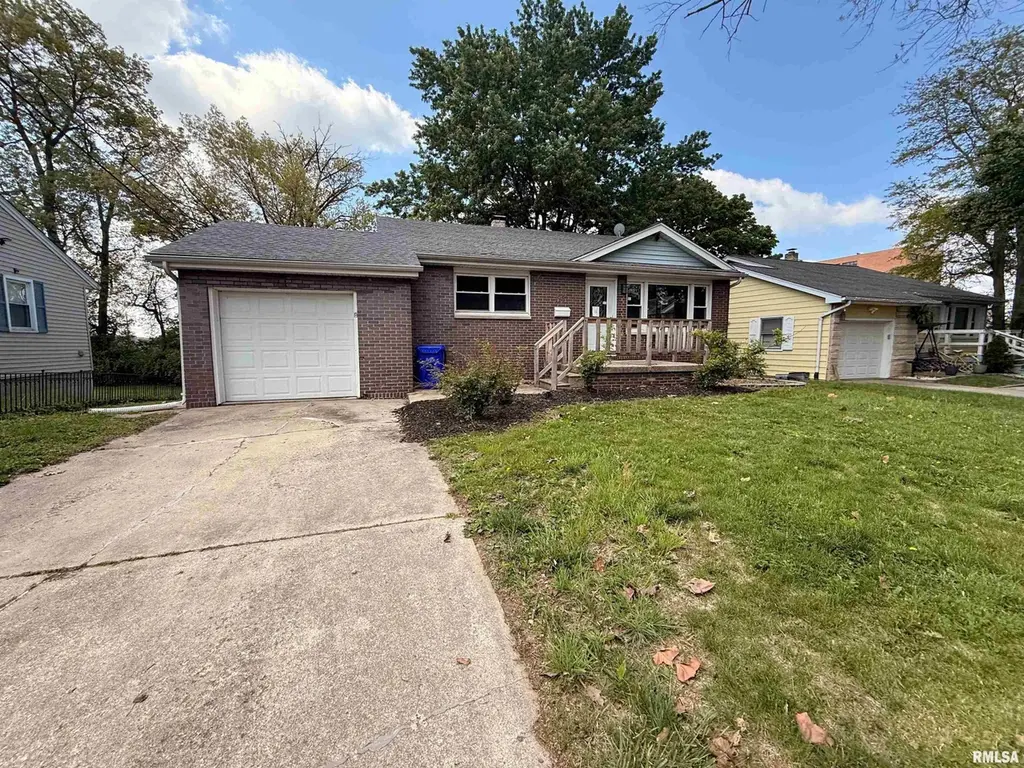
1951 E Florida Ct · Decatur, IL
Flood risk 1/10 · Minimal
- FEMA flood zone
- X (unshaded)
- Chance of flooding over 30 yrs
- 0.0%
- Est. flood insurance / yr
- $473 – $860
Fire risk 1/10 · Minimal
- Est. fire insurance / yr
- $804 – $1,492
Heat risk 4/10 · Minor
- Hot days now (above 106°F)
- 7 days/yr
- Hot days in 30 yrs
- 19 days/yr
Wind risk 2/10 · Minimal
- Chance of severe wind over 30 yrs
- 2.0%
Air-quality risk 2/10 · Minimal
- Unhealthy air days now
- 1 days/yr
- Unhealthy air days in 30 yrs
- 1 days/yr
Risk factors via First Street. Map © Google.
Why this score? — see what drove the B grade
The composite is a weighted blend of 9 inputs, each scored 0–100. Each bar is that input's sub-score; the figure is the points it added to the 100-point composite (weight × sub-score).
- Cash flow +30.0/30.0
- ARV discount +15.0/15.0
- 1% rule +10.0/10.0
- DSCR +10.0/10.0
- Livability +3.0/5.0
- Rent growth +2.5/5.0
- Condition / age +2.5/5.0
- Schools +0.4/10.0
- Appreciation +0.0/10.0
$45,000
🖨 Deal sheet 📄 Offer letter ✓ Due diligence
Listing remarks MLS
RANCH Total Living area is 1667 with Family room and bedroom on the Lower Level. Move in Ready- NEW--- WINDOWS, FLOORING, BATHROOM, FANS AND PAINT. New Roof to be installed in April. Ranch with walk-out basement. Lower Level has large family room and bedroom with full bath. The lower level has 350' of storage. New concrete walk to fenced back yard and screened porch. Private area.
Key facts
- 7,405 sq ft lot
- Garage
- Built 1955
Property features AI
Exterior
- Parking: Attached 1-car garage
- Utilities: Public water; Public sewer
- Home design: Single-family residence; Built in 1955
- Construction: Shingle roof; Year built 1955
- Exterior features: Shingle roof; Sloped lot; Paved road access; Irregular lot dimensions
Interior
- Kitchen: Kitchen on main level (vinyl flooring, approx. 10 x 12)
- Bedrooms: 4 bedrooms total; Main-level bedrooms with hardwood floors (two approx. 10 x 12 and 10 x 10); Basement bedroom with non-hardwood flooring (approx. 10 x 11); Additional-level bedroom/space
- Flooring: Hardwood flooring in several main-level bedrooms; Vinyl flooring in the kitchen; Other flooring in the basement bedroom
- Bathrooms: 2 full bathrooms
- Heating & cooling: Forced air heating; Central air conditioning
- Interior features: Full basement, partially finished; No fireplaces
Neighborhood map
What this means for you Summary
Snapshot
- This is a 4-bed/2.0-bath single-family listed at $45k.
Deal economics
- At list price, monthly cash flow is $608 ($7k/yr) — positive.
- The deal already cash-flows at list — no discount required.
- Meets the 1% rule at list price ($1k rent vs $45k).
- Recommended offer: $44k (1.5% below list) — sets the bar for market timing.
- Cap rate 22.5% vs local median 7.0% in Decatur — top-decile yield for the area; either an underpriced asset or a hidden risk that comps aren't pricing in. Stress-test before assuming the spread holds.
Location & tenants
- Location reads 59/100 on livability (#1,076 in IL) — a working-class tenant base; expect higher turnover. Strengths: cost of living A+, housing A+; Watch: schools F, crime F, amenities F.
- Decatur SD 61 (urban): math 3% / reading 6% proficiency, ranked #605 of 620 in IL (top 98%) — low school quality limits family demand, transient renter base, plan for 1-2y turnover; 73% free/reduced lunch — lower-income household profile, screen leases tightly.
- Market conditions: 193 active listings in the ZIP; 2 comparable units currently listed for rent nearby; 63 units permitted in Macon County in 2024 (0 in 5+ unit buildings).
Forward outlook
- Local home prices are declining (-3.0%/yr); year-one equity from $311 of loan paydown is wiped out by about $1k of value loss. Plan a longer hold.
- Macon County population projected at -24% by 2050 — secular population decline; favor cash flow + early exit over multi-decade hold.
- At projected returns (-3.0% appreciation + 3.0% rent growth), your $13k cash investment doubles in ~2 years — after that, you're playing with house money.
Negotiation context
- It's been on market 23 days — a 2% lower offer ($44k) is reasonable based on typical stale-listing flexibility.
- 3 sale attempts since 16y ago; this cycle's ask is 3362% above the opening price — seller raised mid-cycle; expect resistance to lowballs.
Risks & watch-outs
- Watch-outs: property tax is 2.8% of price; built in 1955 — expect roof / HVAC / electrical / plumbing capex.
Questions for the listing agent
- Built in 1955 — when were the roof, HVAC, electrical panel, plumbing, and water heater last replaced?
- Property tax is high relative to price — has the assessment been appealed recently, and will the sale trigger a re-assessment?
- Is there a deadline driving the sale (1031 exchange, divorce, estate, relocation)? That informs how much negotiation room exists.
- Schools are F-rated, which usually means shorter tenancies and higher turnover. Who's the typical renter profile here, and what's been the actual vacancy rate?
- Crime grade is F in this area — have there been break-ins, vandalism, or insurance claims at this property in the last 3 years? What carrier currently insures it and at what premium?
- What's the average days-on-market for RENTAL listings here right now (not sales)? A rising rental-DOM trend means longer vacancies and softer asking-rent achievability than the comps imply.
- What's the recent tenant-quality profile in this submarket — average credit score on applications, eviction rate, late-payment / NSF rate, and stable-employment percentage? A property-management company in the area should have these aggregated.
- How much new for-sale + rental construction is in the pipeline within 1–3 miles? Heavy new supply typically softens prices + rents 12–24 months out; constrained supply supports both.
Investment metrics
- 1% rule
- 2.72% ✓
- Cap rate
- 22.50%
- Cash-on-cash
- 57.89%
- DSCR
- 3.58
- GRM
- 3.1
CMA / ARV
- ARV (median comp)
- $76,398
- List price
- $45,000
- Delta
- -41.10%
- Verdict
- UNDERPRICED
- Comps
- 20 within 1.0 mi
Show comp detail 11 sales within ~0.75 mi
| Address | Dist | Beds/Ba | Sqft | Sold | Price | $/sf | Match |
|---|---|---|---|---|---|---|---|
| 22 Eastmoreland Ln | 0.38mi | 3/2.0 (-1) | 1,702 (+2%) | 8mo | $129,900 | $76 | 68 |
| 2145 E Dickinson Ave | 0.26mi | 3/2.5 (-1) | 1,778 (+7%) | 10mo | $167,000 | $94 | 61 |
| 1061 E Lake Shore Dr | 0.73mi | 3/1.5 (-1) | 1,716 (+3%) | 1mo | $150,000 | $87 | 53 |
| 246 Southmoreland Pl | 0.36mi | 3/1.5 (-1) | 1,416 (-15%) | 3mo | $115,000 | $81 | 48 |
| 2133 E Moore St | 0.44mi | 3/1.5 (-1) | 1,836 (+10%) | 8mo | $79,000 | $43 | 48 |
| 61 Eastmoreland Dr | 0.36mi | 3/1.5 (-1) | 1,892 (+14%) | 10mo | $170,000 | $90 | 46 |
| 318 Southmoreland Pl | 0.52mi | 3/2.0 (-1) | 1,504 (-10%) | 14mo | $255,000 | $170 | 43 |
| 713 S 17th St | 0.47mi | 3/2.5 (-1) | 1,850 (+11%) | 13mo | $97,200 | $53 | 42 |
| 1816 E Johns Ave | 0.71mi | 3/1.0 (-1) | 1,700 (+2%) | 16mo | $37,000 | $22 | 42 |
| 683 S 22nd St | 0.56mi | 3/1.0 (-1) | 1,457 (-13%) | 9mo | $80,000 | $55 | 36 |
| 544 S 21st St | 0.64mi | 3/2.0 (-1) | 1,456 (-13%) | 17mo | $77,500 | $53 | 30 |
Match score weights: distance 35% · size 25% · config 20% · recency 20%. Top-matched comps best support the ARV.
Projected returns pro-forma
-3.0% appreciation · 3.0% rent growth · sell at horizon
- IRR
- 56.5%
- Equity multiple
- 3.50×
- Total profit
- $31,470
- Equity at exit
- $6,710
- IRR
- 61.4%
- Equity multiple
- 7.15×
- Total profit
- $77,448
- Equity at exit
- $3,891
Cash invested: $12,600 (down + closing). Projections, not guarantees.
Landlord ↔ Tenant lean methodology
- Overall (STATE)
- 43 Moderately Tenant-Leaning
- State Illinois
- 43 Moderately Tenant-Leaning · D+7
- County
- — inherits STATE
- City
- — inherits STATE
ZIP-level market 62521
- Home prices YoY
- -9.0%
- Active inventory
- 193
- Price-to-rent
- 3.1×
Monthly cashflow live
- Estimated rent
- $1,223 medium interval (Pro) →
- Mortgage (P&I)
- −$236
- Tax from tax record
- −$104 /mo · $1,245/yr
- Insurance
- −$19
- HOA
- −$0
- Vacancy / Maint / Mgmt
- −$257
- Net cashflow
- $608
Break-even live
UW: 25.0% down · 7.5% · 30yr · 1.5% tax · 5.0% vac · 8.0% maint · 8.0% mgmt
Financing live
Cash to close
- Down payment
- $11,250
- Closing costs
- $1,350
- Reserves months
- —
- Total cash needed
- —
Loan-product check · same deal, 3 products live
Conventional
25% down · 7.5% · 30yr
- Down + closing
- —
- Monthly P&I
- —
- Monthly cashflow
- —
- DSCR
- —
- Eligible?
- —
Personal DTI + credit; lowest rate.
DSCR
20% down · 8.5% · 30yr
- Down + closing
- —
- Monthly P&I
- —
- Monthly cashflow
- —
- DSCR
- —
- Eligible?
- —
No personal income docs; deal must DSCR.
Hard money
10% down · 12.0% · 12mo
- Down + closing
- —
- Monthly P&I
- —
- Monthly cashflow
- —
- DSCR
- —
- Eligible?
- —
Short-term bridge; refi at stabilization.
Rent comps 2 comps
| Address | Beds | Baths | Sqft | Rent | $/sqft | DOM | Units | Dist |
|---|---|---|---|---|---|---|---|---|
| 759 E Lawrence St Decatur, IL | 3.0 | 1.0 | 1080 | $695 | $0.64 | 43d | 1 | 0.98mi |
| 1524 E Prairie St Decatur, IL | 3.0 | 1.0 | 1400 | $1,250 | $0.89 | 43d | 1 | 1.03mi |
Listing history 6 events
-
2026-05-17historical $1,300
-
2026-05-15$1,300
-
2026-05-02$45,000 Active 105-char remark
-
2010-06-03soldstatus $80,000
-
2010-05-26soldstatus $80,000 394-char remark
Show marketing remark (394 chars)
RANCH Total Living area is 1667 with Family room and bedroom on the Lower Level. Move in Ready- NEW--- WINDOWS, FLOORING, BATHROOM, FANS AND PAINT. New Roof to be installed in April. Ranch with walk-out basement. Lower Level has large family room and bedroom with full bath. The lower level has 350' of storage. New concrete walk to fenced back yard and screened porch. Private area.
-
2010-03-01$83,000 394-char remark
Show marketing remark (394 chars)
RANCH Total Living area is 1667 with Family room and bedroom on the Lower Level. Move in Ready- NEW--- WINDOWS, FLOORING, BATHROOM, FANS AND PAINT. New Roof to be installed in April. Ranch with walk-out basement. Lower Level has large family room and bedroom with full bath. The lower level has 350' of storage. New concrete walk to fenced back yard and screened porch. Private area.
ⓘ Source: listings_history table (triggers on properties + properties_extension) + one-shot
backfill from property_details.listing_events for pre-trigger history.
Tax reassessment forecast IL · Partial reset (capped growth)
- Current annual tax
- $1,245 · $104/mo
- Projected year-2 tax
- $1,245 · $104/mo
- Expected delta
- $0/yr ($0/mo · 0.0%)
ⓘ Screening estimate from a state-policy table — verify with the county assessor before closing.
Climate risk First Street
- Flood 1/10 Low FEMA zone X (unshaded) · 0% chance over 30 yrs
- Wildfire 1/10 Low
- Heat 4/10 Moderate 7 d/yr ≥106°F today · 19 d/yr by 30 yrs out
- Wind 2/10 Low 2% chance of damaging wind over 30 yrs
- Air quality 2/10 Low 1 unhealthy d/yr today · 1 by 30 yrs out
Nearby sold comps map
Loading sold comps map…
Walkable amenities ~0.75 mi
Loading nearby amenities…
Taxation est. · year 1
- Rental income
- $14,678
- − Mortgage interest
- −$2,521
- − Property taxes
- −$1,245
- − Insurance
- −$225
- − Repairs & maintenance
- −$1,174
- − Management
- −$1,174
- − Depreciation
- −$1,309
- Taxable income
- $7,030
- Est. tax owed @ 24.0%
- −$1,687
- After-tax cash flow
- $5,607/yr
For passive investors: Depreciation is non-cash, so a rental often shows a tax loss while cash-flowing — sheltering income. Rental losses are passive: they offset passive income freely, and up to $25,000/yr can offset ordinary (W-2) income if you actively participate and your MAGI is under $100k (phasing out to $0 by $150k); unused losses carry forward. On sale, claimed depreciation is recaptured at up to 25%, and gains may owe capital-gains tax (a 1031 exchange can defer both). Figures are a year-1 estimate at your 24.0% rate — not tax advice; consult a CPA.
Schools (NCES district)
- District
- Decatur SD 61
- NCES district ID
- 1711850
- Math proficiency
- 3% ▼ -4.00%
- Reading proficiency
- 6% ▼ -6.00%
- Median HH income
- $38,864
- Composite
- 3.99/100
- National rank
- #10059
- State rank
- #605 of 620 in IL
Livability — Decatur
- Score
- 59/100
- State rank
- #1076
- US rank
- #20533
Category grades
Schools grade is shown separately in the Schools card above.
Census & demographics
- Census place
- Decatur, IL
- County
- Macon County · 78,333 people
- City population
- 78,333
- Metro
- Decatur, IL
- Population (ZIP)
- 32,665
- Household income
- $66,337
- Rent vs Own
- Severe rent burden
- 640.0
Population outlook (Macon County) Hauer SSP2
- Today (2025)
- 99,568 people
- By 2030
- 94,973 · -4.6%
- By 2040
- 85,250 · -14.4%
- By 2050
- 75,920 · -23.8%
- By 2075
- 55,962 · -43.8%
- By 2100
- 36,468 · -63.4%
Race, ethnicity, and origin ACS 2023
- Neighborhood character
- Predominantly White (75%)
- Race & ethnicity
- White 75% Black 17% Two or more races 5% Hispanic / Latino 3%
- Common ancestry
- Slovak 3% Romanian 2% Lithuanian 2%
- Foreign-born
- 3% · Canada
- Languages at home
- 96% English-only · Spanish 2% Russian/Polish/Slavic 1% Other Indo-European 0%
Political lean MEDSL · Macon
- 2024 margin
- R (+18.9) · D 39.8% · R 58.7% · Other 1.4%
- 2008→2024 swing
- -20.0pp toward R · 2008: 1.1pp · 2024: -18.9pp
- All cycles
- 2024: R+18.9 2020: R+17.7 2016: R+18.1 2012: R+5.2 2008: D+1.1
Not yet ingested
- Civics
- —
Market trends
- HPI YoY
- ▼ -17.96%
- Current HPI
- 180.9274
- Rent YoY
- —
- Metro
- Decatur, IL
- State GDP YoY
- ▲ 1.59%
- F500 in state
- 60
Industry mix (Fortune 500 HQ in IL)
| Industry | F500 HQs | Revenue |
|---|---|---|
| Insurance | 4 | $201B |
|
||
| Consumer Goods | 4 | $87B |
|
||
| Industrial Machinery | 3 | $64B |
|
||
| Healthcare | 2 | $55B |
|
||
| Retail / Pharmacy | 1 | $148B |
|
||
| Agriculture / Food | 1 | $86B |
|
||
Price history
-98.4% since first listed7 events — show timeline
- 2026-05-26 Pending — RMLSA as Distributed by MLS Grid
- 2026-05-17 Rental Removed $1,300 TURBOTENANT
- 2026-05-15 Listed for Rent $1,300 TURBOTENANT
- 2026-05-02 Listed $45,000 RMLSA as Distributed by MLS Grid
- 2010-06-03 Sold (Public Records) $80,000 Public Records
- 2010-05-26 Sold (MLS) $80,000 MRED as Distributed by MLS Grid
- 2010-03-01 Listed $83,000 MRED as Distributed by MLS Grid
Property tax history
+1.4%/yrLatest (2024): $1,245 · +2.6% YoY. Source: county tax records.
Cash-flow waterfall
monthlySold comps — $/sqft
last 12 mo · ≤1 miLoading sold comps…