 Duplex
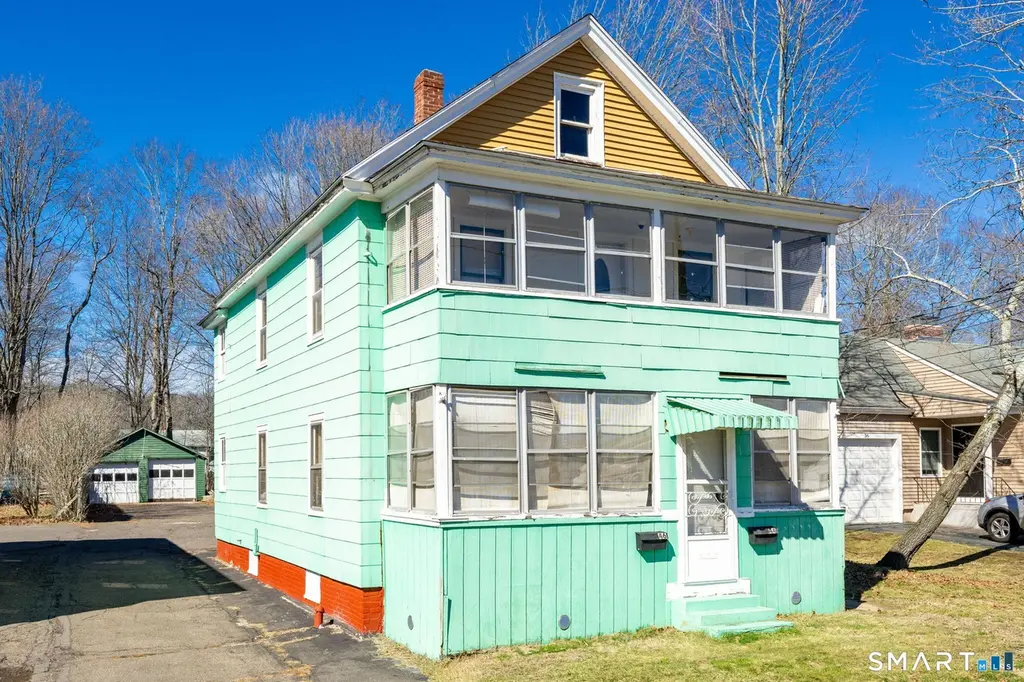
44 Curtiss Ave · Bristol, CT
Flood risk 1/10 · Minimal
- FEMA flood zone
- X (unshaded)
- Chance of flooding over 30 yrs
- 0.0%
- Est. flood insurance / yr
- $473 – $860
Fire risk 1/10 · Minimal
- Est. fire insurance / yr
- $829 – $1,539
Heat risk 5/10 · Moderate
- Hot days now (above 98°F)
- 7 days/yr
- Hot days in 30 yrs
- 15 days/yr
Wind risk 6/10 · Moderate
- Chance of severe wind over 30 yrs
- 27.0%
Air-quality risk 3/10 · Minor
- Unhealthy air days now
- 2 days/yr
- Unhealthy air days in 30 yrs
- 3 days/yr
Risk factors via First Street. Map © Google.
Why this score? — see what drove the C grade
The composite is a weighted blend of 9 inputs, each scored 0–100. Each bar is that input's sub-score; the figure is the points it added to the 100-point composite (weight × sub-score).
- Cash flow +24.2/30.0
- DSCR +7.8/10.0
- 1% rule +6.3/10.0
- ARV discount +5.0/15.0
- Livability +4.0/5.0
- Rent growth +3.9/5.0
- Schools +3.2/10.0
- Condition / age +2.5/5.0
- Appreciation +0.0/10.0
$269,000
🖨 Deal sheet 📄 Offer letter ✓ Due diligence
Multi-family units
County records classify this as Multi-Family (2-4 Unit). Listing-text estimate: 2 units. confirmed
Listing remarks
Attention investors and rehab buyers! Opportunity awaits at 44 Curtiss Ave in Bristol - a 2-family property located in a desirable neighborhood, ready for your vision and in need of significant improvement. This multi-family offers a functional layout with identical floor plans in both units, each featuring 4 rooms, 2 bedrooms, and 1 full bath. The owner occupied first-floor unit currently has no heat source. Laundry is located in the kitchen (washer) with the dryer on the back porch. The second-floor unit is tenant occupied (dog on premises) and features natural gas heat and hot water. Property includes two electrical panels, both with fuse boxes. Additional highlights include a detached 2
Key facts
- 8,712 sq ft lot
- Built 1915
- Listed 40 days
Neighborhood map
What this means for you Summary
Snapshot
- This is a 2 × 2-bed/1.0-bath units multifamily listed at $269k.
Deal economics
- At list price, monthly cash flow is $534 ($6k/yr) — positive. Per door: $267/mo.
- The deal already cash-flows at list — no discount required.
- Meets the 1% rule at list price ($3k rent vs $269k).
- Recommended offer: $261k (3.0% below list) — sets the bar for market timing.
- Cap rate 8.7% vs local median 3.3% in Bristol — top-decile yield for the area; either an underpriced asset or a hidden risk that comps aren't pricing in. Stress-test before assuming the spread holds.
Location & tenants
- Location reads 81/100 on livability (#21 in CT, #1,585 nationally) — a professional / high-income tenant draw. Strengths: crime A+, housing A+, health & safety A+; Watch: commute F.
- Bristol School District (suburban): math 28% / reading 44% proficiency, ranked #109 of 153 in CT (top 71%) — families likely to look elsewhere, expect single-tenant / working-renter base with shorter leases.
- Zoned schools: Ellen P. Hubbell School (math 42% / reading 52%, grade D-, #256 of 553 statewide, top 48%, 352 students, 70% FRL); Bristol Eastern High School (math 23% / reading 51%, grade F, #112 of 194 statewide, top 60%, 1,113 students, 46% FRL) — zoned schools average 58% FRL vs 37% district-wide (21 pts higher); higher-poverty schools than district average — tighter screening recommended.
- Market conditions: Rents rising fast (+5.4%/yr); 220 active listings in the ZIP; 3 comparable units currently listed for rent nearby; rentals at typical pace (median 20d on market — plan ~3-4 weeks tenant-placement turnaround); solid renter incomes; 502 units permitted in Naugatuck Valley Planning Region in 2024 (171 in 5+ unit buildings).
- At $3,045/mo this rent would consume 46% of the median local household income ($79k/yr) (locally 2172% of renters already pay >50% of income on rent) — very limited rent-growth headroom before tenants either downsize or default.
Forward outlook
- Local home prices are declining (-3.0%/yr); year-one equity from $2k of loan paydown is wiped out by about $8k of value loss. Plan a longer hold.
- At projected returns (-3.0% appreciation + 5.4% rent growth), your $75k cash investment doubles in ~10 years — after that, you're playing with house money.
Negotiation context
- It's been on market 40 days — a 3% lower offer ($261k) is reasonable based on typical stale-listing flexibility.
- Current owner paid $90k; list at $269k implies a 199% gain — meaningful room to come down on a strong offer.
Risks & watch-outs
- Watch-outs: built in 1915 — expect roof / HVAC / electrical / plumbing capex.
- Climate carrying-cost: major wind risk, 27% chance of damaging wind over 30y; extreme-heat days projected 7→15/yr by 2055 (HVAC capex compounding) — expect insurance premiums to compound above CPI over the hold.
Questions for the listing agent
- It's been on market 40 days. Have you received any prior offers? Is the seller open to a 3% concession, seller financing, or rate buy-down credit?
- Can we see the unit-by-unit rent roll, current vacancy, and any below-market leases? What's the average tenancy length?
- What capital expenditures (roof, boiler, parking lot, exteriors) have been made in the last 5 years, and what's planned in the next 2?
- Built in 1915 — when were the roof, HVAC, electrical panel, plumbing, and water heater last replaced?
- Is there a deadline driving the sale (1031 exchange, divorce, estate, relocation)? That informs how much negotiation room exists.
- What's the average days-on-market for RENTAL listings here right now (not sales)? A rising rental-DOM trend means longer vacancies and softer asking-rent achievability than the comps imply.
- What's the recent tenant-quality profile in this submarket — average credit score on applications, eviction rate, late-payment / NSF rate, and stable-employment percentage? A property-management company in the area should have these aggregated.
- How much new apartment / multifamily construction is in the pipeline within 1–3 miles? Heavy new supply (>2% of stock underway) typically softens rents 12–24 months out; light construction supports rent growth.
Investment metrics
- 1% rule
- 1.13% ✓
- Cap rate
- 8.68%
- Cash-on-cash
- 8.51%
- DSCR
- 1.38
- GRM
- 7.4
CMA / ARV
- ARV (on-the-fly)
- $255,024
- Comps found
- 6
Show comp detail 6 sales within ~0.75 mi
| Address | Dist | Beds/Ba | Sqft | Sold | Price | $/sf | Match |
|---|---|---|---|---|---|---|---|
| 44 Curtiss Ave | 0.00mi | 4/2.0 | 1,288 (0%) | 0mo | $255,500 | $198 | 100 |
| 23 Evergreen St | 0.49mi | 4/2.0 | 1,344 (+4%) | 9mo | $240,000 | $179 | 62 |
| 170-172 Frederick St | 0.27mi | 4/2.0 | 1,232 (-4%) | 23mo | $250,000 | $203 | 61 |
| 176-178 Frederick St | 0.27mi | 3/2.0 (-1) | 1,248 (-3%) | 21mo | $252,500 | $202 | 60 |
| 476 Broad St | 0.52mi | 3/2.0 (-1) | 1,400 (+9%) | 7mo | $218,000 | $156 | 51 |
| 162 E Main St | 0.75mi | 4/2.0 | 1,333 (+4%) | 18mo | $144,000 | $108 | 44 |
Match score weights: distance 35% · size 25% · config 20% · recency 20%. Top-matched comps best support the ARV.
Projected returns pro-forma
-3.0% appreciation · 5.41% rent growth · sell at horizon
- IRR
- -0.7%
- Equity multiple
- 0.97×
- Total profit
- $-1,945
- Equity at exit
- $40,109
- IRR
- 11.4%
- Equity multiple
- 1.99×
- Total profit
- $74,941
- Equity at exit
- $23,258
Cash invested: $75,320 (down + closing). Projections, not guarantees.
Landlord ↔ Tenant lean methodology
- Overall (STATE)
- 27 Tenant-Leaning
- State Connecticut
- 27 Tenant-Leaning · D+7
- County
- — inherits STATE
- City
- — inherits STATE
ZIP-level market 06010
- Rents YoY
- 5.4%
- Active inventory
- 220
- Price-to-rent
- 14.7×
Monthly cashflow live
- Estimated rent
- $3,045 high interval (Pro) →
- Mortgage (P&I)
- −$1,411
- Tax from tax record
- −$348 /mo · $4,182/yr
- Insurance
- −$112
- HOA
- −$0
- Vacancy / Maint / Mgmt
- −$639
- Net cashflow
- $534
Break-even live
2-unit breakdown (identical units grouped — click to expand)
| Units | Beds | Baths | Est. rent |
|---|---|---|---|
| 2× units | 2 | 1 | $3,046 |
| #1 | 2 | 1 | $1,523 |
| #2 | 2 | 1 | $1,523 |
| Total (2 units) | $3,045 | ||
UW: 25.0% down · 7.5% · 30yr · 1.5% tax · 5.0% vac · 8.0% maint · 8.0% mgmt
Financing live
Cash to close
- Down payment
- $67,250
- Closing costs
- $8,070
- Reserves months
- —
- Total cash needed
- —
Loan-product check · same deal, 3 products live
Conventional
25% down · 7.5% · 30yr
- Down + closing
- —
- Monthly P&I
- —
- Monthly cashflow
- —
- DSCR
- —
- Eligible?
- —
Personal DTI + credit; lowest rate.
DSCR
20% down · 8.5% · 30yr
- Down + closing
- —
- Monthly P&I
- —
- Monthly cashflow
- —
- DSCR
- —
- Eligible?
- —
No personal income docs; deal must DSCR.
Hard money
10% down · 12.0% · 12mo
- Down + closing
- —
- Monthly P&I
- —
- Monthly cashflow
- —
- DSCR
- —
- Eligible?
- —
Short-term bridge; refi at stabilization.
Rent comps 3 comps
| Address | Beds | Baths | Sqft | Rent | $/sqft | DOM | Units | Dist |
|---|---|---|---|---|---|---|---|---|
| 380 King St #5 Bristol, CT | 3.0 | 2.5 | 1440 | $2,750 | $1.91 | 20d | 1 | 0.81mi |
| 513 Emmett St Unit B11 Bristol, CT | 3.0 | 1.0 | 936 | $2,000 | $2.14 | 20d | 1 | 1.01mi |
| 513 Emmett St Bristol, CT | 3.0 | 1.0 | 936 | $2,000 | $2.14 | 1d | 1 | 1.01mi |
Listing history 5 events
-
2026-04-28status Under Contract
-
2026-03-27historical Under Contract - Continue to Show
-
2026-03-20$269,000 Active
-
2026-03-18historical $269,000
-
1993-07-22soldstatus $90,000
ⓘ Source: listings_history table (triggers on properties + properties_extension) + one-shot
backfill from property_details.listing_events for pre-trigger history.
Tax reassessment forecast CT · Partial reset (capped growth)
- Current annual tax
- $4,182 · $348/mo
- Projected year-2 tax
- $4,969 · $414/mo
- Expected delta
- +$787/yr (+$66/mo · 18.8%)
ⓘ Screening estimate from a state-policy table — verify with the county assessor before closing.
Climate risk First Street
- Flood 1/10 Low FEMA zone X (unshaded) · 0% chance over 30 yrs
- Wildfire 1/10 Low
- Heat 5/10 Major 7 d/yr ≥98°F today · 15 d/yr by 30 yrs out
- Wind 6/10 Major 27% chance of damaging wind over 30 yrs
- Air quality 3/10 Moderate 2 unhealthy d/yr today · 3 by 30 yrs out
Nearby sold comps map
Loading sold comps map…
Walkable amenities ~0.75 mi
Loading nearby amenities…
Taxation est. · year 1
- Rental income
- $36,540
- − Mortgage interest
- −$15,068
- − Property taxes
- −$4,182
- − Insurance
- −$1,345
- − Repairs & maintenance
- −$2,923
- − Management
- −$2,923
- − Depreciation
- −$7,825
- Taxable income
- $2,273
- Est. tax owed @ 24.0%
- −$546
- After-tax cash flow
- $5,866/yr
For passive investors: Depreciation is non-cash, so a rental often shows a tax loss while cash-flowing — sheltering income. Rental losses are passive: they offset passive income freely, and up to $25,000/yr can offset ordinary (W-2) income if you actively participate and your MAGI is under $100k (phasing out to $0 by $150k); unused losses carry forward. On sale, claimed depreciation is recaptured at up to 25%, and gains may owe capital-gains tax (a 1031 exchange can defer both). Figures are a year-1 estimate at your 24.0% rate — not tax advice; consult a CPA.
Schools (NCES district)
- District
- Bristol School District
- NCES district ID
- 0900510
- Math proficiency
- 28% ▼ -10.00%
- Reading proficiency
- 44% ▼ -5.00%
- Median HH income
- $59,953
- Composite
- 32.07/100
- National rank
- #5814
- State rank
- #109 of 153 in CT
Livability — Bristol
- Score
- 81/100
- State rank
- #21
- US rank
- #1585
Category grades
Schools grade is shown separately in the Schools card above.
Census & demographics
- Census place
- Bristol, CT
- County
- Hartford County · 754,208 people
- City population
- 61,684
- Metro
- Hartford-East Hartford-Middletown, CT
- Population (ZIP)
- 61,684
- Household income
- $79,314
- Rent vs Own
- Severe rent burden
- 2172.0
Population outlook (Naugatuck Valley County) Hauer SSP2
- By 2040
- 496,846
Race, ethnicity, and origin ACS 2023
- Neighborhood character
- Majority White (65%)
- Race & ethnicity
- White 65% Hispanic / Latino 19% Two or more races 13% Black 7% Asian 5%
- Hispanic origin (detail)
- Mexican 2% Puerto Rican 13%
- Common ancestry
- Lithuanian 11% Romanian 10% Slovak 1%
- Foreign-born
- 10% · Canada
- Languages at home
- 79% English-only · Spanish 11% Other Indo-European 3% Russian/Polish/Slavic 2%
Political lean MEDSL · Naugatuck Valley
- 2024 margin
- Lean R (+7.4) · D 45.6% · R 53.0% · Other 1.4%
- All cycles
- 2024: R+7.4
Not yet ingested
- Civics
- —
Market trends
- HPI YoY
- ▼ -293.55%
- Current HPI
- 255.5419
- Rent YoY
- ▲ 5.41%
- Metro
- Hartford-East Hartford-Middletown, CT
- State GDP YoY
- ▲ 1.06%
- F500 in state
- 38
Industry mix (Fortune 500 HQ in CT)
| Industry | F500 HQs | Revenue |
|---|---|---|
| Industrial Machinery | 4 | $38B |
|
||
| Insurance | 3 | $71B |
|
||
| Financial Services | 2 | $25B |
|
||
| Transportation / Logistics | 2 | $18B |
|
||
| Healthcare | 1 | $247B |
|
||
| Telecommunications | 1 | $55B |
|
||
Price history
+198.9% since first listed5 events — show timeline
- 2026-04-28 Pending — Smart MLS
- 2026-03-27 Contingent — Smart MLS
- 2026-03-20 Listed $269,000 Smart MLS
- 2026-03-18 Coming Soon $269,000 Smart MLS
- 1993-07-22 Sold (Public Records) $90,000 Public Records
Property tax history
+2.4%/yrLatest (2025): $4,182 · +6.0% YoY. Source: county tax records.
Cash-flow waterfall
monthlySold comps — $/sqft
last 12 mo · ≤1 miLoading sold comps…