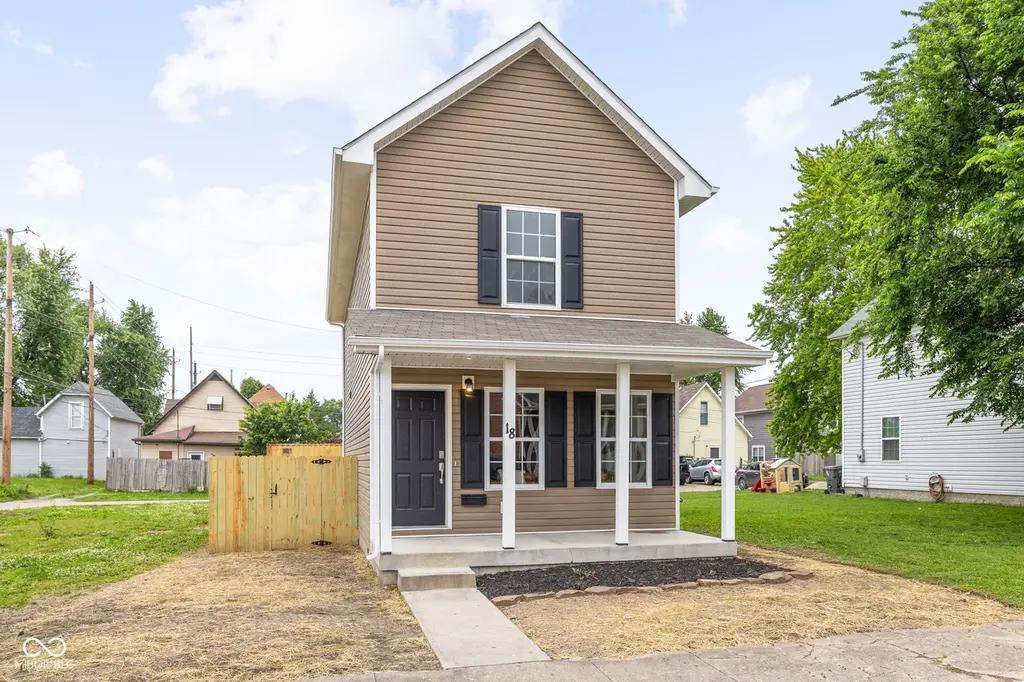
18 E Caven St · Indianapolis city (balance), IN
Flood risk 1/10 · Minimal
- FEMA flood zone
- X (unshaded)
- Chance of flooding over 30 yrs
- 0.0%
- Est. flood insurance / yr
- $507 – $1,088
Fire risk 1/10 · Minimal
- Est. fire insurance / yr
- $717 – $1,331
Heat risk 4/10 · Minor
- Hot days now (above 101°F)
- 7 days/yr
- Hot days in 30 yrs
- 19 days/yr
Wind risk 2/10 · Minimal
- Chance of severe wind over 30 yrs
- 1.0%
Air-quality risk 3/10 · Minor
- Unhealthy air days now
- 2 days/yr
- Unhealthy air days in 30 yrs
- 3 days/yr
Risk factors via First Street. Map © Google.
Why this score? — see what drove the D+ grade
The composite is a weighted blend of 9 inputs, each scored 0–100. Each bar is that input's sub-score; the figure is the points it added to the 100-point composite (weight × sub-score).
- Cash flow +13.8/30.0
- ARV discount +13.6/15.0
- Rent growth +5.0/5.0
- DSCR +4.2/10.0
- 1% rule +3.4/10.0
- Livability +2.5/5.0
- Condition / age +2.5/5.0
- Schools +1.4/10.0
- Appreciation +0.0/10.0
$195,000
🖨 Deal sheet (PDF) 📄 Offer letter ✓ Due diligence
Listing remarks MLS
BANK OWNED HOME, GOOD INVESTMENT AREA, NEEDS REPAIRS, DON'T MISS THIS DEAL, ALL OFFERS MUST BE SUBMITTED WITH PROOF OF FUNDS, CALL AGENT FOR DETAILS SUFFERED FIRE DAMAGE, MAKE OFFER!!!!!!!!!!!!!11
Key facts
- 3,006 sq ft lot
- Built 2018
- Listed 6 days
Tags
Property features AI
Exterior
- Parking: On-street parking
- Utilities: Public water; Municipal sewer; Solid waste service
- Home design: Single-family residence; Two levels; Residential property
- Construction: Vinyl siding; Cellar foundation
- Exterior features: Full privacy fence
Interior
- Kitchen: Dishwasher; Microwave; Electric oven; Refrigerator; Garbage disposal; Electric water heater
- Bedrooms: Three bedrooms on the upper level
- Bathrooms: One full bathroom (upper level); One half bathroom (main level)
- Heating & cooling: Electric forced-air heating; Central air conditioning
- Interior features: Kitchen island; Formal living room
- Laundry & utility: Laundry closet
Neighborhood map
What this means for you Summary
Snapshot
- This is a 3-bed/1.5-bath single-family listed at $195k.
Deal economics
- At list price, monthly cash flow is $16 ($194/yr) — positive.
- The deal already cash-flows at list — no discount required.
- To meet the 1% rule (rent ≥ 1% of price), the offer needs to be $164k (15.8% below list).
- Recommended offer: $164k (15.8% below list) — sets the bar for 1% rule.
- Cap rate 6.4% vs local median 4.4% in Indianapolis city (balance) — top-decile yield for the area; either an underpriced asset or a hidden risk that comps aren't pricing in. Stress-test before assuming the spread holds.
Location & tenants
- Location reads: area grade D — affects rentability + tenant quality, not the cash-flow math above.
- Indianapolis Public Schools (urban): math 14% / reading 20% proficiency, ranked #286 of 301 in IN (top 95%) — low school quality limits family demand, transient renter base, plan for 1-2y turnover; 77% free/reduced lunch — lower-income household profile, screen leases tightly.
- Zoned schools: Frederick Douglass School 19 (math 9% / reading 13%, grade F, #909 of 994 statewide, top 92%, 444 students, 81% FRL); H L Harshman Middle School (math 3% / reading 16%, grade F, #316 of 330 statewide, top 96%, 549 students, 84% FRL).
- Market conditions: Rents rising fast (+11.0%/yr); 131 active listings in the ZIP; 40 comparable units currently listed for rent nearby; rentals at typical pace (median 26d on market — plan ~3-4 weeks tenant-placement turnaround); 1,906 units permitted in Marion County in 2024 (621 in 5+ unit buildings).
- This rent runs 36% of the median local income ($55k/yr) — at the standard rent-burdened threshold; future hikes will face affordability resistance.
Forward outlook
- Local home prices are declining (-3.0%/yr); year-one equity from $1k of loan paydown is wiped out by about $6k of value loss. Plan a longer hold.
- Marion County population projected at +18% by 2050 — long-run rental-demand tailwind backs the buy-and-hold thesis.
Negotiation context
- Only 6 days on market — expect competitive offers; lowballing is unlikely to land.
- 2 sale attempts since 24y ago with the ask held roughly flat each time — persistent listings suggest the price (not the market) is what's stuck; bring a comps-based counter.
Questions for the listing agent
- Is there a deadline driving the sale (1031 exchange, divorce, estate, relocation)? That informs how much negotiation room exists.
- The area grade is low — what's the realistic commute time and amenity access for the typical tenant pool here? Any planned neighborhood developments (good or bad) we should know about?
- What's the average days-on-market for RENTAL listings here right now (not sales)? A rising rental-DOM trend means longer vacancies and softer asking-rent achievability than the comps imply.
- What's the recent tenant-quality profile in this submarket — average credit score on applications, eviction rate, late-payment / NSF rate, and stable-employment percentage? A property-management company in the area should have these aggregated.
- How much new for-sale + rental construction is in the pipeline within 1–3 miles? Heavy new supply typically softens prices + rents 12–24 months out; constrained supply supports both.
Investment metrics
- 1% rule
- 0.84% ✗
- Cap rate
- 6.39%
- Cash-on-cash
- 0.35%
- DSCR
- 1.02
- GRM
- 9.9
CMA / ARV
- ARV (on-the-fly)
- $225,792
- Comps found
- 12
Show comp detail 12 sales within ~0.75 mi
| Address | Dist | Beds/Ba | Sqft | Sold | Price | $/sf | Match |
|---|---|---|---|---|---|---|---|
| 35 Iowa St | 0.04mi | 3/2.5 | 1,400 (+4%) | 2mo | $239,000 | $171 | 86 |
| 337 E Minnesota St | 0.40mi | 3/2.0 | 1,371 (+2%) | 8mo | $265,000 | $193 | 70 |
| 225 E Minnesota St | 0.28mi | 2/1.0 (-1) | 1,270 (-6%) | 1mo | $185,000 | $146 | 69 |
| 255 Iowa St | 0.32mi | 3/1.0 | 1,452 (+8%) | 6mo | $105,000 | $72 | 65 |
| 1250 Union St | 0.51mi | 3/1.5 | 1,440 (+7%) | 1mo | $200,000 | $139 | 63 |
| 2117 S Pennsylvania St | 0.33mi | 2/1.0 (-1) | 1,229 (-9%) | 4mo | $87,500 | $71 | 60 |
| 14 E Regent St | 0.33mi | 3/2.5 | 1,496 (+11%) | 2mo | $270,000 | $180 | 60 |
| 2142 Webb St | 0.44mi | 3/2.0 | 1,496 (+11%) | 3mo | $128,000 | $86 | 56 |
| 1869 New St | 0.74mi | 3/2.0 | 1,280 (-5%) | 1mo | $337,000 | $263 | 55 |
| 413 E Caven St | 0.43mi | 2/2.0 (-1) | 1,192 (-11%) | 1mo | $200,000 | $168 | 54 |
| 711 Terrace Ave | 0.70mi | 3/2.0 | 1,475 (+10%) | 1mo | $323,500 | $219 | 48 |
| 728 E Beecher St | 0.66mi | 3/2.0 | 1,154 (-14%) | 7mo | $187,500 | $162 | 37 |
Match score weights: distance 35% · size 25% · config 20% · recency 20%. Top-matched comps best support the ARV.
Projected returns pro-forma
-3.0% appreciation · 8.0% rent growth · sell at horizon
- IRR
- -10.5%
- Equity multiple
- 0.60×
- Total profit
- $-21,910
- Equity at exit
- $29,075
- IRR
- 4.5%
- Equity multiple
- 1.40×
- Total profit
- $21,672
- Equity at exit
- $16,860
Cash invested: $54,600 (down + closing). Projections, not guarantees.
Landlord ↔ Tenant lean methodology
- Overall (STATE)
- 90 Strongly Landlord-Friendly
- State Indiana
- 90 Strongly Landlord-Friendly · R+11
- County
- — inherits STATE
- City
- — inherits STATE
ZIP-level market 46225
- Home prices YoY
- -8.2%
- Rents YoY
- 11.0%
- Active inventory
- 131
- Price-to-rent
- 9.9×
Monthly cashflow live
- Estimated rent
- $1,642 high interval (Pro) →
- Mortgage (P&I)
- −$1,023
- Tax from tax record
- −$177 /mo · $2,125/yr
- Insurance
- −$81
- HOA
- −$0
- Vacancy / Maint / Mgmt
- −$345
- Net cashflow
- $16
Break-even live
Sensitivity live
| Price | -10% $127 | -5% $71 | +0% $16 | +5% $-39 | +10% $-94 |
|---|---|---|---|---|---|
| Rent | -10% $-114 | -5% $-49 | +0% $16 | +5% $81 | +10% $146 |
| Rate | -1.0pp $114 | -0.5pp $66 | base $16 | +0.5pp $-34 | +1.0pp $-86 |
UW: 25.0% down · 7.5% · 30yr · 1.5% tax · 5.0% vac · 8.0% maint · 8.0% mgmt
Financing live
Cash to close
- Down payment
- $48,750
- Closing costs
- $5,850
- Reserves months
- —
- Total cash needed
- —
Loan-product check · same deal, 3 products live
Conventional
25% down · 7.5% · 30yr
- Down + closing
- —
- Monthly P&I
- —
- Monthly cashflow
- —
- DSCR
- —
- Eligible?
- —
Personal DTI + credit; lowest rate.
DSCR
20% down · 8.5% · 30yr
- Down + closing
- —
- Monthly P&I
- —
- Monthly cashflow
- —
- DSCR
- —
- Eligible?
- —
No personal income docs; deal must DSCR.
Hard money
10% down · 12.0% · 12mo
- Down + closing
- —
- Monthly P&I
- —
- Monthly cashflow
- —
- DSCR
- —
- Eligible?
- —
Short-term bridge; refi at stabilization.
Rent comps 40 comps
| Address | Beds | Baths | Sqft | Rent | $/sqft | DOM | Units | Dist |
|---|---|---|---|---|---|---|---|---|
| 11 Iowa St Indianapolis, IN | 2.0 | 1.0 | 1176 | $1,595 | $1.36 | 0d | 1 | 0.05mi |
| 1819 Union St Unit 1817 Indianapolis, IN | 3.0 | 2.0 | 1020 | $1,199 | $1.18 | 45d | 1 | 0.06mi |
| 1756 S Delaware St Unit 1754 Indianapolis, IN | 3.0 | 2.0 | 1014 | $1,300 | $1.28 | 16d | 1 | 0.14mi |
| 1756 Delaware St Indianapolis, IN | 3.0 | 2.0 | 1014 | $1,300 | $1.28 | 45d | 1 | 0.14mi |
| 1713 S Delaware St Indianapolis, IN | 2.0 | 2.0 | 1785 | $1,700 | $0.95 | 45d | 1 | 0.18mi |
| 224 Iowa St Indianapolis, IN | 3.0 | 1.0 | 1254 | $1,450 | $1.16 | 25d | 1 | 0.26mi |
| 243 Terrace Ave Indianapolis, IN | 4.0 | 2.0 | 1669 | $2,700 | $1.62 | 19d | 1 | 0.45mi |
| 438 E Beecher St Indianapolis, IN | 3.0 | 2.5 | 1500 | $1,450 | $0.97 | 25d | 1 | 0.45mi |
| 1409 S Alabama St Indianapolis, IN | 2.0 | 1.0 | 949 | $1,245 | $1.31 | 45d | 1 | 0.46mi |
| 1407 S Alabama St Indianapolis, IN | 2.0 | 1.0 | 949 | $1,150 | $1.21 | 45d | 1 | 0.47mi |
| 1436 S New Jersey St Unit A Indianapolis, IN | 3.0 | 2.5 | 1300 | $2,100 | $1.62 | 25d | 1 | 0.47mi |
| 512 E Minnesota St Unit 203 Indianapolis, IN | 2.0 | 1.0 | 903 | $1,195 | $1.32 | 25d | 1 | 0.50mi |
| 1439 South East St Indianapolis, IN | 2.0 | 2.0 | 1114 | $1,425 | $1.28 | 22d | 1 | 0.54mi |
| 1439 South East St Indianapolis, IN | 2.0 | 2.0 | 1114 | $1,425 | $1.28 | 0d | 1 | 0.54mi |
| 1437 S East St Indianapolis, IN | 2.0 | 2.0 | 1114 | $1,425 | $1.28 | 45d | 1 | 0.55mi |
| 2283 Union St Indianapolis, IN | 3.0 | 2.0 | 1824 | $1,820 | $1.00 | 25d | 1 | 0.56mi |
| 620 E Beecher St Indianapolis, IN | 3.0 | 2.0 | 1072 | $1,639 | $1.53 | 22d | 1 | 0.56mi |
| 1830 Orleans St Indianapolis, IN | 3.0 | 2.5 | 1586 | $1,995 | $1.26 | 45d | 1 | 0.57mi |
| 2314 Union St Indianapolis, IN | 3.0 | 2.0 | 892 | $1,295 | $1.45 | 45d | 1 | 0.59mi |
| 1833 Orleans St Unit 1 Indianapolis, IN | 3.0 | 1.0 | 1260 | $1,350 | $1.07 | 45d | 1 | 0.60mi |
| 1206 S Talbott St Indianapolis, IN | 2.0 | 1.5 | 1200 | $975 | $0.81 | 0d | 1 | 0.60mi |
| 2109 Singleton St Indianapolis, IN | 3.0 | 2.0 | 1340 | $2,100 | $1.57 | 9d | 1 | 0.60mi |
| 406 Orange St Indianapolis, IN | 3.0 | 2.5 | 1820 | $2,250 | $1.24 | 45d | 1 | 0.61mi |
| 614 Parkway Ave Indianapolis, IN | 3.0 | 2.0 | 1360 | $1,850 | $1.36 | 0d | 1 | 0.68mi |
| 728 Cottage Ave Indianapolis, IN | 3.0 | 2.5 | 1831 | $2,550 | $1.39 | 25d | 1 | 0.69mi |
| 752 Cottage Ave Indianapolis, IN | 3.0 | 2.0 | 1548 | $1,750 | $1.13 | 16d | 1 | 0.73mi |
| 726 Parkway Ave Indianapolis, IN | 3.0 | 2.0 | 1150 | $2,195 | $1.91 | 19d | 1 | 0.74mi |
| 835 Weghorst St Unit 837 Indianapolis, IN | 3.0 | 1.5 | 1500 | $1,399 | $0.93 | 25d | 1 | 0.75mi |
| 704 Sanders St Indianapolis, IN | 2.0 | 1.0 | 1290 | $1,275 | $0.99 | 25d | 1 | 0.77mi |
| 944 E Minnesota St Indianapolis, IN | 2.0 | 2.0 | 944 | $1,299 | $1.38 | 45d | 1 | 0.81mi |
| 518 Prospect St Unit 1357365P Indianapolis, IN | 3.0 | 2.0 | 1614 | $2,594 | $1.61 | 9d | 1 | 0.81mi |
| 518 Prospect St Unit 1353834P Indianapolis, IN | 3.0 | 2.0 | 1603 | $2,442 | $1.52 | 16d | 1 | 0.81mi |
| 1247 Wright St Indianapolis, IN | 3.0 | 1.5 | 1809 | $1,750 | $0.97 | 45d | 1 | 0.83mi |
| 1247 Wright St Indianapolis, IN | 3.0 | 1.5 | 1247 | $1,750 | $1.40 | 19d | 1 | 0.83mi |
| 915 S Meridian St Indianapolis, IN | 2.0 | 1.0–2.0 | 829 | $2,551 | $3.08 | 0d | 42 | 0.84mi |
| 736 E Morris St Indianapolis, IN | 2.0 | 1.5 | 1500 | $1,195 | $0.80 | 0d | 1 | 0.86mi |
| 736 E Morris St Indianapolis, IN | 2.0 | 1.5 | 1500 | $1,195 | $0.80 | 6d | 1 | 0.86mi |
| 1703 Ringgold Ave Indianapolis, IN | 3.0 | 2.0 | 1712 | $1,700 | $0.99 | 0d | 1 | 0.86mi |
| 1514 Ringgold Ave Indianapolis, IN | 3.0 | 1.0 | 1064 | $1,295 | $1.22 | 45d | 1 | 0.87mi |
| 1861 Barth Ave Unit 1861 Indianapolis, IN | 2.0 | 1.0 | 1300 | $1,600 | $1.23 | 25d | 1 | 0.92mi |
Listing history 6 events
-
2026-06-02status $195,000 Pending 6 DOM
-
2026-06-01days on market $195,000 Active 6 DOM
-
2026-05-31days on market $195,000 Active 5 DOM
-
2026-05-26$195,000 Active
-
2002-02-27soldstatus 197-char remark
Show marketing remark (197 chars)
BANK OWNED HOME, GOOD INVESTMENT AREA, NEEDS REPAIRS, DON'T MISS THIS DEAL, ALL OFFERS MUST BE SUBMITTED WITH PROOF OF FUNDS, CALL AGENT FOR DETAILS SUFFERED FIRE DAMAGE, MAKE OFFER!!!!!!!!!!!!!11
-
2002-01-18$14,900 197-char remark
Show marketing remark (197 chars)
BANK OWNED HOME, GOOD INVESTMENT AREA, NEEDS REPAIRS, DON'T MISS THIS DEAL, ALL OFFERS MUST BE SUBMITTED WITH PROOF OF FUNDS, CALL AGENT FOR DETAILS SUFFERED FIRE DAMAGE, MAKE OFFER!!!!!!!!!!!!!11
ⓘ Source: listings_history table (triggers on properties + properties_extension) + one-shot
backfill from property_details.listing_events for pre-trigger history.
Tax reassessment forecast IN · Partial reset (capped growth)
- Current annual tax
- $2,125 · $177/mo
- Projected year-2 tax
- $2,125 · $177/mo
- Expected delta
- $0/yr ($0/mo · 0.0%)
ⓘ Screening estimate from a state-policy table — verify with the county assessor before closing.
Climate risk First Street
- Flood 1/10 Low FEMA zone X (unshaded) · 0% chance over 30 yrs
- Wildfire 1/10 Low
- Heat 4/10 Moderate 7 d/yr ≥101°F today · 19 d/yr by 30 yrs out
- Wind 2/10 Low 100% chance of damaging wind over 30 yrs
- Air quality 3/10 Moderate 2 unhealthy d/yr today · 3 by 30 yrs out
Nearby sold comps map
Loading sold comps map…
Walkable amenities ~0.75 mi
Loading nearby amenities…
Taxation est. · year 1
- Rental income
- $19,703
- − Mortgage interest
- −$10,923
- − Property taxes
- −$2,125
- − Insurance
- −$975
- − Repairs & maintenance
- −$1,576
- − Management
- −$1,576
- − Depreciation
- −$5,673
- Taxable loss
- −$3,146
- Est. tax savings @ 24.0%
- +$755
- After-tax cash flow
- $949/yr
For passive investors: Depreciation is non-cash, so a rental often shows a tax loss while cash-flowing — sheltering income. Rental losses are passive: they offset passive income freely, and up to $25,000/yr can offset ordinary (W-2) income if you actively participate and your MAGI is under $100k (phasing out to $0 by $150k); unused losses carry forward. On sale, claimed depreciation is recaptured at up to 25%, and gains may owe capital-gains tax (a 1031 exchange can defer both). Figures are a year-1 estimate at your 24.0% rate — not tax advice; consult a CPA.
Schools (NCES district)
- District
- Indianapolis Public Schools
- NCES district ID
- 1804770
- Math proficiency
- 14% ▼ -7.00%
- Reading proficiency
- 20% ▼ -3.00%
- Median HH income
- $32,034
- Composite
- 13.69/100
- National rank
- #9499
- State rank
- #286 of 301 in IN
Livability — Indianapolis city (balance)
No livability data for this city. (Only ~50 U.S. cities are tracked.)
Census & demographics
- Census place
- Indianapolis city (balance), IN
- County
- Marion County · 998,460 people
- City population
- 881,119
- Metro
- Indianapolis-Carmel-Anderson, IN
- Population (ZIP)
- 6,037
- Household income
- $55,190
- Rent vs Own
- Severe rent burden
- 311.0
Population outlook (Marion County) Hauer SSP2
- Today (2025)
- 1,025,572 people
- By 2030
- 1,065,727 · +3.9%
- By 2040
- 1,141,577 · +11.3%
- By 2050
- 1,208,920 · +17.9%
- By 2075
- 1,367,288 · +33.3%
- By 2100
- 1,438,201 · +40.2%
Race, ethnicity, and origin ACS 2023
- Neighborhood character
- Predominantly White (68%)
- Race & ethnicity
- White 68% Two or more races 12% Black 11% Hispanic / Latino 10% Asian 2%
- Hispanic origin (detail)
- Mexican 6%
- Common ancestry
- Romanian 2% Italian 2% Slovak 1%
- Foreign-born
- 9% · Canada
- Languages at home
- 88% English-only · Spanish 10% German/W. Germanic 1%
Political lean MEDSL · Marion
- 2024 margin
- Strong D (+27.7) · D 63.0% · R 35.3% · Other 1.7%
- 2008→2024 swing
- -0.7pp no change · 2008: 28.4pp · 2024: 27.7pp
- All cycles
- 2024: D+27.7 2020: D+29.1 2016: D+22.8 2012: D+22.2 2008: D+28.4
Not yet ingested
- Civics
- —
Market trends
- HPI YoY
- ▼ -36.19%
- Current HPI
- 403.9271
- Rent YoY
- ▲ 10.98%
- Metro
- Indianapolis-Carmel-Anderson, IN
- State GDP YoY
- ▲ 2.90%
- F500 in state
- 18
Industry mix (Fortune 500 HQ in IN)
| Industry | F500 HQs | Revenue |
|---|---|---|
| Industrial Machinery | 2 | $37B |
|
||
| Healthcare | 1 | $177B |
|
||
| Pharmaceuticals | 1 | $45B |
|
||
| Metals / Steel | 1 | $18B |
|
||
| Agriculture | 1 | $17B |
|
||
| Packaging | 1 | $12B |
|
||
Price history
+1208.7% since first listed3 events — show timeline
- 2026-05-26 Listed $195,000 MIBOR as Distributed by MLS Grid
- 2002-02-27 Sold (MLS) — MIBOR as Distributed by MLS Grid
- 2002-01-18 Listed $14,900 MIBOR as Distributed by MLS Grid
Property tax history
-3.7%/yrLatest (2025): $2,125 · -1.6% YoY. Source: county tax records.
Cash-flow waterfall
monthlySold comps — $/sqft
last 12 mo · ≤1 miLoading sold comps…