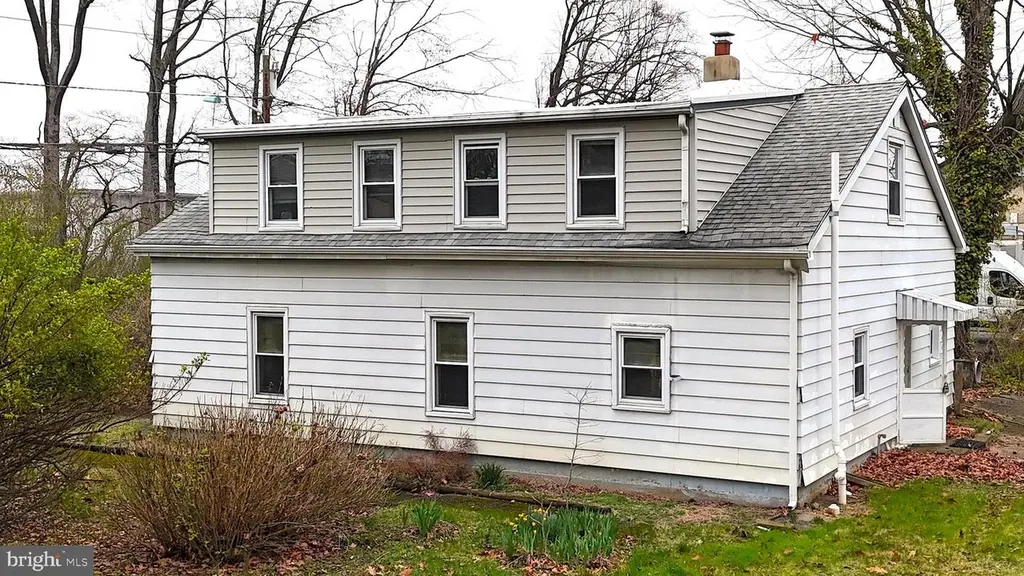
509 Woodland Ave · Golden Triangle, NJ
Flood risk 1/10 · Minimal
- FEMA flood zone
- X (unshaded)
- Chance of flooding over 30 yrs
- 0.0%
- Est. flood insurance / yr
- $507 – $1,088
Fire risk 1/10 · Minimal
- Est. fire insurance / yr
- $526 – $976
Heat risk 6/10 · Moderate
- Hot days now (above 104°F)
- 7 days/yr
- Hot days in 30 yrs
- 15 days/yr
Wind risk 6/10 · Moderate
- Chance of severe wind over 30 yrs
- 36.0%
Air-quality risk 4/10 · Minor
- Unhealthy air days now
- 4 days/yr
- Unhealthy air days in 30 yrs
- 6 days/yr
Risk factors via First Street. Map © Google.
Why this score? — see what drove the B grade
The composite is a weighted blend of 9 inputs, each scored 0–100. Each bar is that input's sub-score; the figure is the points it added to the 100-point composite (weight × sub-score).
- Cash flow +30.0/30.0
- 1% rule +10.0/10.0
- DSCR +10.0/10.0
- ARV discount +7.5/15.0
- Livability +4.2/5.0
- Schools +4.1/10.0
- Rent growth +3.2/5.0
- Condition / age +2.5/5.0
- Appreciation +0.0/10.0
$199,900
🖨 Deal sheet 📄 Offer letter ✓ Due diligence
Listing remarks
Come see this 4 bedroom, 1 full bathroom home located in Cherry Hill. The first floor offers a living room, dining room and bathroom. Second floor offers 4 bedrooms. Located near major south jersey highways. Property is being sold As-Is condition. Buyer is responsible for all certifications and the removal of all items inside and outside the home. Seller never occupied the home. Neither the seller or listing agent make any representation as to the accuracy of any information contained herein. Buyer must conduct their own due diligence, verification, research and inspections and are relying solely on the results thereof.
Key facts
- 0.41 acre lot
- 2 parking spots
- Built 1920
Neighborhood map
What this means for you Summary
Snapshot
- This is a 4-bed/1.0-bath single-family listed at $200k.
Deal economics
- At list price, monthly cash flow is $977 ($12k/yr) — positive.
- The deal already cash-flows at list — no discount required.
- Meets the 1% rule at list price ($3k rent vs $200k).
Location & tenants
- Location reads 85/100 on livability (#20 in NJ, #552 nationally) — a professional / high-income tenant draw. Strengths: crime A+, amenities A+, commute A+; Watch: cost of living F.
- Cherry Hill School District (suburban): math 27% / reading 59% proficiency, ranked #181 of 472 in NJ (top 38%) — families likely to look elsewhere, expect single-tenant / working-renter base with shorter leases; only 14% free/reduced lunch — higher-income household profile.
- Zoned schools: Cherry Hill High School West (math 11% / reading 51%, grade F, #277 of 399 statewide, top 70%, 1,355 students, 24% FRL).
- Zoned-school proficiency averages 31% at this address vs 43% district-wide (-12 pts) — the specific schools serving this property underperform the Cherry Hill School District average; the district grade overstates school quality for this exact location.
- Market conditions: Rents rising (+2.9%/yr); 99 active listings in the ZIP; 13 comparable units currently listed for rent nearby; rentals at typical pace (median 17d on market — plan ~3-4 weeks tenant-placement turnaround); solid renter incomes; 1,018 units permitted in Camden County in 2024 (509 in 5+ unit buildings).
- This rent runs 41% of the median local income ($101k/yr) — at the standard rent-burdened threshold; future hikes will face affordability resistance.
Forward outlook
- Local home prices are declining (-3.0%/yr); year-one equity from $1k of loan paydown is wiped out by about $6k of value loss. Plan a longer hold.
- Camden County population projected to shrink 8% by 2050 — rents likely to lag national; underwrite the cash flow, not the appreciation.
- At projected returns (-3.0% appreciation + 2.9% rent growth), your $56k cash investment doubles in ~6 years — after that, you're playing with house money.
Negotiation context
- Only 1 days on market — expect competitive offers; lowballing is unlikely to land.
Risks & watch-outs
- Watch-outs: property tax is 3.6% of price; built in 1920 — expect roof / HVAC / electrical / plumbing capex.
- Climate carrying-cost: major wind risk, 36% chance of damaging wind over 30y; extreme-heat days projected 7→15/yr by 2055 (HVAC capex compounding) — expect insurance premiums to compound above CPI over the hold.
Questions for the listing agent
- Built in 1920 — when were the roof, HVAC, electrical panel, plumbing, and water heater last replaced?
- Property tax is high relative to price — has the assessment been appealed recently, and will the sale trigger a re-assessment?
- Is there a deadline driving the sale (1031 exchange, divorce, estate, relocation)? That informs how much negotiation room exists.
- Schools are D-rated, which usually means shorter tenancies and higher turnover. Who's the typical renter profile here, and what's been the actual vacancy rate?
- What's the average days-on-market for RENTAL listings here right now (not sales)? A rising rental-DOM trend means longer vacancies and softer asking-rent achievability than the comps imply.
- What's the recent tenant-quality profile in this submarket — average credit score on applications, eviction rate, late-payment / NSF rate, and stable-employment percentage? A property-management company in the area should have these aggregated.
- How much new for-sale + rental construction is in the pipeline within 1–3 miles? Heavy new supply typically softens prices + rents 12–24 months out; constrained supply supports both.
Investment metrics
- 1% rule
- 1.72% ✓
- Cap rate
- 12.16%
- Cash-on-cash
- 20.95%
- DSCR
- 1.93
- GRM
- 4.9
CMA / ARV
- ARV (on-the-fly)
- $443,520
- Comps found
- 12
Show comp detail 12 sales within ~0.75 mi
| Address | Dist | Beds/Ba | Sqft | Sold | Price | $/sf | Match |
|---|---|---|---|---|---|---|---|
| 509 Woodland Ave | 0.00mi | 4/1.0 | 1,920 (0%) | 0mo | $200,000 | $104 | 100 |
| 521 Woodland Ave | 0.08mi | 4/2.5 | 2,000 (+4%) | 3mo | $465,000 | $233 | 81 |
| 414 Third Ave W | 0.29mi | 4/2.0 | 1,724 (-10%) | 0mo | $415,000 | $241 | 65 |
| 1615 Chapel Ave W | 0.07mi | 3/1.0 (-1) | 1,643 (-14%) | 5mo | $360,000 | $219 | 63 |
| 632 Longwood Ave | 0.50mi | 4/2.0 | 1,976 (+3%) | 6mo | $460,000 | $233 | 63 |
| 420 Yale Ave | 0.27mi | 3/2.5 (-1) | 1,818 (-5%) | 9mo | $465,000 | $256 | 60 |
| 623 Kenilworth Ave | 0.43mi | 4/2.0 | 2,092 (+9%) | 2mo | $425,000 | $203 | 59 |
| 214 Barlow Ave | 0.73mi | 4/3.0 | 1,932 (+1%) | 3mo | $315,000 | $163 | 54 |
| 514 Chapel Ave W | 0.63mi | 4/2.5 | 1,784 (-7%) | 8mo | $412,000 | $231 | 46 |
| 402 State St | 0.42mi | 3/1.5 (-1) | 1,632 (-15%) | 5mo | $353,000 | $216 | 44 |
| 327 Monroe Ave | 0.59mi | 4/2.5 | 2,192 (+14%) | 7mo | $465,000 | $212 | 37 |
| 525 Hanover Ave | 0.54mi | 3/2.5 (-1) | 2,153 (+12%) | 9mo | $500,000 | $232 | 36 |
Match score weights: distance 35% · size 25% · config 20% · recency 20%. Top-matched comps best support the ARV.
Projected returns pro-forma
-3.0% appreciation · 2.9% rent growth · sell at horizon
- IRR
- 13.3%
- Equity multiple
- 1.53×
- Total profit
- $29,766
- Equity at exit
- $29,806
- IRR
- 22.2%
- Equity multiple
- 2.89×
- Total profit
- $105,737
- Equity at exit
- $17,284
Cash invested: $55,972 (down + closing). Projections, not guarantees.
Landlord ↔ Tenant lean methodology
- Overall (STATE)
- 21 Tenant-Leaning
- State New Jersey
- 21 Tenant-Leaning · D+6
- County
- — inherits STATE
- City
- — inherits STATE
ZIP-level market 08002
- Rents YoY
- 2.9%
- Active inventory
- 99
- Price-to-rent
- 4.9×
Monthly cashflow live
- Estimated rent
- $3,434 high interval (Pro) →
- Mortgage (P&I)
- −$1,048
- Tax from tax record
- −$604 /mo · $7,249/yr
- Insurance
- −$83
- HOA
- −$0
- Vacancy / Maint / Mgmt
- −$721
- Net cashflow
- $977
Break-even live
UW: 25.0% down · 7.5% · 30yr · 1.5% tax · 5.0% vac · 8.0% maint · 8.0% mgmt
Financing live
Cash to close
- Down payment
- $49,975
- Closing costs
- $5,997
- Reserves months
- —
- Total cash needed
- —
Loan-product check · same deal, 3 products live
Conventional
25% down · 7.5% · 30yr
- Down + closing
- —
- Monthly P&I
- —
- Monthly cashflow
- —
- DSCR
- —
- Eligible?
- —
Personal DTI + credit; lowest rate.
DSCR
20% down · 8.5% · 30yr
- Down + closing
- —
- Monthly P&I
- —
- Monthly cashflow
- —
- DSCR
- —
- Eligible?
- —
No personal income docs; deal must DSCR.
Hard money
10% down · 12.0% · 12mo
- Down + closing
- —
- Monthly P&I
- —
- Monthly cashflow
- —
- DSCR
- —
- Eligible?
- —
Short-term bridge; refi at stabilization.
Rent comps 13 comps
| Address | Beds | Baths | Sqft | Rent | $/sqft | DOM | Units | Dist |
|---|---|---|---|---|---|---|---|---|
| 223 Breeders Cup Dr Cherry Hill, NJ | 3.0 | 2.0 | 1460 | $3,400 | $2.33 | 44d | 1 | 0.36mi |
| 1980 Route 70 W Cherry Hill, NJ | 1.0–3.0 | 1.0–2.0 | 1043 | $3,135 | $3.01 | 1d | 8 | 0.54mi |
| 726 Northwood Ave Cherry Hill, NJ | 3.0 | 2.5 | 1800 | $3,950 | $2.19 | 44d | 1 | 0.62mi |
| 415 Monmouth Dr Cherry Hill, NJ | 4.0 | 2.5 | 2277 | $3,750 | $1.65 | 1d | 1 | 0.63mi |
| 819 Mercer St Cherry Hill, NJ | 3.0 | 2.0 | 1883 | $3,200 | $1.70 | 20d | 1 | 0.65mi |
| 306 Lincoln Ave N Cherry Hill, NJ | 3.0 | 2.0 | 2166 | $2,900 | $1.34 | 44d | 1 | 0.69mi |
| 8 Orchard Ave Cherry Hill Township, NJ | 3.0 | 1.0 | 1700 | $2,830 | $1.66 | 44d | 1 | 0.96mi |
| 1 Burroughs Mill Cir Cherry Hill, NJ | 1.0–3.0 | 1.0–2.5 | 1142 | $3,508 | $3.07 | 1d | 25 | 1.09mi |
| 747 Hedy Ave Cherry Hill, NJ | 4.0 | 2.0 | 1888 | $3,695 | $1.96 | 5d | 1 | 1.19mi |
| 836 Cooper Landing Rd Cherry Hill, NJ | 3.0 | 1.0–2.0 | 901 | $2,915 | $3.24 | 1d | 18 | 1.20mi |
| 715 Cooper Landing Rd Cherry Hill, NJ | 3.0 | 2.0 | 1334 | $3,100 | $2.32 | 44d | 1 | 1.23mi |
| 5454 Burwood Ave Pennsauken, NJ | 3.0 | 1.5 | 1419 | $2,650 | $1.87 | 5d | 1 | 1.39mi |
| 619 N Edge Park Dr Haddonfield, NJ | 3.0 | 2.5 | 1990 | $5,850 | $2.94 | 17d | 1 | 1.48mi |
Listing history 2 events
-
2026-04-09status Pending
-
2026-04-08$199,900 Active
ⓘ Source: listings_history table (triggers on properties + properties_extension) + one-shot
backfill from property_details.listing_events for pre-trigger history.
Tax reassessment forecast NJ · Partial reset (capped growth)
- Current annual tax
- $7,249 · $604/mo
- Projected year-2 tax
- $7,249 · $604/mo
- Expected delta
- $0/yr ($0/mo · 0.0%)
ⓘ Screening estimate from a state-policy table — verify with the county assessor before closing.
Climate risk First Street
- Flood 1/10 Low FEMA zone X (unshaded) · 0% chance over 30 yrs
- Wildfire 1/10 Low
- Heat 6/10 Major 7 d/yr ≥104°F today · 15 d/yr by 30 yrs out
- Wind 6/10 Major 36% chance of damaging wind over 30 yrs
- Air quality 4/10 Moderate 4 unhealthy d/yr today · 6 by 30 yrs out
Nearby sold comps map
Loading sold comps map…
Walkable amenities ~0.75 mi
Loading nearby amenities…
Taxation est. · year 1
- Rental income
- $41,207
- − Mortgage interest
- −$11,198
- − Property taxes
- −$7,249
- − Insurance
- −$1,000
- − Repairs & maintenance
- −$3,297
- − Management
- −$3,297
- − Depreciation
- −$5,815
- Taxable income
- $9,353
- Est. tax owed @ 24.0%
- −$2,245
- After-tax cash flow
- $9,481/yr
For passive investors: Depreciation is non-cash, so a rental often shows a tax loss while cash-flowing — sheltering income. Rental losses are passive: they offset passive income freely, and up to $25,000/yr can offset ordinary (W-2) income if you actively participate and your MAGI is under $100k (phasing out to $0 by $150k); unused losses carry forward. On sale, claimed depreciation is recaptured at up to 25%, and gains may owe capital-gains tax (a 1031 exchange can defer both). Figures are a year-1 estimate at your 24.0% rate — not tax advice; consult a CPA.
Schools (NCES district)
- District
- Cherry Hill School District
- NCES district ID
- 3403000
- Math proficiency
- 27% ▼ -26.00%
- Reading proficiency
- 59% ▼ -10.00%
- Median HH income
- $90,394
- Composite
- 40.71/100
- National rank
- #3665
- State rank
- #181 of 472 in NJ
Livability — Golden Triangle
- Score
- 85/100
- State rank
- #20
- US rank
- #552
Category grades
Schools grade is shown separately in the Schools card above.
Census & demographics
- Census place
- Golden Triangle, NJ
- County
- Camden County · 407,624 people
- Metro
- Philadelphia-Camden-Wilmington, PA-NJ-DE-MD
- Population (ZIP)
- 24,015
- Household income
- $100,951
- Rent vs Own
- Severe rent burden
- 430.0
Population outlook (Camden County) Hauer SSP2
- Today (2025)
- 507,964 people
- By 2030
- 502,182 · -1.1%
- By 2040
- 485,602 · -4.4%
- By 2050
- 465,630 · -8.3%
- By 2075
- 419,986 · -17.3%
- By 2100
- 369,492 · -27.3%
Race, ethnicity, and origin ACS 2023
- Neighborhood character
- Diverse neighborhood (Simpson 0.56)
- Race & ethnicity
- White 64% Hispanic / Latino 12% Asian 12% Black 8% Two or more races 7%
- Hispanic origin (detail)
- Puerto Rican 7% Dominican 1%
- Common ancestry
- Romanian 8% Scotch-Irish 2% Italian 2%
- Foreign-born
- 18% · Vietnam, Canada, China
- Languages at home
- 73% English-only · Spanish 8% Russian/Polish/Slavic 4% Vietnamese 4%
Political lean MEDSL · Camden
- 2024 margin
- Strong D (+27.4) · D 63.0% · R 35.5% · Other 1.5%
- 2008→2024 swing
- -8.8pp toward R · 2008: 36.2pp · 2024: 27.4pp
- All cycles
- 2024: D+27.4 2020: D+33.5 2016: D+32.4 2012: D+36.6 2008: D+36.2
Not yet ingested
- Civics
- —
Market trends
- HPI YoY
- ▼ -201.30%
- Current HPI
- 358.1597
- Rent YoY
- ▲ 2.90%
- Metro
- Philadelphia-Camden-Wilmington, PA-NJ-DE-MD
- State GDP YoY
- ▲ 2.05%
- F500 in state
- 34
Industry mix (Fortune 500 HQ in NJ)
| Industry | F500 HQs | Revenue |
|---|---|---|
| Consumer Goods | 3 | $31B |
|
||
| Pharmaceuticals | 2 | $153B |
|
||
| Technology | 2 | $21B |
|
||
| Insurance | 2 | $20B |
|
||
| Healthcare | 2 | $19B |
|
||
| Financial Services | 1 | $70B |
|
||
Price history
2 events — show timeline
- 2026-04-09 Pending — BRIGHT MLS
- 2026-04-08 Listed $199,900 BRIGHT MLS
Property tax history
+1.8%/yrLatest (2025): $7,249 · +5.4% YoY. Source: county tax records.
Cash-flow waterfall
monthlySold comps — $/sqft
last 12 mo · ≤1 miLoading sold comps…