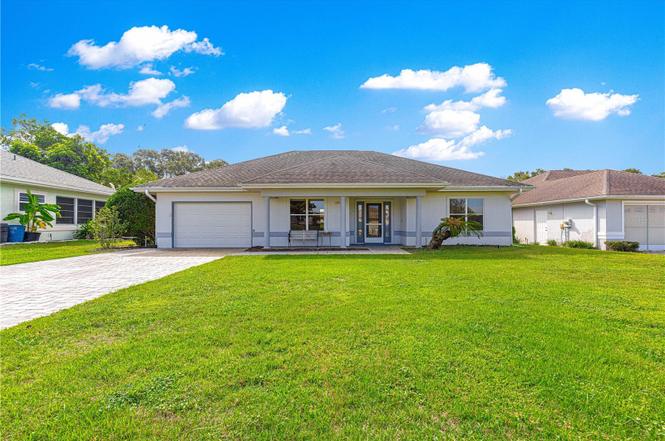
11246 SE 175th Ln · The Villages, FL
Flood risk 1/10 · Minimal
- FEMA flood zone
- X (unshaded)
- Chance of flooding over 30 yrs
- 0.0%
- Est. flood insurance / yr
- $507 – $1,088
Fire risk 4/10 · Minor
- Est. fire insurance / yr
- $947 – $1,759
Heat risk 8/10 · Major
- Hot days now (above 109°F)
- 6 days/yr
- Hot days in 30 yrs
- 18 days/yr
Wind risk 9/10 · Severe
- Chance of severe wind over 30 yrs
- 99.0%
Air-quality risk 3/10 · Minor
- Unhealthy air days now
- 2 days/yr
- Unhealthy air days in 30 yrs
- 2 days/yr
Risk factors via First Street. Map © Google.
Why this score? — see what drove the D+ grade
The composite is a weighted blend of 9 inputs, each scored 0–100. Each bar is that input's sub-score; the figure is the points it added to the 100-point composite (weight × sub-score).
- ARV discount +13.8/15.0
- Cash flow +13.4/30.0
- DSCR +4.0/10.0
- 1% rule +3.7/10.0
- Schools +3.6/10.0
- Livability +3.5/5.0
- Rent growth +2.5/5.0
- Condition / age +2.5/5.0
- Appreciation +0.0/10.0
$220,000
🖨 Deal sheet 📄 Offer letter ✓ Due diligence
Listing remarks
Welcome to the great community of Stonecrest. No CDD or Bond. This two bedroom two Bathroom home is ready for you to remodel and to make your own. As you drive up to this beautiful home you will notice the very large driveway that will accommodate a lot of your friends vehicles so they won't have to park on the street. The driveway has been covered in brick pavers and as you park your car you will notice the covered front porch a great place to enjoy your morning coffee in any weather. As you walk into the front door you will notice the open floor plan but also notice the convenience of both bedroom entrances just inside the front door. As you walk in the home further you will see the great
Key facts
- Covered front porch
- Large driveway
- Open floor plan
Tags
Property features AI
Finance
- Other: Total building area 2,660 sq ft (public records); Living area 1,312 sq ft (public records); Lot approximately 0.2 acre (70 x 127); Property zoned PUD; Homestead exemption indicated; Direction faces North
- Financial info: Lease restrictions apply
- HOA & community: HOA: Carmel Knight (monthly fee $148); HOA fee includes common area taxes and pool; Community clubhouse; Fitness center; Pool and spa/hot tub; Tennis courts; Pickleball courts; Gated community; Dog park; Street lights; Golf course access and golf carts allowed; Association recreation owned; Deed restrictions; Cats and dogs allowed
Exterior
- Parking: Attached garage (1 car)
- Utilities: Public water; Public sewer; Cable connected; Electricity connected; Sewer connected; Sprinkler meter; Underground utilities; Irrigation equipment
- Home design: Single family residence; One story; North-facing
- Construction: Stucco and frame construction; Shingle roof; Slab foundation; Built as a fixer condition
- Exterior features: Covered patio/porch; Front porch; Screened porch; Private mailbox; Sliding doors; Mature landscaping; Near golf course; Landscaped site; Level lot; Paved access
Interior
- Kitchen: Dishwasher; Disposal; Microwave; Range; Refrigerator; Electric water heater
- Bedrooms: 2 bedrooms
- Flooring: Carpet; Tile
- Bathrooms: 2 full bathrooms
- Heating & cooling: Heat pump; Central air
- Interior features: Cathedral ceilings; Ceiling fans; High ceilings; Kitchen/family room combo; Open floorplan; Split bedroom floorplan; Walk-in closets; Window treatments
- Laundry & utility: Laundry room; Washer; Dryer
Neighborhood map
What this means for you Summary
Snapshot
- This is a 2-bed/2.0-bath single-family listed at $220k.
Deal economics
- At list price, monthly cash flow is $4 ($52/yr) — positive.
- The deal already cash-flows at list — no discount required.
- To meet the 1% rule (rent ≥ 1% of price), the offer needs to be $192k (12.5% below list).
- Recommended offer: $192k (12.5% below list) — sets the bar for 1% rule.
- Cap rate 6.3% vs local median 5.0% in The Villages — meaningfully above typical; check what's discounted (condition, days-on-market, listing class) to confirm the premium yield is real.
Location & tenants
- Location reads 70/100 on livability (#431 in FL) — a middle-class / working-renter tenant base. Strengths: schools A+, crime A+, housing A; Watch: amenities F, commute F, health & safety F.
- Marion (rural): math 42% / reading 43% proficiency, ranked #61 of 73 in FL (top 84%) — families likely to look elsewhere, expect single-tenant / working-renter base with shorter leases; 61% free/reduced lunch — lower-income household profile, screen leases tightly.
- Market conditions: 705 active listings in the ZIP; 17 comparable units currently listed for rent nearby; rentals at typical pace (median 21d on market — plan ~3-4 weeks tenant-placement turnaround); 7,071 units permitted in Marion County in 2024 (534 in 5+ unit buildings).
- This rent runs 35% of the median local income ($67k/yr) — at the standard rent-burdened threshold; future hikes will face affordability resistance.
Forward outlook
- Local home prices are declining (-3.0%/yr); year-one equity from $2k of loan paydown is wiped out by about $7k of value loss. Plan a longer hold.
- Marion County population projected at +13% by 2050 — modest demand growth; plan on rents tracking national, not racing it.
Negotiation context
- It's been on market 229 days — a 12% lower offer ($194k) is reasonable based on typical stale-listing flexibility.
- Current owner paid $87k; list at $220k implies a 154% gain — meaningful room to come down on a strong offer.
Risks & watch-outs
- Climate carrying-cost: severe wind risk, 99% chance of damaging wind over 30y; extreme-heat days projected 6→18/yr by 2055 (HVAC capex compounding) — expect insurance premiums to compound above CPI over the hold.
Questions for the listing agent
- It's been on market 229 days. Have you received any prior offers? Is the seller open to a 13% concession, seller financing, or rate buy-down credit?
- What does the HOA fee cover, when was the last increase, and are there any pending special assessments or reserve-fund shortfalls?
- Why hasn't it sold? Are there any deal-killer items the seller is aware of (foundation, flood, title, zoning, code violations)?
- Is there a deadline driving the sale (1031 exchange, divorce, estate, relocation)? That informs how much negotiation room exists.
- Schools are A-rated — typically a magnet for longer-tenancy family renters. What's the average tenant stay here, and is there a school-zone premium baked into asking?
- The area grade is low — what's the realistic commute time and amenity access for the typical tenant pool here? Any planned neighborhood developments (good or bad) we should know about?
- What's the average days-on-market for RENTAL listings here right now (not sales)? A rising rental-DOM trend means longer vacancies and softer asking-rent achievability than the comps imply.
- What's the recent tenant-quality profile in this submarket — average credit score on applications, eviction rate, late-payment / NSF rate, and stable-employment percentage? A property-management company in the area should have these aggregated.
- How much new for-sale + rental construction is in the pipeline within 1–3 miles? Heavy new supply typically softens prices + rents 12–24 months out; constrained supply supports both.
Investment metrics
- 1% rule
- 0.87% ✗
- Cap rate
- 6.32%
- Cash-on-cash
- 0.09%
- DSCR
- 1.00
- GRM
- 9.5
CMA / ARV
- ARV (on-the-fly)
- $255,840
- Comps found
- 5
Show comp detail 5 sales within ~0.75 mi
| Address | Dist | Beds/Ba | Sqft | Sold | Price | $/sf | Match |
|---|---|---|---|---|---|---|---|
| 11101 SE 174th Loop | 0.34mi | 3/2.0 (+1) | 1,329 (+1%) | 23mo | $351,000 | $264 | 58 |
| 10699 SE 178th St | 0.61mi | 2/2.0 | 1,248 (-5%) | 10mo | $179,000 | $143 | 55 |
| 17971 SE 105th Ct | 0.73mi | 2/2.0 | 1,296 (-1%) | 20mo | $242,000 | $187 | 47 |
| 17963 SE 105th Ct | 0.74mi | 2/2.0 | 1,206 (-8%) | 20mo | $235,000 | $195 | 35 |
| 12079 SE 175th Loop | 0.72mi | 3/2.0 (+1) | 1,475 (+12%) | 19mo | $320,000 | $217 | 25 |
Match score weights: distance 35% · size 25% · config 20% · recency 20%. Top-matched comps best support the ARV.
Projected returns pro-forma
-3.0% appreciation · 3.0% rent growth · sell at horizon
- IRR
- -16.2%
- Equity multiple
- 0.43×
- Total profit
- $-35,345
- Equity at exit
- $32,803
- IRR
- -7.8%
- Equity multiple
- 0.51×
- Total profit
- $-30,312
- Equity at exit
- $19,022
Cash invested: $61,600 (down + closing). Projections, not guarantees.
Landlord ↔ Tenant lean methodology
- Overall (STATE)
- 87 Strongly Landlord-Friendly
- State Florida
- 87 Strongly Landlord-Friendly · R+3
- County
- — inherits STATE
- City
- — inherits STATE
ZIP-level market 34491
- Home prices YoY
- -35.0%
- Active inventory
- 705
- Price-to-rent
- 9.5×
Monthly cashflow live
- Estimated rent
- $1,925 high interval (Pro) →
- Mortgage (P&I)
- −$1,154
- Tax from tax record
- −$123 /mo · $1,476/yr
- Insurance
- −$92
- HOA
- −$148
- Vacancy / Maint / Mgmt
- −$404
- Net cashflow
- $4
Break-even live
UW: 25.0% down · 7.5% · 30yr · 1.5% tax · 5.0% vac · 8.0% maint · 8.0% mgmt
Financing live
Cash to close
- Down payment
- $55,000
- Closing costs
- $6,600
- Reserves months
- —
- Total cash needed
- —
Loan-product check · same deal, 3 products live
Conventional
25% down · 7.5% · 30yr
- Down + closing
- —
- Monthly P&I
- —
- Monthly cashflow
- —
- DSCR
- —
- Eligible?
- —
Personal DTI + credit; lowest rate.
DSCR
20% down · 8.5% · 30yr
- Down + closing
- —
- Monthly P&I
- —
- Monthly cashflow
- —
- DSCR
- —
- Eligible?
- —
No personal income docs; deal must DSCR.
Hard money
10% down · 12.0% · 12mo
- Down + closing
- —
- Monthly P&I
- —
- Monthly cashflow
- —
- DSCR
- —
- Eligible?
- —
Short-term bridge; refi at stabilization.
Rent comps 17 comps
| Address | Beds | Baths | Sqft | Rent | $/sqft | DOM | Units | Dist |
|---|---|---|---|---|---|---|---|---|
| 13957 County Road 109D Lady Lake, FL | 2.0 | 2.0 | 1482 | $1,650 | $1.11 | 21d | 1 | 0.47mi |
| 13904 County Road 109D Lady Lake, FL | 3.0 | 2.0 | 1568 | $1,550 | $0.99 | 21d | 1 | 0.52mi |
| 17951 SE 115th Cir Summerfield, FL | 3.0 | 2.0 | 1829 | $2,100 | $1.15 | 13d | 1 | 0.63mi |
| 13765 NE 136th Loop Lady Lake, FL | 1.0–3.0 | 1.0–2.0 | 1078 | $1,639 | $1.52 | 21d | 36 | 0.80mi |
| 17408 SE 121st Cir Summerfield, FL | 3.0 | 2.0 | 1733 | $1,850 | $1.07 | 21d | 1 | 0.83mi |
| 13740 Lead LN The Villages, FL | 1.0–3.0 | 1.0–2.0 | 1029 | $1,720 | $1.67 | 21d | 38 | 0.84mi |
| 17472 SE 121st Cir Summerfield, FL | 3.0 | 2.0 | 1330 | $1,950 | $1.47 | 13d | 1 | 0.88mi |
| 10397 SE 176th St Summerfield, FL | 2.0 | 2.0 | 1296 | $2,150 | $1.66 | 21d | 1 | 0.96mi |
| 1377 Camero Dr Lady Lake, FL | 3.0 | 2.0 | 1462 | $5,500 | $3.76 | 21d | 1 | 1.04mi |
| 1532 W Schwartz Blvd Lady Lake, FL | 2.0 | 2.0 | 1092 | $2,950 | $2.70 | 23d | 1 | 1.21mi |
| 17532 SE 100th Ct Summerfield, FL | 2.0 | 2.0 | 1217 | $1,800 | $1.48 | 21d | 1 | 1.29mi |
| 1401 W Schwartz Blvd Lady Lake, FL | 2.0 | 2.0 | 1552 | $1,999 | $1.29 | 23d | 1 | 1.35mi |
| 1430 W Schwartz Blvd Lady Lake, FL | 2.0 | 2.0 | 1377 | $2,500 | $1.82 | 23d | 1 | 1.37mi |
| 1614 Kiley Ct Unit 1545709P Lady Lake, FL | 2.0 | 2.0 | 1593 | $3,452 | $2.17 | 16d | 1 | 1.38mi |
| 909 Orchid St Lady Lake, FL | 2.0 | 1.0 | 936 | $1,600 | $1.71 | 23d | 1 | 1.42mi |
| 11001 SE Sunset Harbor Rd Unit H52 Summerfield, FL | 2.0 | 2.5 | 1224 | $1,440 | $1.18 | 21d | 1 | 1.46mi |
| 11001 SE Sunset Harbor Rd Summerfield, FL | 2.0 | 1.5–2.0 | 1244 | $1,770 | $1.42 | 21d | 2 | 1.48mi |
HOA detail
- Monthly dues
- $148 · $1,776/yr
Listing history 5 events
-
2026-05-10status Pending
-
2026-02-24price $220,000
-
2025-09-23$250,000 Active
-
1993-01-08soldstatus $86,560
-
1992-12-01soldstatus $74,200
ⓘ Source: listings_history table (triggers on properties + properties_extension) + one-shot
backfill from property_details.listing_events for pre-trigger history.
Tax reassessment forecast FL · Resets to sale price
- Current annual tax
- $1,476 · $123/mo
- Projected year-2 tax
- $1,826 · $152/mo
- Expected delta
- +$350/yr (+$29/mo · 23.7%)
ⓘ Screening estimate from a state-policy table — verify with the county assessor before closing.
Climate risk First Street
- Flood 1/10 Low FEMA zone X (unshaded) · 0% chance over 30 yrs
- Wildfire 4/10 Moderate
- Heat 8/10 Severe 6 d/yr ≥109°F today · 18 d/yr by 30 yrs out
- Wind 9/10 Extreme 99% chance of damaging wind over 30 yrs
- Air quality 3/10 Moderate 2 unhealthy d/yr today · 2 by 30 yrs out
Nearby sold comps map
Loading sold comps map…
Walkable amenities ~0.75 mi
Loading nearby amenities…
Taxation est. · year 1
- Rental income
- $23,099
- − Mortgage interest
- −$12,323
- − Property taxes
- −$1,476
- − Insurance
- −$1,100
- − Repairs & maintenance
- −$1,848
- − Management
- −$1,848
- − HOA
- −$1,776
- − Depreciation
- −$6,400
- Taxable loss
- −$3,672
- Est. tax savings @ 24.0%
- +$881
- After-tax cash flow
- $934/yr
For passive investors: Depreciation is non-cash, so a rental often shows a tax loss while cash-flowing — sheltering income. Rental losses are passive: they offset passive income freely, and up to $25,000/yr can offset ordinary (W-2) income if you actively participate and your MAGI is under $100k (phasing out to $0 by $150k); unused losses carry forward. On sale, claimed depreciation is recaptured at up to 25%, and gains may owe capital-gains tax (a 1031 exchange can defer both). Figures are a year-1 estimate at your 24.0% rate — not tax advice; consult a CPA.
Schools (NCES district)
- District
- Marion
- NCES district ID
- 1201260
- Math proficiency
- 42% ▼ -7.00%
- Reading proficiency
- 43% ▼ -4.00%
- Median HH income
- $40,015
- Composite
- 35.61/100
- National rank
- #4890
- State rank
- #61 of 73 in FL
Livability — The Villages
- Score
- 70/100
- State rank
- #431
- US rank
- #7363
Category grades
Schools grade is shown separately in the Schools card above.
Census & demographics
- County
- Marion County · 315,796 people
- City population
- 83,973
- Metro
- Ocala, FL
- Population (ZIP)
- 33,318
- Household income
- $66,679
- Rent vs Own
- Severe rent burden
- 256.0
Population outlook (Marion County) Hauer SSP2
- Today (2025)
- 365,905 people
- By 2030
- 376,768 · +3.0%
- By 2040
- 396,555 · +8.4%
- By 2050
- 412,723 · +12.8%
- By 2075
- 446,090 · +21.9%
- By 2100
- 436,193 · +19.2%
Race, ethnicity, and origin ACS 2023
- Neighborhood character
- Predominantly White (77%)
- Race & ethnicity
- White 77% Hispanic / Latino 14% Two or more races 9% Black 4% Asian 2%
- Hispanic origin (detail)
- Mexican 3% Puerto Rican 6% Cuban 1%
- Common ancestry
- Lithuanian 3% Slovak 2% Romanian 2%
- Foreign-born
- 8% · Canada, Vietnam, Jamaica
- Languages at home
- 85% English-only · Spanish 11% Vietnamese 1% French/Haitian/Cajun 1%
Political lean MEDSL · Marion
- 2024 margin
- Solid R (+31.6) · D 33.8% · R 65.5%
- 2008→2024 swing
- -20.0pp toward R · 2008: -11.6pp · 2024: -31.6pp
- All cycles
- 2024: R+31.6 2020: R+25.9 2016: R+26.2 2012: R+16.2 2008: R+11.6
Not yet ingested
- Civics
- —
Market trends
- HPI YoY
- ▼ -107.67%
- Current HPI
- 200.0792
- Rent YoY
- —
- Metro
- Ocala, FL
- State GDP YoY
- ▲ 3.28%
- F500 in state
- 36
Industry mix (Fortune 500 HQ in FL)
| Industry | F500 HQs | Revenue |
|---|---|---|
| Industrial Technology | 2 | $29B |
|
||
| Insurance | 2 | $17B |
|
||
| Retail | 1 | $60B |
|
||
| Technology Distribution | 1 | $58B |
|
||
| Homebuilding | 1 | $35B |
|
||
| Technology Manufacturing | 1 | $35B |
|
||
Price history
+196.5% since first listed5 events — show timeline
- 2026-05-10 Pending — Stellar MLS as Distributed by MLS Grid
- 2026-02-24 Price Changed $220,000 Stellar MLS as Distributed by MLS Grid
- 2025-09-23 Listed $250,000 Stellar MLS as Distributed by MLS Grid
- 1993-01-08 Sold (Public Records) $86,560 Public Records
- 1992-12-01 Sold (Public Records) $74,200 Public Records
Property tax history
+4.1%/yrLatest (2025): $1,476 · +19.1% YoY. Source: county tax records.
Cash-flow waterfall
monthlySold comps — $/sqft
last 12 mo · ≤1 miLoading sold comps…