 Duplex
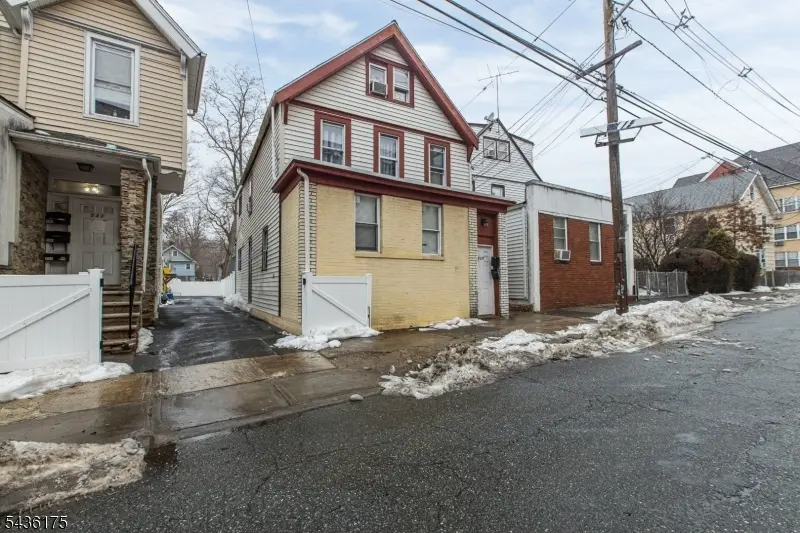
527 Valley St #2 · East Orange, NJ
Flood risk 1/10 · Minimal
- FEMA flood zone
- AO
- Chance of flooding over 30 yrs
- 0.0%
- Est. flood insurance / yr
- $848 – $2,087
Fire risk 1/10 · Minimal
- Est. fire insurance / yr
- $526 – $976
Heat risk 7/10 · Major
- Hot days now (above 100°F)
- 7 days/yr
- Hot days in 30 yrs
- 15 days/yr
Wind risk 6/10 · Moderate
- Chance of severe wind over 30 yrs
- 27.0%
Air-quality risk 4/10 · Minor
- Unhealthy air days now
- 3 days/yr
- Unhealthy air days in 30 yrs
- 5 days/yr
Risk factors via First Street. Map © Google.
Why this score? — see what drove the C+ grade
The composite is a weighted blend of 9 inputs, each scored 0–100. Each bar is that input's sub-score; the figure is the points it added to the 100-point composite (weight × sub-score).
- Cash flow +27.5/30.0
- DSCR +9.7/10.0
- 1% rule +7.5/10.0
- ARV discount +7.5/15.0
- Rent growth +3.7/5.0
- Livability +3.7/5.0
- Condition / age +2.2/5.0
- Schools +1.7/10.0
- Appreciation +0.0/10.0
$499,999
🖨 Deal sheet (PDF) 📄 Offer letter ✓ Due diligence
Multi-family units
County records classify this as Multi-Family (2-4 Unit). Listing-text estimate: 2 units. confirmed
Listing remarks
Income-producing two-family property with tremendous upside potential! Perfect for investors, house hackers, or buyers looking to offset their mortgage with rental income. Spacious units, desirable location, and convenient access to NYC transportation, major roadways, shopping, and local amenities make this an opportunity you don't want to miss. Strong long-term investment potential in a growing market. Submit your offer today!
Key facts
- Desirable location
- Convenient access
- Two-family property
Tags
Property features AI
Finance
- Other: Owner pays water; tenants pay electric, gas, and heat (per unit)
- Financial info: 2-unit property; Gross operating income: $67,000; Net operating income: $54,000; Total operating expenses: $10,000; Expenses include hot & cold water, insurance, maintenance, taxes; Unit 1 rent: $2,000; Unit 2 rent: currently $0
Exterior
- Parking: 2 parking spaces; Shared driveway
- Security: Carbon monoxide detectors (both units); Smoke detectors (both units); Fire alarm system (both units)
- Utilities: Public water; Public sewer; Gas in street; Cable TV available
- Home design: Two-story unit style
- Construction: Approximate year built
- Exterior features: Brick and vinyl siding; Asphalt shingle roof; Driveway easement (shared driveway)
Interior
- Kitchen: Unit 1: Gas range/oven, refrigerator; Unit 2: Gas range/oven, refrigerator; Unit 1: Eat-in kitchen
- Bedrooms: Unit 1: 3 bedrooms; Unit 2: 4 bedrooms
- Bathrooms: 2 full bathrooms (total); Unit 1: 1 bathroom; Unit 2: 1 bathroom
- Heating & cooling: Two heating units with radiant hot water; Natural gas heating fuel; Two cooling units, ceiling fan, wall A/C unit(s)
- Interior features: Gas water heater; Unfinished basement
- Laundry & utility: Unit 1: Stackable washer/dryer
Neighborhood map
What this means for you Summary
Snapshot
- This is a 2 × 4-bed/1.0-bath units multifamily listed at $500k. Condition is rated fair.
Deal economics
- At list price, monthly cash flow is $1k ($16k/yr) — positive. Per door: $681/mo.
- The deal already cash-flows at list — no discount required.
- Meets the 1% rule at list price ($6k rent vs $500k).
- Recommended offer: $492k (1.5% below list) — sets the bar for market timing.
- Cap rate 9.9% vs local median 3.0% in East Orange — top-decile yield for the area; either an underpriced asset or a hidden risk that comps aren't pricing in. Stress-test before assuming the spread holds.
Location & tenants
- Location reads 73/100 on livability (#189 in NJ) — a middle-class / working-renter tenant base. Strengths: commute A+, health & safety A, housing A-; Watch: schools C-, crime D-, amenities F.
- Orange Board Of Education School District (suburban): math 10% / reading 32% proficiency, ranked #432 of 472 in NJ (top 92%) — low school quality limits family demand, transient renter base, plan for 1-2y turnover; 72% free/reduced lunch — lower-income household profile, screen leases tightly.
- Market conditions: Rents rising fast (+4.6%/yr); 41 active listings in the ZIP; 3,364 units permitted in Essex County in 2024 (2,551 in 5+ unit buildings).
- At $6,253/mo this rent would consume 143% of the median local household income ($53k/yr) (locally 2703% of renters already pay >50% of income on rent) — very limited rent-growth headroom before tenants either downsize or default.
Forward outlook
- Local home prices are declining (-3.0%/yr); year-one equity from $3k of loan paydown is wiped out by about $15k of value loss. Plan a longer hold.
- Essex County population projected at +3% by 2050 — modest demand growth; plan on rents tracking national, not racing it.
- At projected returns (-3.0% appreciation + 4.6% rent growth), your $140k cash investment doubles in ~9 years — after that, you're playing with house money.
Negotiation context
- It's been on market 17 days — a 2% lower offer ($492k) is reasonable based on typical stale-listing flexibility.
Risks & watch-outs
- Watch-outs: flood insurance adds $122/mo; built in 1950 — expect roof / HVAC / electrical / plumbing capex.
- Climate carrying-cost: in FEMA flood zone AO (mandatory federal flood insurance); major wind risk, 27% chance of damaging wind over 30y; extreme-heat days projected 7→15/yr by 2055 (HVAC capex compounding) — expect insurance premiums to compound above CPI over the hold.
Questions for the listing agent
- Can we see the unit-by-unit rent roll, current vacancy, and any below-market leases? What's the average tenancy length?
- What capital expenditures (roof, boiler, parking lot, exteriors) have been made in the last 5 years, and what's planned in the next 2?
- Have any recent inspections been done? Can we get a copy of the seller's disclosures and any deferred-maintenance estimates?
- Built in 1950 — when were the roof, HVAC, electrical panel, plumbing, and water heater last replaced?
- What's the actual annual flood-insurance premium (NFIP or private), and is the property in a SFHA with mandatory coverage?
- Is there a deadline driving the sale (1031 exchange, divorce, estate, relocation)? That informs how much negotiation room exists.
- Crime grade is D in this area — have there been break-ins, vandalism, or insurance claims at this property in the last 3 years? What carrier currently insures it and at what premium?
- What's the average days-on-market for RENTAL listings here right now (not sales)? A rising rental-DOM trend means longer vacancies and softer asking-rent achievability than the comps imply.
- What's the recent tenant-quality profile in this submarket — average credit score on applications, eviction rate, late-payment / NSF rate, and stable-employment percentage? A property-management company in the area should have these aggregated.
- How much new apartment / multifamily construction is in the pipeline within 1–3 miles? Heavy new supply (>2% of stock underway) typically softens rents 12–24 months out; light construction supports rent growth.
Investment metrics
- 1% rule
- 1.25% ✓
- Cap rate
- 9.86%
- Cash-on-cash
- 12.72%
- DSCR
- 1.57
- GRM
- 6.7
CMA / ARV
No comps found within radius.
Show comp detail 8 sales within ~0.75 mi
| Address | Dist | Beds/Ba | Sqft | Sold | Price | $/sf | Match |
|---|---|---|---|---|---|---|---|
| 519 Chestnut St | 0.32mi | 7/3.0 (-1) | 3,176 | 7mo | $520,000 | $164 | 58 |
| 88 Riggs Pl | 0.65mi | 8/3.0 | — | 1mo | $645,000 | — | 53 |
| 409 Berwick St | 0.42mi | 7/3.0 (-1) | — | 8mo | $599,000 | — | 52 |
| 572 Nassau St | 0.12mi | 7/5.0 (-1) | — | 16mo | $680,000 | — | 52 |
| 566 Mcchesney St | 0.13mi | 8/6.0 | — | 19mo | $840,000 | — | 50 |
| 439 New England Ter | 0.55mi | 7/4.0 (-1) | — | 10mo | $770,000 | — | 40 |
| 1 Riggs Pl | 0.69mi | 8/3.0 | — | 17mo | $931,000 | — | 37 |
| 21-23 Lafayette St | 0.62mi | 8/4.0 | — | 20mo | $650,000 | — | 34 |
Match score weights: distance 35% · size 25% · config 20% · recency 20%. Top-matched comps best support the ARV.
Projected returns pro-forma
-3.0% appreciation · 4.64% rent growth · sell at horizon
- IRR
- 3.0%
- Equity multiple
- 1.12×
- Total profit
- $16,394
- Equity at exit
- $74,551
- IRR
- 14.1%
- Equity multiple
- 2.22×
- Total profit
- $171,176
- Equity at exit
- $43,231
Cash invested: $140,000 (down + closing). Projections, not guarantees.
Landlord ↔ Tenant lean methodology
- Overall (STATE)
- 21 Tenant-Leaning
- State New Jersey
- 21 Tenant-Leaning · D+6
- County
- — inherits STATE
- City
- — inherits STATE
ZIP-level market 07050
- Home prices YoY
- -33.3%
- Rents YoY
- 4.6%
- Active inventory
- 41
- Price-to-rent
- 13.3×
Monthly cashflow live
- Estimated rent
- $6,253 high interval (Pro) →
- Mortgage (P&I)
- −$2,622
- Tax est. 1.5%
- −$625 /mo · $7,500/yr
- Insurance
- −$208
- Flood insurance flood zone
- −$122 /mo · $1,468/yr
- HOA
- −$0
- Vacancy / Maint / Mgmt
- −$1,313
- Net cashflow
- $1,362
Break-even live
Sensitivity live
| Price | -10% $1,708 | -5% $1,535 | +0% $1,362 | +5% $1,189 | +10% $1,017 |
|---|---|---|---|---|---|
| Rent | -10% $868 | -5% $1,115 | +0% $1,362 | +5% $1,609 | +10% $1,856 |
| Rate | -1.0pp $1,614 | -0.5pp $1,489 | base $1,362 | +0.5pp $1,233 | +1.0pp $1,101 |
2-unit breakdown (identical units grouped — click to expand)
| Units | Beds | Baths | Est. rent |
|---|---|---|---|
| 2× units | 4 | 1 | $6,254 |
| #1 | 4 | 1 | $3,127 |
| #2 | 4 | 1 | $3,127 |
| Total (2 units) | $6,253 | ||
UW: 25.0% down · 7.5% · 30yr · 1.5% tax · 5.0% vac · 8.0% maint · 8.0% mgmt
Financing live
Cash to close
- Down payment
- $125,000
- Closing costs
- $15,000
- Reserves months
- —
- Total cash needed
- —
Loan-product check · same deal, 3 products live
Conventional
25% down · 7.5% · 30yr
- Down + closing
- —
- Monthly P&I
- —
- Monthly cashflow
- —
- DSCR
- —
- Eligible?
- —
Personal DTI + credit; lowest rate.
DSCR
20% down · 8.5% · 30yr
- Down + closing
- —
- Monthly P&I
- —
- Monthly cashflow
- —
- DSCR
- —
- Eligible?
- —
No personal income docs; deal must DSCR.
Hard money
10% down · 12.0% · 12mo
- Down + closing
- —
- Monthly P&I
- —
- Monthly cashflow
- —
- DSCR
- —
- Eligible?
- —
Short-term bridge; refi at stabilization.
Listing history 13 events
-
2026-06-18days on market $499,999 Active 17 DOM
-
2026-06-17days on market $499,999 Active 16 DOM
-
2026-06-16days on market $499,999 Active 15 DOM
-
2026-06-15days on market $499,999 Active 14 DOM
-
2026-06-13days on market $499,999 Active 12 DOM
-
2026-06-13days on market $499,999 Active 11 DOM
-
2026-06-09days on market $499,999 Active 8 DOM
-
2026-06-08days on market $499,999 Active 7 DOM
-
2026-06-07days on market $499,999 Active 6 DOM
-
2026-06-04days on market $499,999 Active 3 DOM
-
2026-06-03days on market $499,999 Active 2 DOM
-
2026-06-02remarks 431-char remark
-
2026-06-02$499,999 Active 1 DOM
ⓘ Source: listings_history table (triggers on properties + properties_extension) + one-shot
backfill from property_details.listing_events for pre-trigger history.
Climate risk First Street
- Flood 1/10 Low FEMA zone AO · 0% chance over 30 yrs
- Wildfire 1/10 Low
- Heat 7/10 Severe 7 d/yr ≥100°F today · 15 d/yr by 30 yrs out
- Wind 6/10 Major 27% chance of damaging wind over 30 yrs
- Air quality 4/10 Moderate 3 unhealthy d/yr today · 5 by 30 yrs out
Nearby sold comps map
Loading sold comps map…
Walkable amenities ~0.75 mi
Loading nearby amenities…
Taxation est. · year 1
- Rental income
- $75,036
- − Mortgage interest
- −$28,008
- − Property taxes
- −$7,500
- − Insurance
- −$3,967
- − Repairs & maintenance
- −$6,003
- − Management
- −$6,003
- − Depreciation
- −$14,545
- Taxable income
- $9,010
- Est. tax owed @ 24.0%
- −$2,162
- After-tax cash flow
- $14,184/yr
For passive investors: Depreciation is non-cash, so a rental often shows a tax loss while cash-flowing — sheltering income. Rental losses are passive: they offset passive income freely, and up to $25,000/yr can offset ordinary (W-2) income if you actively participate and your MAGI is under $100k (phasing out to $0 by $150k); unused losses carry forward. On sale, claimed depreciation is recaptured at up to 25%, and gains may owe capital-gains tax (a 1031 exchange can defer both). Figures are a year-1 estimate at your 24.0% rate — not tax advice; consult a CPA.
Condition & rehab AI · 12 photos
This two-family property requires moderate rehabilitation to improve its condition and enhance its value. Key areas for improvement include exterior siding, landscaping, and interior paint. Updates to bathrooms and HVAC systems can also significantly boost its appeal to buyers and renters.
Repairs flagged
- Major Exterior siding — Signs of peeling paint and weathering indicate significant damage.
- Major Landscaping — Minimal landscaping and snow accumulation suggest a lack of maintenance.
- Minor Interior walls/paint — Some touch-ups may be needed to improve appearance.
- Minor Bathrooms — Updates to fixtures and finishes could enhance value.
- Minor HVAC/mechanicals — Inspection may be needed to ensure efficiency and functionality.
- Minor Exterior lighting — Adding exterior lighting could improve safety and curb appeal.
Value-add opportunities
- Both Painting exterior siding — Fresh paint can improve curb appeal and home value.
- Both Landscaping and snow removal — A well-maintained yard can enhance both resale and rental value.
- Both Updating bathroom fixtures and finishes — Modern fixtures and finishes can attract more buyers and renters.
- Both HVAC inspection and maintenance — A functional HVAC system can improve comfort and energy efficiency, attracting more buyers and renters.
- Both Interior paint touch-ups — Fresh paint can improve the overall appearance and attract more buyers and renters.
Renovation cost estimate screening
| Repair item | Severity | Est. cost |
|---|---|---|
| Exterior siding · Signs of peeling paint and weathering indicate significant damage. | Major | $15,000–50,000 |
| Landscaping · Minimal landscaping and snow accumulation suggest a lack of maintenance. | Major | $15,000–50,000 |
| Interior walls/paint · Some touch-ups may be needed to improve appearance. | Minor | $500–3,000 |
| Bathrooms · Updates to fixtures and finishes could enhance value. | Minor | $500–3,000 |
| HVAC/mechanicals · Inspection may be needed to ensure efficiency and functionality. | Minor | $500–3,000 |
| Exterior lighting · Adding exterior lighting could improve safety and curb appeal. | Minor | $500–3,000 |
| Total estimated repair cost · 6 items | $32,000–112,000 |
Value-add ROI direction
- Both Painting exterior siding — Fresh paint can improve curb appeal and home value. ↑
- Both Landscaping and snow removal — A well-maintained yard can enhance both resale and rental value. ↑
- Both Updating bathroom fixtures and finishes — Modern fixtures and finishes can attract more buyers and renters. ↑
- Both HVAC inspection and maintenance — A functional HVAC system can improve comfort and energy efficiency, attracting more buyers and renters. ↑
- Both Interior paint touch-ups — Fresh paint can improve the overall appearance and attract more buyers and renters. ↑
ⓘ Cost ranges are severity-bucket heuristics (US national rule-of-thumb). Get contractor quotes + a written scope before underwriting a rehab budget.
Schools (NCES district)
- District
- Orange Board Of Education School District
- NCES district ID
- 3412270
- Math proficiency
- 10% ▼ -18.00%
- Reading proficiency
- 32% ▼ -7.00%
- Median HH income
- $37,178
- Composite
- 17.43/100
- National rank
- #9065
- State rank
- #432 of 472 in NJ
Livability — East Orange
- Score
- 73/100
- State rank
- #189
- US rank
- #5261
Category grades
Schools grade is shown separately in the Schools card above.
Census & demographics
- County
- Essex County · 825,405 people
- City population
- 69,834
- Metro
- New York-Newark-Jersey City, NY-NJ-PA
- Population (ZIP)
- 34,181
- Household income
- $52,563
- Rent vs Own
- Severe rent burden
- 2703.0
Population outlook (Essex County) Hauer SSP2
- Today (2025)
- 825,042 people
- By 2030
- 834,010 · +1.1%
- By 2040
- 846,221 · +2.6%
- By 2050
- 850,047 · +3.0%
- By 2075
- 837,009 · +1.5%
- By 2100
- 784,345 · -4.9%
Race, ethnicity, and origin ACS 2023
- Neighborhood character
- Diverse neighborhood (Simpson 0.58)
- Race & ethnicity
- Black 58% Hispanic / Latino 30% Two or more races 12% White 5% Asian 2%
- Hispanic origin (detail)
- Mexican 2% Puerto Rican 4% Dominican 4%
- Common ancestry
- Hispanic 13%
- Foreign-born
- 41% · Canada, Guatemala
- Languages at home
- 54% English-only · Spanish 26% French/Haitian/Cajun 13% Tagalog/Filipino 1%
Political lean MEDSL · Essex
- 2024 margin
- Solid D (+44.9) · D 71.7% · R 26.8% · Other 1.5%
- 2008→2024 swing
- -7.7pp toward R · 2008: 52.6pp · 2024: 44.9pp
- All cycles
- 2024: D+44.9 2020: D+55.4 2016: D+56.4 2012: D+55.5 2008: D+52.6
Not yet ingested
- Civics
- —
Market trends
- HPI YoY
- ▼ -147.97%
- Current HPI
- 296.7883
- Rent YoY
- ▲ 4.64%
- Metro
- New York-Newark-Jersey City, NY-NJ-PA
- State GDP YoY
- ▲ 2.05%
- F500 in state
- 34
Industry mix (Fortune 500 HQ in NJ)
| Industry | F500 HQs | Revenue |
|---|---|---|
| Consumer Goods | 3 | $31B |
|
||
| Pharmaceuticals | 2 | $153B |
|
||
| Technology | 2 | $21B |
|
||
| Insurance | 2 | $20B |
|
||
| Healthcare | 2 | $19B |
|
||
| Financial Services | 1 | $70B |
|
||
Price history
1 event — show timeline
- 2026-06-01 Listed $499,999 GSMLS
Cash-flow waterfall
monthlySold comps — $/sqft
last 12 mo · ≤1 miLoading sold comps…