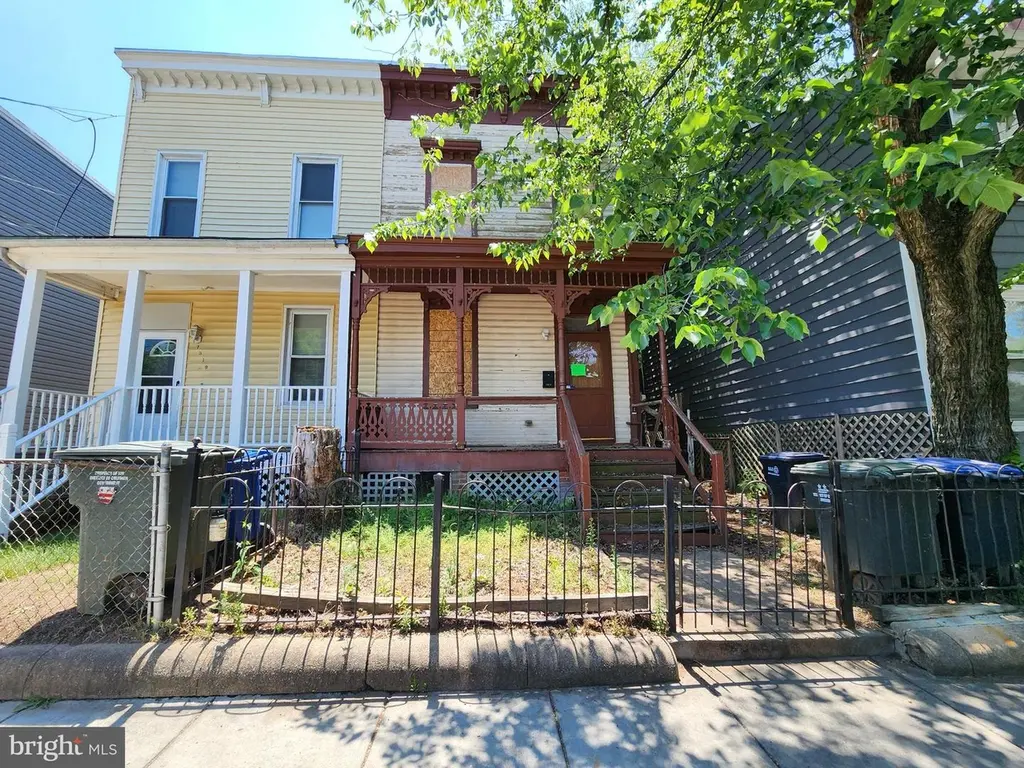
1317 U St SE · Washington, DC
Flood risk 1/10 · Minimal
- FEMA flood zone
- X (unshaded)
- Chance of flooding over 30 yrs
- 0.0%
- Est. flood insurance / yr
- $507 – $1,088
Fire risk 1/10 · Minimal
- Est. fire insurance / yr
- $631 – $1,173
Heat risk 8/10 · Major
- Hot days now (above 104°F)
- 7 days/yr
- Hot days in 30 yrs
- 15 days/yr
Wind risk 4/10 · Minor
- Chance of severe wind over 30 yrs
- 17.0%
Air-quality risk 4/10 · Minor
- Unhealthy air days now
- 4 days/yr
- Unhealthy air days in 30 yrs
- 5 days/yr
Risk factors via First Street. Map © Google.
Why this score? — see what drove the B grade
The composite is a weighted blend of 9 inputs, each scored 0–100. Each bar is that input's sub-score; the figure is the points it added to the 100-point composite (weight × sub-score).
- Cash flow +30.0/30.0
- 1% rule +10.0/10.0
- DSCR +10.0/10.0
- ARV discount +7.5/15.0
- Livability +3.7/5.0
- Schools +3.6/10.0
- Rent growth +3.5/5.0
- Condition / age +2.5/5.0
- Appreciation +0.0/10.0
$165,000
🖨 Deal sheet 📄 Offer letter ✓ Due diligence
Listing remarks
ONLINE AUCTION: This auction takes place on the Ashland Auction Group Website Bidding Platform. Bidding begins 6/19/2026 @ 10:00 AM. Bidding ends 6/23/2026 @ 12:50 PM. List Price is Suggested Opening Bid. Deposit: $30,000. Semi-Detached Victorian located in the Anacostia area of Southeast Washington, DC. The property is believed to be arranged as 3 bedrooms and 1 bathroom and is currently vacant. Improvements are believed to contain approximately 1,896± square feet of above-grade living area situated on a 2,925± square foot lot. JUST MINUTES to the Anacostia Metro Station, Navy Yard, Capitol Hill, downtown Washington, DC, and the Anacostia Arts District. Convenient access to I
Key facts
- Access to i-295
- Built 1905
- Listed 23 days
Tags
Property features AI
Finance
- Financial info: Ownership is fee simple
Exterior
- Parking: On-street parking
- Utilities: Public water; Public sewer
- Home design: Semi-detached property; Above-grade finished living area of 1,716 (assessor)
- Construction: Wood siding; Other foundation; Other above- and below-grade structures; Year built (source: Assessor)
- Exterior features: Tidal water not present
Interior
- Bedrooms: 3 bedrooms on main level
- Bathrooms: 1 full bathroom on main level
- Heating & cooling: Hot water heating
- Interior features: No basement
Neighborhood map
What this means for you Summary
Snapshot
- This is a 4-bed/1.5-bath townhouse listed at $165k.
Deal economics
- At list price, monthly cash flow is $2k ($21k/yr) — positive.
- The deal already cash-flows at list — no discount required.
- Meets the 1% rule at list price ($4k rent vs $165k).
- Recommended offer: $163k (1.5% below list) — sets the bar for market timing.
- Cap rate 18.8% vs local median 2.5% in Washington — top-decile yield for the area; either an underpriced asset or a hidden risk that comps aren't pricing in. Stress-test before assuming the spread holds.
Location & tenants
- Location reads 73/100 on livability (#1 in DC) — a middle-class / working-renter tenant base. Strengths: amenities A+, commute A+, employment A+; Watch: crime F, cost of living F.
- District Of Columbia Public Schools (urban): math 33% / reading 40% proficiency, ranked #8 of 32 in DC (top 25%) — families likely to look elsewhere, expect single-tenant / working-renter base with shorter leases; 65% free/reduced lunch — lower-income household profile, screen leases tightly.
- Market conditions: Rents rising (+3.9%/yr); 296 active listings in the ZIP; 40 comparable units currently listed for rent nearby; rentals at typical pace (median 25d on market — plan ~3-4 weeks tenant-placement turnaround); 1,737 units permitted in District of Columbia in 2024 (1,506 in 5+ unit buildings).
- At $3,617/mo this rent would consume 80% of the median local household income ($54k/yr) (locally 5148% of renters already pay >50% of income on rent) — very limited rent-growth headroom before tenants either downsize or default.
Forward outlook
- Local home prices are declining (-3.0%/yr); year-one equity from $1k of loan paydown is wiped out by about $5k of value loss. Plan a longer hold.
- District of Columbia County population projected at +50% by 2050 — long-run rental-demand tailwind backs the buy-and-hold thesis.
- At projected returns (-3.0% appreciation + 3.9% rent growth), your $46k cash investment doubles in ~3 years — after that, you're playing with house money.
Negotiation context
- It's been on market 23 days — a 2% lower offer ($163k) is reasonable based on typical stale-listing flexibility.
- 8 sale attempts since 2y ago with the ask held roughly flat each time — persistent listings suggest the price (not the market) is what's stuck; bring a comps-based counter.
Risks & watch-outs
- Watch-outs: built in 1905 — expect roof / HVAC / electrical / plumbing capex.
- Climate carrying-cost: extreme-heat days projected 7→15/yr by 2055 (HVAC capex compounding) — expect insurance premiums to compound above CPI over the hold.
Questions for the listing agent
- Built in 1905 — when were the roof, HVAC, electrical panel, plumbing, and water heater last replaced?
- Is there a deadline driving the sale (1031 exchange, divorce, estate, relocation)? That informs how much negotiation room exists.
- Crime grade is F in this area — have there been break-ins, vandalism, or insurance claims at this property in the last 3 years? What carrier currently insures it and at what premium?
- What's the average days-on-market for RENTAL listings here right now (not sales)? A rising rental-DOM trend means longer vacancies and softer asking-rent achievability than the comps imply.
- What's the recent tenant-quality profile in this submarket — average credit score on applications, eviction rate, late-payment / NSF rate, and stable-employment percentage? A property-management company in the area should have these aggregated.
- How much new for-sale + rental construction is in the pipeline within 1–3 miles? Heavy new supply typically softens prices + rents 12–24 months out; constrained supply supports both.
Investment metrics
- 1% rule
- 2.19% ✓
- Cap rate
- 18.78%
- Cash-on-cash
- 44.61%
- DSCR
- 2.98
- GRM
- 3.8
CMA / ARV
- ARV (on-the-fly)
- $530,880
- Comps found
- 12
Show comp detail 12 sales within ~0.75 mi
| Address | Dist | Beds/Ba | Sqft | Sold | Price | $/sf | Match |
|---|---|---|---|---|---|---|---|
| 1349 Ridge Pl SE | 0.20mi | 3/2.0 (-1) | 1,728 (-9%) | 1mo | $399,900 | $231 | 68 |
| 1621 T St SE #8 | 0.29mi | 4/2.0 | 1,724 (-9%) | 1mo | $483,000 | $280 | 68 |
| 1624 Q St SE | 0.45mi | 4/2.0 | 1,791 (-6%) | 1mo | $200,000 | $112 | 67 |
| 1325 Valley Pl SE | 0.21mi | 4/2.0 | 2,138 (+13%) | 5mo | $395,000 | $185 | 63 |
| 2443 Shannon Pl SE | 0.49mi | 3/3.5 (-1) | 1,879 (-1%) | 2mo | $530,000 | $282 | 61 |
| 1028 Howard Rd SE | 0.51mi | 3/3.5 (-1) | 1,879 (-1%) | 1mo | $595,000 | $317 | 60 |
| 1416 S St SE | 0.21mi | 4/3.5 | 2,136 (+13%) | 6mo | $582,000 | $272 | 56 |
| 1401 18th Pl SE | 0.64mi | 4/2.5 | 1,728 (-9%) | 3mo | $475,000 | $275 | 49 |
| 1420 18th Pl SE | 0.66mi | 3/1.0 (-1) | 1,758 (-7%) | 2mo | $190,000 | $108 | 48 |
| 2451 Shannon Pl SE | 0.50mi | 3/3.5 (-1) | 1,666 (-12%) | 1mo | $550,000 | $330 | 42 |
| 1026 Howard Rd SE | 0.51mi | 3/3.5 (-1) | 1,660 (-12%) | 2mo | $595,000 | $358 | 40 |
| 1024 Howard Rd SE | 0.51mi | 3/3.5 (-1) | 1,660 (-12%) | 5mo | $595,000 | $358 | 38 |
Match score weights: distance 35% · size 25% · config 20% · recency 20%. Top-matched comps best support the ARV.
Projected returns pro-forma
-3.0% appreciation · 3.86% rent growth · sell at horizon
- IRR
- 42.6%
- Equity multiple
- 2.86×
- Total profit
- $85,862
- Equity at exit
- $24,602
- IRR
- 49.1%
- Equity multiple
- 5.96×
- Total profit
- $229,025
- Equity at exit
- $14,266
Cash invested: $46,200 (down + closing). Projections, not guarantees.
Landlord ↔ Tenant lean methodology
- Overall (CITY)
- 0 Strongly Tenant-Friendly
- State District of Columbia
- 12 Strongly Tenant-Friendly · D+43
- County
- — inherits STATE
- City Washington
- 0 Strongly Tenant-Friendly · D+43
ZIP-level market 20020
- Rents YoY
- 3.9%
- Active inventory
- 296
- Price-to-rent
- 3.8×
Monthly cashflow live
- Estimated rent
- $3,617 high interval (Pro) →
- Mortgage (P&I)
- −$865
- Tax est. 1.5%
- −$206 /mo · $2,475/yr
- Insurance
- −$69
- HOA
- −$0
- Vacancy / Maint / Mgmt
- −$760
- Net cashflow
- $1,717
Break-even live
UW: 25.0% down · 7.5% · 30yr · 1.5% tax · 5.0% vac · 8.0% maint · 8.0% mgmt
Financing live
Cash to close
- Down payment
- $41,250
- Closing costs
- $4,950
- Reserves months
- —
- Total cash needed
- —
Loan-product check · same deal, 3 products live
Conventional
25% down · 7.5% · 30yr
- Down + closing
- —
- Monthly P&I
- —
- Monthly cashflow
- —
- DSCR
- —
- Eligible?
- —
Personal DTI + credit; lowest rate.
DSCR
20% down · 8.5% · 30yr
- Down + closing
- —
- Monthly P&I
- —
- Monthly cashflow
- —
- DSCR
- —
- Eligible?
- —
No personal income docs; deal must DSCR.
Hard money
10% down · 12.0% · 12mo
- Down + closing
- —
- Monthly P&I
- —
- Monthly cashflow
- —
- DSCR
- —
- Eligible?
- —
Short-term bridge; refi at stabilization.
Rent comps 40 comps
| Address | Beds | Baths | Sqft | Rent | $/sqft | DOM | Units | Dist |
|---|---|---|---|---|---|---|---|---|
| 1214 U St SE Washington, DC | 3.0 | 2.5 | 1350 | $3,375 | $2.50 | 24d | 1 | 0.09mi |
| 1430 V St SE Washington, DC | 3.0 | 2.0 | 1680 | $3,100 | $1.85 | 24d | 1 | 0.15mi |
| 1802 14th St SE Washington, DC | 3.0 | 2.0 | 1800 | $2,800 | $1.56 | 24d | 1 | 0.18mi |
| 1325 Valley Pl SE Washington, DC | 4.0 | 2.0 | 2138 | $6,500 | $3.04 | 24d | 1 | 0.21mi |
| 1505 West St SE Unit 1 Washington, DC | 3.0 | 2.5 | 2100 | $3,300 | $1.57 | 2d | 1 | 0.24mi |
| 1919 16th St SE Washington, DC | 3.0 | 1.5 | 1920 | $2,100 | $1.09 | 24d | 1 | 0.25mi |
| 1328 Morris Rd SE Washington, DC | 3.0 | 2.5 | 1372 | $3,250 | $2.37 | 18d | 1 | 0.31mi |
| 1351 Morris Rd SE Unit Upstairs Washington, DC | 3.0 | 2.0 | 1522 | $2,700 | $1.77 | 4d | 1 | 0.34mi |
| 2322 Shannon Pl SE Washington, DC | 3.0 | 3.5 | 1800 | $2,800 | $1.56 | 24d | 1 | 0.35mi |
| 1308 Talbert Ct SE Washington, DC | 3.0 | 2.5 | 1446 | $2,995 | $2.07 | 5d | 1 | 0.36mi |
| 1634 Ridge Pl SE Washington, DC | 3.0 | 3.5 | 1248 | $3,200 | $2.56 | 24d | 1 | 0.38mi |
| 1705 W St SE Washington, DC | 4.0 | 2.0 | 1550 | $2,500 | $1.61 | 3d | 1 | 0.43mi |
| 1433 Howard Rd SE Washington, DC | 5.0 | 3.5 | 2000 | $7,500 | $3.75 | 19d | 1 | 0.50mi |
| 1527 Morris Rd SE Washington, DC | 3.0 | 2.5 | 1508 | $2,700 | $1.79 | 8d | 1 | 0.56mi |
| 1516 18th St SE Washington, DC | 3.0 | 2.0 | 1941 | $3,200 | $1.65 | 24d | 1 | 0.58mi |
| 1938 S St SE Washington, DC | 3.0 | 2.0 | 1522 | $2,999 | $1.97 | 24d | 1 | 0.63mi |
| 650 Howard Rd SE Washington, DC | 3.0 | 1.0–2.0 | 852 | $4,431 | $5.20 | 2d | 53 | 0.69mi |
| 1633 Morris Rd SE Washington, DC | 5.0 | 2.0 | 1500 | $6,600 | $4.40 | 24d | 2 | 0.70mi |
| 2412 18th St SE Washington, DC | 5.0 | 2.0 | 1584 | $3,500 | $2.21 | 24d | 1 | 0.77mi |
| 2412 18th St SE Washington, DC | 5.0 | 2.0 | 1584 | $3,300 | $2.08 | 24d | 1 | 0.77mi |
| 2460 James Bank Rd SE Washington, DC | 3.0 | 3.5 | 1687 | $3,190 | $1.89 | 15d | 1 | 0.77mi |
| 2003 Fairlawn Ave SE Washington, DC | 4.0 | 2.0 | 1500 | $5,800 | $3.87 | 3d | 1 | 0.77mi |
| 2390 Elvans Rd SE Washington, DC | 3.0 | 2.5 | 2176 | $3,190 | $1.47 | 8d | 1 | 0.80mi |
| 1722 Gainesville St SE Washington, DC | 4.0 | 2.5 | 2000 | $3,490 | $1.75 | 24d | 1 | 0.83mi |
| 1815 Frankford St SE Washington, DC | 5.0 | 3.5 | 1572 | $6,100 | $3.88 | 24d | 1 | 0.84mi |
| 1122 K St SE Washington, DC | 3.0 | 2.5 | 1540 | $4,000 | $2.60 | 24d | 1 | 0.89mi |
| 2320 Minnesota Ave SE Washington, DC | 3.0 | 3.5 | 2052 | $3,150 | $1.54 | 24d | 1 | 0.91mi |
| 821 Kentucky Ave SE Washington, DC | 4.0 | 2.5 | 1520 | $3,900 | $2.57 | 3d | 1 | 0.98mi |
| 816 Kentucky Ave SE Washington, DC | 4.0 | 3.0 | 1800 | $4,850 | $2.69 | 3d | 1 | 0.99mi |
| 742 7th St SE Unit B Washington, DC | 3.0 | 1.5 | 1727 | $3,258 | $1.89 | 24d | 1 | 1.08mi |
| 1016 G St SE Washington, DC | 3.0 | 2.5 | 2277 | $6,000 | $2.64 | 24d | 1 | 1.10mi |
| 1339 E St SE Washington, DC | 3.0 | 1.0–3.0 | 1006 | $5,409 | $5.37 | 2d | 14 | 1.14mi |
| 907 4th St SE Washington, DC | 4.0 | 3.0 | 1500 | $4,999 | $3.33 | 24d | 1 | 1.17mi |
| 1350 E St SE Washington, DC | 3.0 | 1.0–3.5 | 1082 | $6,264 | $5.79 | 2d | 25 | 1.17mi |
| 3010 V Pl SE Washington, DC | 4.0 | 3.0 | 2232 | $3,500 | $1.57 | 24d | 1 | 1.23mi |
| 1851 Tubman Rd SE Washington, DC | 3.0 | 2.0 | 1689 | $3,200 | $1.89 | 24d | 1 | 1.24mi |
| 1900 Half St SW Washington, DC | 3.0 | 1.0–2.0 | 862 | $5,325 | $6.18 | 2d | 51 | 1.26mi |
| 401 11th St SE Washington, DC | 4.0 | 4.5 | 1832 | $7,000 | $3.82 | 19d | 1 | 1.26mi |
| 1805 Potomac Ave SE Washington, DC | 3.0 | 1.5 | 1598 | $4,000 | $2.50 | 24d | 1 | 1.27mi |
| 1205 Half St SE Washington, DC | 1.0–3.0 | 1.0–3.0 | 1058 | $5,922 | $5.59 | 1d | 31 | 1.29mi |
Listing history 32 events
-
2026-06-18days on market $165,000 Active 23 DOM
-
2026-06-17days on market $165,000 Active 22 DOM
-
2026-06-16days on market $165,000 Active 21 DOM
-
2026-06-15days on market $165,000 Active 20 DOM
-
2026-06-13days on market $165,000 Active 18 DOM
-
2026-06-09days on market $165,000 Active 14 DOM
-
2026-06-08days on market $165,000 Active 13 DOM
-
2026-06-07days on market $165,000 Active 12 DOM
-
2026-06-04days on market $165,000 Active 9 DOM
-
2026-06-03days on market $165,000 Active 8 DOM
-
2026-06-02days on market $165,000 Active 7 DOM
-
2026-06-01days on market $165,000 Active 6 DOM
-
2026-05-31days on market $165,000 Active 5 DOM
-
2026-05-26$165,000 Active
-
2025-12-12historical
-
2025-07-14historical Active Under Contract
-
2025-06-26status Active
-
2025-06-15historical Active Under Contract
-
2025-06-02$249,000 Active
-
2025-05-31historical
-
2025-05-13status Active
-
2025-04-13historical Active Under Contract
-
2025-04-09price $249,900
-
2025-04-04status Active
-
2025-03-06historical
-
2025-01-03$299,000 Active
-
2024-12-31historical
-
2024-11-29price $299,000
-
2024-11-08price $340,000
-
2024-11-08status Active
-
2024-10-31historical
-
2024-10-11$399,000 Active
ⓘ Source: listings_history table (triggers on properties + properties_extension) + one-shot
backfill from property_details.listing_events for pre-trigger history.
Climate risk First Street
- Flood 1/10 Low FEMA zone X (unshaded) · 0% chance over 30 yrs
- Wildfire 1/10 Low
- Heat 8/10 Severe 7 d/yr ≥104°F today · 15 d/yr by 30 yrs out
- Wind 4/10 Moderate 17% chance of damaging wind over 30 yrs
- Air quality 4/10 Moderate 4 unhealthy d/yr today · 5 by 30 yrs out
Nearby sold comps map
Loading sold comps map…
Walkable amenities ~0.75 mi
Loading nearby amenities…
Taxation est. · year 1
- Rental income
- $43,409
- − Mortgage interest
- −$9,243
- − Property taxes
- −$2,475
- − Insurance
- −$825
- − Repairs & maintenance
- −$3,473
- − Management
- −$3,473
- − Depreciation
- −$4,800
- Taxable income
- $19,121
- Est. tax owed @ 24.0%
- −$4,589
- After-tax cash flow
- $16,021/yr
For passive investors: Depreciation is non-cash, so a rental often shows a tax loss while cash-flowing — sheltering income. Rental losses are passive: they offset passive income freely, and up to $25,000/yr can offset ordinary (W-2) income if you actively participate and your MAGI is under $100k (phasing out to $0 by $150k); unused losses carry forward. On sale, claimed depreciation is recaptured at up to 25%, and gains may owe capital-gains tax (a 1031 exchange can defer both). Figures are a year-1 estimate at your 24.0% rate — not tax advice; consult a CPA.
Schools (NCES district)
- District
- District Of Columbia Public Schools
- NCES district ID
- 1100030
- Math proficiency
- 33% ▲ 3.00%
- Reading proficiency
- 40% ▲ 5.00%
- Median HH income
- $67,671
- Composite
- 35.84/100
- National rank
- #9606
- State rank
- #8 of 32 in DC
Livability — Washington
- Score
- 73/100
- State rank
- #1
- US rank
- #5327
Category grades
Schools grade is shown separately in the Schools card above.
Census & demographics
- Census place
- Washington, DC
- County
- District of Columbia · 671,873 people
- City population
- 671,873
- Metro
- Washington-Arlington-Alexandria, DC-VA-MD-WV
- Population (ZIP)
- 53,005
- Household income
- $54,032
- Rent vs Own
- Severe rent burden
- 5148.0
Population outlook (District of Columbia County) Hauer SSP2
- Today (2025)
- 821,926 people
- By 2030
- 899,517 · +9.4%
- By 2040
- 1,061,162 · +29.1%
- By 2050
- 1,231,493 · +49.8%
- By 2075
- 1,603,312 · +95.1%
- By 2100
- 1,847,141 · +124.7%
Race, ethnicity, and origin ACS 2023
- Neighborhood character
- Predominantly Black (90%)
- Race & ethnicity
- Black 90% Two or more races 3% Hispanic / Latino 3% White 3%
- Common ancestry
- Lithuanian 1%
- Foreign-born
- 3% · Canada
- Languages at home
- 95% English-only · Spanish 2% French/Haitian/Cajun 1%
Political lean MEDSL · District of Columbia
- 2024 margin
- Solid D (+86.1) · D 91.2% · R 5.1% · Other 3.8%
- 2008→2024 swing
- +0.1pp no change · 2008: 85.9pp · 2024: 86.1pp
- All cycles
- 2024: D+86.1 2020: D+86.8 2016: D+88.7 2012: D+84.2 2008: D+85.9
Not yet ingested
- Civics
- —
Market trends
- HPI YoY
- ▼ -415.44%
- Current HPI
- 306.5068
- Rent YoY
- ▲ 3.86%
- Metro
- Washington-Arlington-Alexandria, DC-VA-MD-WV
- State GDP YoY
- ▲ 1.33%
- F500 in state
- 6
Industry mix (Fortune 500 HQ in DC)
| Industry | F500 HQs | Revenue |
|---|---|---|
| Financial Services | 1 | $153B |
|
||
| Life Sciences / Industrials | 1 | $25B |
|
||
| Industrial Machinery | 1 | $8B |
|
||
Price history
-58.6% since first listed19 events — show timeline
- 2026-05-26 Listed $165,000 BRIGHT MLS
- 2025-12-12 Listing Removed — BRIGHT MLS
- 2025-07-14 Contingent — BRIGHT MLS
- 2025-06-26 Relisted — BRIGHT MLS
- 2025-06-15 Contingent — BRIGHT MLS
- 2025-06-02 Listed $249,000 BRIGHT MLS
- 2025-05-31 Listing Removed — BRIGHT MLS
- 2025-05-13 Relisted — BRIGHT MLS
- 2025-04-13 Contingent — BRIGHT MLS
- 2025-04-09 Price Changed $249,900 BRIGHT MLS
- 2025-04-04 Relisted — BRIGHT MLS
- 2025-03-06 Listing Removed — BRIGHT MLS
- 2025-01-03 Listed $299,000 BRIGHT MLS
- 2024-12-31 Listing Removed — BRIGHT MLS
- 2024-11-29 Price Changed $299,000 BRIGHT MLS
- 2024-11-08 Price Changed $340,000 BRIGHT MLS
- 2024-11-08 Relisted — BRIGHT MLS
- 2024-10-31 Listing Removed — BRIGHT MLS
- 2024-10-11 Listed $399,000 BRIGHT MLS
Property tax history
+20.4%/yrLatest (2025): $11,704 · +486.1% YoY. Source: county tax records.
Cash-flow waterfall
monthlySold comps — $/sqft
last 12 mo · ≤1 miLoading sold comps…