 Duplex
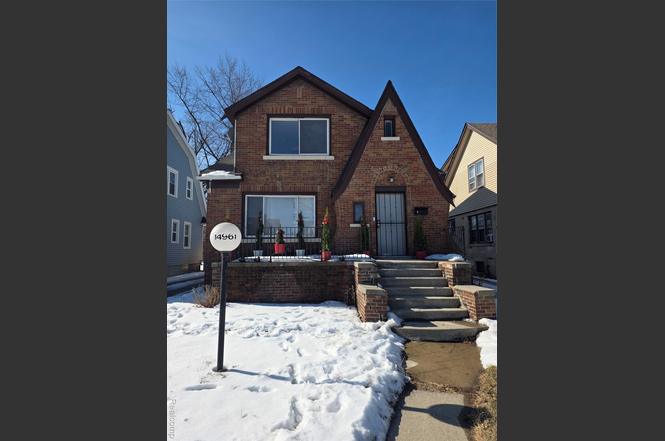
14961 Strathmoor St · Detroit, MI
Flood risk 1/10 · Minimal
- FEMA flood zone
- X (unshaded)
- Chance of flooding over 30 yrs
- 0.0%
- Est. flood insurance / yr
- $473 – $860
Fire risk 1/10 · Minimal
- Est. fire insurance / yr
- $784 – $1,456
Heat risk 3/10 · Minor
- Hot days now (above 98°F)
- 7 days/yr
- Hot days in 30 yrs
- 15 days/yr
Wind risk 2/10 · Minimal
- Chance of severe wind over 30 yrs
- —
Air-quality risk 3/10 · Minor
- Unhealthy air days now
- 2 days/yr
- Unhealthy air days in 30 yrs
- 5 days/yr
Risk factors via First Street. Map © Google.
Why this score? — see what drove the B grade
The composite is a weighted blend of 9 inputs, each scored 0–100. Each bar is that input's sub-score; the figure is the points it added to the 100-point composite (weight × sub-score).
- Cash flow +30.0/30.0
- 1% rule +10.0/10.0
- DSCR +10.0/10.0
- Appreciation +5.0/10.0
- ARV discount +4.8/15.0
- Condition / age +4.0/5.0
- Livability +3.7/5.0
- Rent growth +2.5/5.0
- Schools +1.3/10.0
$110,000
🖨 Deal sheet 📄 Offer letter ✓ Due diligence
Multi-family units
County records classify this as Multi-Family (2-4 Unit). Listing-text estimate: 2 units. confirmed
Listing remarks
Beautiful polychrome brick tudor style duplex! Lower unit currently paying $900 but will be out prior to closing. Upper unit currently for rent and may have a screened and qualified tenant placed soon for $850. Each unit is 2 bedrooms and tenant is responsible for gas and electric. Building was previously renovated with lots of updates in the units, newer vinyl windows, newer roof, restored rear privacy fence. Buyer to pay 495 compliance to list office. Clear title with warranty deed and title insurance.
Key facts
- 4,791 sq ft lot
- Built 1929
- Listed 49 days
Property features AI
Finance
- Other: Residential zoning
- Financial info: Two-unit building; Net operating income: $18,000; Property is currently leased
Exterior
- Utilities: Public water; Natural gas; Forced air heating
- Home design: Multi-family property; 2-story Tudor; Built in 1929; City location (Detroit)
- Construction: Brick construction; Basement foundation (block)
- Exterior features: Brick exterior; Porch; Paved street access
Interior
- Bathrooms: 2 full bathrooms
- Heating & cooling: Forced air heating; Natural gas fuel
- Interior features: Tudor-style interior details; Porch
- Laundry & utility: Basement utility area (block foundation)
Neighborhood map
What this means for you Summary
Snapshot
- This is a 2 × 2-bed/2.0-bath units multifamily listed at $110k. Condition is rated good.
Deal economics
- At list price, monthly cash flow is $1k ($13k/yr) — positive. Per door: $554/mo.
- The deal already cash-flows at list — no discount required.
- Meets the 1% rule at list price ($2k rent vs $110k).
- Recommended offer: $107k (3.0% below list) — sets the bar for market timing.
- Cap rate 18.4% vs local median 10.2% in Detroit — top-decile yield for the area; either an underpriced asset or a hidden risk that comps aren't pricing in. Stress-test before assuming the spread holds.
Location & tenants
- Location reads 73/100 on livability (#218 in MI) — a middle-class / working-renter tenant base. Strengths: amenities A+, commute A+, cost of living A+; Watch: schools F, crime F, employment F.
- Detroit Public Schools Community District (urban): math 10% / reading 24% proficiency, ranked #499 of 540 in MI (top 92%) — low school quality limits family demand, transient renter base, plan for 1-2y turnover; 90% free/reduced lunch — lower-income household profile, screen leases tightly.
- Market conditions: 1 active listings in the ZIP; 14 comparable units currently listed for rent nearby; rentals at typical pace (median 22d on market — plan ~3-4 weeks tenant-placement turnaround); 2,639 units permitted in Wayne County in 2024 (1,216 in 5+ unit buildings).
Forward outlook
- In year one you build about $4k of equity ($761 loan paydown + $3k appreciation (3.0% local appreciation)).
- Wayne County population projected at -17% by 2050 — secular population decline; favor cash flow + early exit over multi-decade hold.
- At projected returns (3.0% appreciation + 3.0% rent growth), your $31k cash investment doubles in ~2 years — after that, you're playing with house money.
- By year 8, paydown + projected appreciation supports a ~$30k cash-out refi (75% LTV) — recoverable capital for the next deal without selling this one.
Negotiation context
- It's been on market 49 days — a 3% lower offer ($107k) is reasonable based on typical stale-listing flexibility.
- 2 sale attempts; this cycle's ask has dropped $10k (8%) from the opening price — seller is motivated, your offer sets the floor, not the list.
Risks & watch-outs
- Watch-outs: built in 1929 — expect roof / HVAC / electrical / plumbing capex.
Questions for the listing agent
- It's been on market 49 days. Have you received any prior offers? Is the seller open to a 3% concession, seller financing, or rate buy-down credit?
- Can we see the unit-by-unit rent roll, current vacancy, and any below-market leases? What's the average tenancy length?
- What capital expenditures (roof, boiler, parking lot, exteriors) have been made in the last 5 years, and what's planned in the next 2?
- Built in 1929 — when were the roof, HVAC, electrical panel, plumbing, and water heater last replaced?
- Is there a deadline driving the sale (1031 exchange, divorce, estate, relocation)? That informs how much negotiation room exists.
- Schools are F-rated, which usually means shorter tenancies and higher turnover. Who's the typical renter profile here, and what's been the actual vacancy rate?
- Crime grade is F in this area — have there been break-ins, vandalism, or insurance claims at this property in the last 3 years? What carrier currently insures it and at what premium?
- What's the average days-on-market for RENTAL listings here right now (not sales)? A rising rental-DOM trend means longer vacancies and softer asking-rent achievability than the comps imply.
- What's the recent tenant-quality profile in this submarket — average credit score on applications, eviction rate, late-payment / NSF rate, and stable-employment percentage? A property-management company in the area should have these aggregated.
- How much new apartment / multifamily construction is in the pipeline within 1–3 miles? Heavy new supply (>2% of stock underway) typically softens rents 12–24 months out; light construction supports rent growth.
Investment metrics
- 1% rule
- 2.15% ✓
- Cap rate
- 18.37%
- Cash-on-cash
- 43.14%
- DSCR
- 2.92
- GRM
- 3.9
CMA / ARV
- ARV (on-the-fly)
- $103,683
- Comps found
- 12
Show comp detail 12 sales within ~0.75 mi
| Address | Dist | Beds/Ba | Sqft | Sold | Price | $/sf | Match |
|---|---|---|---|---|---|---|---|
| 14961 Strathmoor St | 0.00mi | 4/2.0 | 1,819 (0%) | 1mo | $110,000 | $60 | 91 |
| 14951 Strathmoor St | 0.01mi | 4/2.0 | 1,824 (+0%) | 7mo | $148,000 | $81 | 86 |
| 15780 Stansbury St | 0.62mi | 4/2.0 | 1,824 (+0%) | 1mo | $23,500 | $13 | 62 |
| 14270 Strathmoor St | 0.50mi | 4/2.0 | 1,849 (+2%) | 13mo | $70,000 | $38 | 55 |
| 15041 Cruse St | 0.24mi | 4/2.0 | 1,614 (-11%) | 10mo | $113,000 | $70 | 54 |
| 15443 Whitcomb St | 0.56mi | 4/2.5 | 1,944 (+7%) | 7mo | $82,000 | $42 | 51 |
| 15064 Sussex St | 0.35mi | 3/2.0 | 1,642 (-10%) | 12mo | $93,000 | $57 | 49 |
| 13980 Mark Twain St | 0.72mi | 3/2.0 | 1,771 (-3%) | 16mo | $41,000 | $23 | 41 |
| 15461 Prest St | 0.61mi | 3/2.0 | 1,698 (-7%) | 17mo | $63,500 | $37 | 38 |
| 15710 Snowden St | 0.73mi | 4/2.0 | 1,617 (-11%) | 6mo | $100,000 | $62 | 34 |
| 14868 Forrer St | 0.68mi | 4/3.0 | 2,047 (+12%) | 14mo | $152,000 | $74 | 32 |
| 14375 Coyle St | 0.52mi | 4/2.0 | 2,086 (+15%) | 19mo | $97,200 | $47 | 27 |
Match score weights: distance 35% · size 25% · config 20% · recency 20%. Top-matched comps best support the ARV.
Projected returns pro-forma
3.0% appreciation · 3.0% rent growth · sell at horizon
- IRR
- 48.5%
- Equity multiple
- 3.72×
- Total profit
- $83,816
- Equity at exit
- $49,461
- IRR
- 48.2%
- Equity multiple
- 7.48×
- Total profit
- $199,599
- Equity at exit
- $76,225
Cash invested: $30,800 (down + closing). Projections, not guarantees.
Landlord ↔ Tenant lean methodology
- Overall (STATE)
- 62 Landlord-Friendly
- State Michigan
- 62 Landlord-Friendly · EVEN
- County
- — inherits STATE
- City
- — inherits STATE
ZIP-level market 48227 2974
- Active inventory
- 1
- Price-to-rent
- 7.8×
Monthly cashflow live
- Estimated rent
- $2,364 high interval (Pro) →
- Mortgage (P&I)
- −$577
- Tax est. 1.5%
- −$138 /mo · $1,650/yr
- Insurance
- −$46
- HOA
- −$0
- Vacancy / Maint / Mgmt
- −$496
- Net cashflow
- $1,107
Break-even live
2-unit breakdown (identical units grouped — click to expand)
| Units | Beds | Baths | Est. rent |
|---|---|---|---|
| 2× units | 2 | 2 | $2,364 |
| #1 | 2 | 2 | $1,182 |
| #2 | 2 | 2 | $1,182 |
| Total (2 units) | $2,364 | ||
UW: 25.0% down · 7.5% · 30yr · 1.5% tax · 5.0% vac · 8.0% maint · 8.0% mgmt
Financing live
Cash to close
- Down payment
- $27,500
- Closing costs
- $3,300
- Reserves months
- —
- Total cash needed
- —
Loan-product check · same deal, 3 products live
Conventional
25% down · 7.5% · 30yr
- Down + closing
- —
- Monthly P&I
- —
- Monthly cashflow
- —
- DSCR
- —
- Eligible?
- —
Personal DTI + credit; lowest rate.
DSCR
20% down · 8.5% · 30yr
- Down + closing
- —
- Monthly P&I
- —
- Monthly cashflow
- —
- DSCR
- —
- Eligible?
- —
No personal income docs; deal must DSCR.
Hard money
10% down · 12.0% · 12mo
- Down + closing
- —
- Monthly P&I
- —
- Monthly cashflow
- —
- DSCR
- —
- Eligible?
- —
Short-term bridge; refi at stabilization.
Rent comps 14 comps
| Address | Beds | Baths | Sqft | Rent | $/sqft | DOM | Units | Dist |
|---|---|---|---|---|---|---|---|---|
| 14375 Terry St Detroit, MI | 3.0 | 2.0 | 1300 | $1,425 | $1.10 | 43d | 1 | 0.43mi |
| 15762 Mark Twain St Detroit, MI | 3.0 | 2.0 | 1430 | $1,250 | $0.87 | 16d | 1 | 0.55mi |
| 15088 Littlefield St Detroit, MI | 2.0 | 1.0 | 1294 | $1,275 | $0.99 | 22d | 1 | 0.65mi |
| 14104 Coyle St Detroit, MI | 3.0 | 1.0 | 1327 | $1,350 | $1.02 | 5d | 1 | 0.70mi |
| 14580 Forrer St Unit Unit Detroit, MI | 2.0 | 1.0 | 1300 | $900 | $0.69 | 20d | 1 | 0.72mi |
| 16151 Robson St Detroit, MI | 3.0 | 1.0 | 1300 | $1,525 | $1.17 | 15d | 1 | 0.79mi |
| 16505 Stansbury St Detroit, MI | 3.0 | 1.0 | 1700 | $1,345 | $0.79 | 43d | 1 | 0.92mi |
| 13279 Coyle St Detroit, MI | 3.0 | 1.0 | 1444 | $1,373 | $0.95 | 43d | 1 | 1.01mi |
| 14800 Woodmont Ave Detroit, MI | 3.0 | 2.0 | 1612 | $1,525 | $0.95 | 15d | 1 | 1.06mi |
| 14510 Asbury Park Detroit, MI | 2.0 | 1.0 | 1771 | $1,250 | $0.71 | 43d | 1 | 1.06mi |
| 15866 Mansfield St Detroit, MI | 3.0 | 1.0 | 1324 | $1,425 | $1.08 | 24d | 1 | 1.07mi |
| 16230 Cheyenne St Detroit, MI | 3.0 | 1.0 | 1653 | $1,450 | $0.88 | 43d | 1 | 1.08mi |
| 12778 Strathmoor St Detroit, MI | 3.0 | 1.0 | 1597 | $1,150 | $0.72 | 5d | 1 | 1.13mi |
| 15708 Birwood St Detroit, MI | 3.0 | 1.0 | 1255 | $1,100 | $0.88 | 5d | 1 | 1.33mi |
Listing history 5 events
-
2026-04-24status Pending
-
2026-04-03price $110,000
-
2026-03-16status Active
-
2026-03-10status Pending
-
2026-02-27$120,000 Active
ⓘ Source: listings_history table (triggers on properties + properties_extension) + one-shot
backfill from property_details.listing_events for pre-trigger history.
Climate risk First Street
- Flood 1/10 Low FEMA zone X (unshaded) · 0% chance over 30 yrs
- Wildfire 1/10 Low
- Heat 3/10 Moderate 7 d/yr ≥98°F today · 15 d/yr by 30 yrs out
- Wind 2/10 Low
- Air quality 3/10 Moderate 2 unhealthy d/yr today · 5 by 30 yrs out
Nearby sold comps map
Loading sold comps map…
Walkable amenities ~0.75 mi
Loading nearby amenities…
Taxation est. · year 1
- Rental income
- $28,368
- − Mortgage interest
- −$6,162
- − Property taxes
- −$1,650
- − Insurance
- −$550
- − Repairs & maintenance
- −$2,269
- − Management
- −$2,269
- − Depreciation
- −$3,200
- Taxable income
- $12,267
- Est. tax owed @ 24.0%
- −$2,944
- After-tax cash flow
- $10,344/yr
For passive investors: Depreciation is non-cash, so a rental often shows a tax loss while cash-flowing — sheltering income. Rental losses are passive: they offset passive income freely, and up to $25,000/yr can offset ordinary (W-2) income if you actively participate and your MAGI is under $100k (phasing out to $0 by $150k); unused losses carry forward. On sale, claimed depreciation is recaptured at up to 25%, and gains may owe capital-gains tax (a 1031 exchange can defer both). Figures are a year-1 estimate at your 24.0% rate — not tax advice; consult a CPA.
Condition & rehab AI · 2 photos
This multi-family property is in good condition with recent renovations, including a new roof and vinyl windows. It offers a good investment opportunity with potential for further value enhancement through exterior painting and landscaping.
Value-add opportunities
- Both Painting the exterior brick — Enhances curb appeal and can increase both resale and rental value
- Both Landscaping improvements — Enhances curb appeal and can increase both resale and rental value
Renovation cost estimate screening
Value-add ROI direction
- Both Painting the exterior brick — Enhances curb appeal and can increase both resale and rental value ↑
- Both Landscaping improvements — Enhances curb appeal and can increase both resale and rental value ↑
ⓘ Cost ranges are severity-bucket heuristics (US national rule-of-thumb). Get contractor quotes + a written scope before underwriting a rehab budget.
Schools (NCES district)
- District
- Detroit Public Schools Community District
- NCES district ID
- 2601103
- Math proficiency
- 10% ▼ -2.00%
- Reading proficiency
- 24% ▲ 6.00%
- Median HH income
- $25,815
- Composite
- 13.06/100
- National rank
- #9564
- State rank
- #499 of 540 in MI
Livability — Detroit
- Score
- 73/100
- State rank
- #218
- US rank
- #5427
Category grades
Schools grade is shown separately in the Schools card above.
Census & demographics
- Census place
- Detroit, MI
Population outlook (Wayne County) Hauer SSP2
- Today (2025)
- 1,675,273 people
- By 2030
- 1,620,300 · -3.3%
- By 2040
- 1,502,341 · -10.3%
- By 2050
- 1,384,039 · -17.4%
- By 2075
- 1,124,592 · -32.9%
- By 2100
- 881,193 · -47.4%
Not yet ingested
- Political lean
- —
- Race & ethnicity
- —
- Common origin
- —
- Civics
- —
Market trends
- HPI YoY
- —
- Current HPI
- —
- Rent YoY
- —
- Metro
- —
- State GDP YoY
- ▲ 1.37%
- F500 in state
- 28
Industry mix (Fortune 500 HQ in MI)
| Industry | F500 HQs | Revenue |
|---|---|---|
| Automotive Parts | 3 | $48B |
|
||
| Automotive | 2 | $372B |
|
||
| Chemicals | 1 | $45B |
|
||
| Automotive Retail | 1 | $29B |
|
||
| Healthcare / Medical Devices | 1 | $23B |
|
||
| Automotive Technology | 1 | $20B |
|
||
Price history
-8.3% since first listed5 events — show timeline
- 2026-04-24 Pending — MiRealSource-MiMLS
- 2026-04-03 Price Changed $110,000 MiRealSource-MiMLS
- 2026-03-16 Relisted — MiRealSource-MiMLS
- 2026-03-10 Pending — MiRealSource-MiMLS
- 2026-02-27 Listed $120,000 MiRealSource-MiMLS
Cash-flow waterfall
monthlySold comps — $/sqft
last 12 mo · ≤1 miLoading sold comps…