3442 Us Highway 43 · Killen, AL
Flood risk 5/10 · Moderate
- FEMA flood zone
- X (unshaded)
- Chance of flooding over 30 yrs
- 0.24%
- Est. flood insurance / yr
- $507 – $1,088
Fire risk 4/10 · Minor
- Est. fire insurance / yr
- $916 – $1,700
Heat risk 5/10 · Moderate
- Hot days now (above 106°F)
- 7 days/yr
- Hot days in 30 yrs
- 19 days/yr
Wind risk 4/10 · Minor
- Chance of severe wind over 30 yrs
- 19.0%
Air-quality risk 2/10 · Minimal
- Unhealthy air days now
- 1 days/yr
- Unhealthy air days in 30 yrs
- 2 days/yr
Risk factors via First Street. Map © Google.
Why this score? — see what drove the B- grade
The composite is a weighted blend of 9 inputs, each scored 0–100. Each bar is that input's sub-score; the figure is the points it added to the 100-point composite (weight × sub-score).
- Cash flow +30.0/30.0
- DSCR +10.0/10.0
- 1% rule +9.1/10.0
- ARV discount +7.5/15.0
- Livability +3.5/5.0
- Schools +2.8/10.0
- Rent growth +2.5/5.0
- Condition / age +2.5/5.0
- Appreciation +0.0/10.0
$94,900
🖨 Deal sheet 📄 Offer letter ✓ Due diligence
Listing remarks
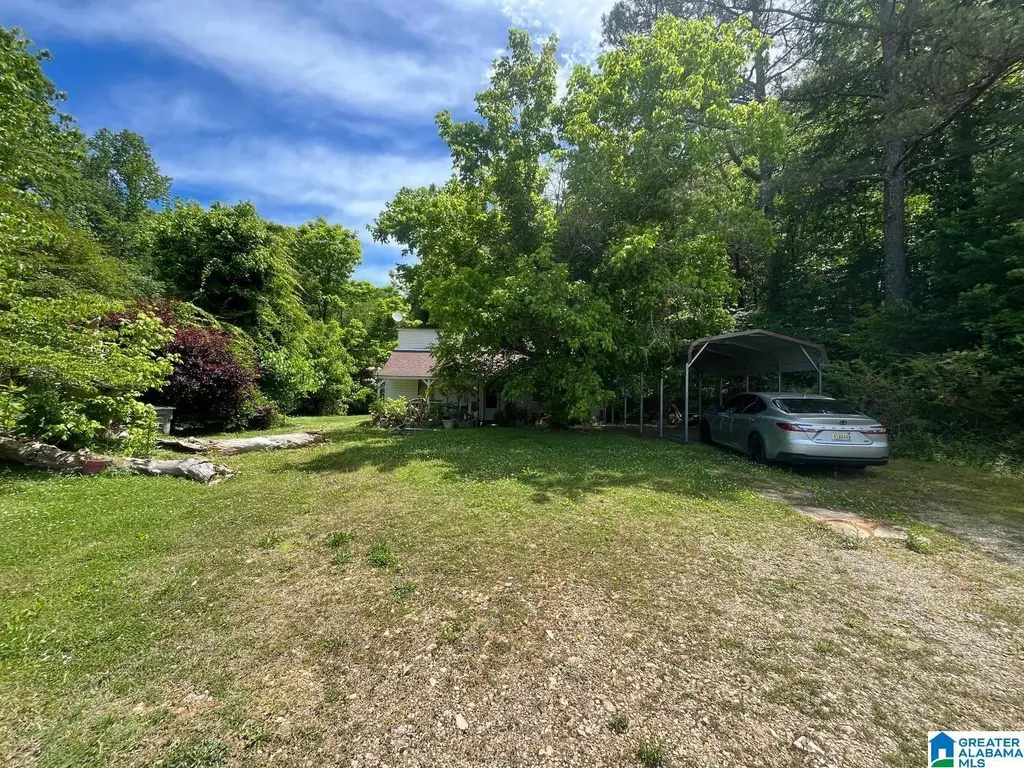
Welcome to this charming 3-bedroom, 2-bath home situated on a spacious 1-acre lot, offering the perfect blend of comfort, updates, and outdoor space. With 1,412 square feet of living space, this property has seen several major improvements in recent years, making it move-in ready and easy to maintain. Recent updates include a new roof in 2019, a carport added in 2020, updated electrical in 2021, and energy-efficient mini split systems installed in 2022 for added comfort year-round. The large lot provides plenty of room to enjoy the outdoors, entertain guests, or create your own private retreat. Whether you are looking for a peaceful place to call home or a property with room to grow, this o
Key facts
- Updated electrical
- Carport
- Spacious lot
Tags
Property features AI
Finance
- Other: Lot size: 1 acre
- HOA & community: No homeowners association
Exterior
- Parking: Driveway parking
- Utilities: Public water; Septic system; Electric water heater; Underground utilities; Internet availability unknown
- Home design: Existing construction; Tri-level layout (living area across main and upper levels)
- Construction: Vinyl siding; Slab foundation
- Exterior features: Front porch; No deck, patio, pool, or garden listed; Property not waterfront
Interior
- Kitchen: Solid surface countertops; Breakfast bar; Refrigerator; Electric stove
- Bedrooms: Bedroom on main level; Bedroom on main level; Bedroom on upper level
- Flooring: Carpet; Tile; Vinyl
- Bathrooms: Two full bathrooms; Baths include tub/shower combo
- Heating & cooling: No central heating listed; Window air conditioning units
- Interior features: Tri-level: No; Split level: No; Split foyer: No; Loft: No; Ceilings: Other (see remarks); Fireplace in living room with woodburning insert; No additional listed interior features
- Laundry & utility: Main-level laundry room; Washer hookup; Electric dryer hookup
Neighborhood map
What this means for you Summary
Snapshot
- This is a 5-bed/2.0-bath single-family listed at $95k.
Deal economics
- At list price, monthly cash flow is $496 ($6k/yr) — positive.
- The deal already cash-flows at list — no discount required.
- Meets the 1% rule at list price ($1k rent vs $95k).
- Recommended offer: $93k (1.5% below list) — sets the bar for market timing.
- Cap rate 12.6% vs local median 1.5% in Killen — top-decile yield for the area; either an underpriced asset or a hidden risk that comps aren't pricing in. Stress-test before assuming the spread holds.
Location & tenants
- Location reads 69/100 on livability (#49 in AL) — a middle-class / working-renter tenant base. Strengths: crime A+, cost of living A+, housing A+; Watch: amenities F, commute F, health & safety D-.
- Lauderdale County (rural): math 19% / reading 46% proficiency, ranked #53 of 129 in AL (top 41%) — families likely to look elsewhere, expect single-tenant / working-renter base with shorter leases.
- Zoned schools: Brooks Elementary School (math 26% / reading 60%, grade F, #204 of 627 statewide, top 33%, 903 students, 48% FRL); Brooks High School (math 13% / reading 45%, grade F, #84 of 305 statewide, top 28%, 755 students, 48% FRL).
- Market conditions: 224 active listings in the ZIP; solid renter incomes; 164 units permitted in Lauderdale County in 2024 (72 in 5+ unit buildings).
Forward outlook
- Local home prices are declining (-3.0%/yr); year-one equity from $656 of loan paydown is wiped out by about $3k of value loss. Plan a longer hold.
- At projected returns (-3.0% appreciation + 3.0% rent growth), your $27k cash investment doubles in ~6 years — after that, you're playing with house money.
Negotiation context
- It's been on market 30 days — a 2% lower offer ($93k) is reasonable based on typical stale-listing flexibility.
- 4 sale attempts since 3y ago; this cycle's ask has dropped $24k (20%) from the opening price — seller is motivated, your offer sets the floor, not the list.
Risks & watch-outs
- Watch-outs: built in 1953 — expect roof / HVAC / electrical / plumbing capex.
- Climate carrying-cost: moderate flood risk; extreme-heat days projected 7→19/yr by 2055 (HVAC capex compounding) — expect insurance premiums to compound above CPI over the hold.
Questions for the listing agent
- Built in 1953 — when were the roof, HVAC, electrical panel, plumbing, and water heater last replaced?
- Is there a deadline driving the sale (1031 exchange, divorce, estate, relocation)? That informs how much negotiation room exists.
- What's the average days-on-market for RENTAL listings here right now (not sales)? A rising rental-DOM trend means longer vacancies and softer asking-rent achievability than the comps imply.
- What's the recent tenant-quality profile in this submarket — average credit score on applications, eviction rate, late-payment / NSF rate, and stable-employment percentage? A property-management company in the area should have these aggregated.
- How much new for-sale + rental construction is in the pipeline within 1–3 miles? Heavy new supply typically softens prices + rents 12–24 months out; constrained supply supports both.
Investment metrics
- 1% rule
- 1.41% ✓
- Cap rate
- 12.56%
- Cash-on-cash
- 22.38%
- DSCR
- 2.00
- GRM
- 5.9
CMA / ARV
No comps found within radius.
Projected returns pro-forma
-3.0% appreciation · 3.0% rent growth · sell at horizon
- IRR
- 15.2%
- Equity multiple
- 1.61×
- Total profit
- $16,154
- Equity at exit
- $14,150
- IRR
- 23.8%
- Equity multiple
- 3.05×
- Total profit
- $54,564
- Equity at exit
- $8,205
Cash invested: $26,572 (down + closing). Projections, not guarantees.
Landlord ↔ Tenant lean methodology
- Overall (STATE)
- 90 Strongly Landlord-Friendly
- State Alabama
- 90 Strongly Landlord-Friendly · R+15
- County
- — inherits STATE
- City
- — inherits STATE
ZIP-level market 35645
- Home prices YoY
- -12.9%
- Active inventory
- 224
- Price-to-rent
- 5.9×
Monthly cashflow live
- Estimated rent
- $1,338 medium interval (Pro) →
- Mortgage (P&I)
- −$498
- Tax from tax record
- −$24 /mo · $290/yr
- Insurance
- −$40
- HOA
- −$0
- Vacancy / Maint / Mgmt
- −$281
- Net cashflow
- $496
Break-even live
UW: 25.0% down · 7.5% · 30yr · 1.5% tax · 5.0% vac · 8.0% maint · 8.0% mgmt
Financing live
Cash to close
- Down payment
- $23,725
- Closing costs
- $2,847
- Reserves months
- —
- Total cash needed
- —
Loan-product check · same deal, 3 products live
Conventional
25% down · 7.5% · 30yr
- Down + closing
- —
- Monthly P&I
- —
- Monthly cashflow
- —
- DSCR
- —
- Eligible?
- —
Personal DTI + credit; lowest rate.
DSCR
20% down · 8.5% · 30yr
- Down + closing
- —
- Monthly P&I
- —
- Monthly cashflow
- —
- DSCR
- —
- Eligible?
- —
No personal income docs; deal must DSCR.
Hard money
10% down · 12.0% · 12mo
- Down + closing
- —
- Monthly P&I
- —
- Monthly cashflow
- —
- DSCR
- —
- Eligible?
- —
Short-term bridge; refi at stabilization.
Listing history 26 events
-
2026-06-19days on market $94,900 Active 30 DOM
-
2026-06-18days on market $94,900 Active 29 DOM
-
2026-06-17price $94,900 Active 28 DOM
-
2026-06-17days on market $99,900 Active 28 DOM
-
2026-06-16days on market $99,900 Active 27 DOM
-
2026-06-15days on market $99,900 Active 26 DOM
-
2026-06-14days on market $99,900 Active 24 DOM
-
2026-06-13pricedays on market $99,900 Active 23 DOM
-
2026-06-10days on market $119,000 Active 21 DOM
-
2026-06-09days on market $119,000 Active 20 DOM
-
2026-06-08days on market $119,000 Active 19 DOM
-
2026-06-07days on market $119,000 Active 18 DOM
-
2026-06-05days on market $119,000 Active 15 DOM
-
2026-06-03days on market $119,000 Active 14 DOM
-
2026-06-02days on market $119,000 Active 13 DOM
-
2026-06-01days on market $119,000 Active 12 DOM
-
2026-05-31days on market $119,000 Active 11 DOM
-
2026-05-30days on market $119,000 Active 10 DOM
-
2026-05-19$119,000 Active
-
2025-06-22price $135,000
-
2025-04-17$149,900 Active
-
2024-08-31$159,900 Active
-
2024-06-01price $159,900
-
2024-02-28price $162,000
-
2023-10-26price $164,000
-
2023-09-15$165,000 Active
ⓘ Source: listings_history table (triggers on properties + properties_extension) + one-shot
backfill from property_details.listing_events for pre-trigger history.
Tax reassessment forecast AL · Resets to sale price
- Current annual tax
- $290 · $24/mo
- Projected year-2 tax
- $389 · $32/mo
- Expected delta
- +$99/yr (+$8/mo · 34.2%)
ⓘ Screening estimate from a state-policy table — verify with the county assessor before closing.
Climate risk First Street
- Flood 5/10 Major FEMA zone X (unshaded) · 24% chance over 30 yrs
- Wildfire 4/10 Moderate
- Heat 5/10 Major 7 d/yr ≥106°F today · 19 d/yr by 30 yrs out
- Wind 4/10 Moderate 19% chance of damaging wind over 30 yrs
- Air quality 2/10 Low 1 unhealthy d/yr today · 2 by 30 yrs out
Nearby sold comps map
Loading sold comps map…
Walkable amenities ~0.75 mi
Loading nearby amenities…
Taxation est. · year 1
- Rental income
- $16,056
- − Mortgage interest
- −$5,316
- − Property taxes
- −$290
- − Insurance
- −$474
- − Repairs & maintenance
- −$1,285
- − Management
- −$1,285
- − Depreciation
- −$2,761
- Taxable income
- $4,646
- Est. tax owed @ 24.0%
- −$1,115
- After-tax cash flow
- $4,833/yr
For passive investors: Depreciation is non-cash, so a rental often shows a tax loss while cash-flowing — sheltering income. Rental losses are passive: they offset passive income freely, and up to $25,000/yr can offset ordinary (W-2) income if you actively participate and your MAGI is under $100k (phasing out to $0 by $150k); unused losses carry forward. On sale, claimed depreciation is recaptured at up to 25%, and gains may owe capital-gains tax (a 1031 exchange can defer both). Figures are a year-1 estimate at your 24.0% rate — not tax advice; consult a CPA.
Schools (NCES district)
- District
- Lauderdale County
- NCES district ID
- 0102010
- Math proficiency
- 19% ▼ -35.00%
- Reading proficiency
- 46% ▼ -7.00%
- Median HH income
- $47,501
- Composite
- 27.93/100
- National rank
- #6863
- State rank
- #53 of 129 in AL
Livability — Killen
- Score
- 69/100
- State rank
- #49
- US rank
- #8235
Category grades
Schools grade is shown separately in the Schools card above.
Census & demographics
- County
- Lauderdale County · 47,988 people
- City population
- 13,960
- Metro
- Florence-Muscle Shoals, AL
- Population (ZIP)
- 13,960
- Household income
- $87,958
- Rent vs Own
- Severe rent burden
- 83.0
Population outlook (Lauderdale County) Hauer SSP2
- Today (2025)
- 93,386 people
- By 2030
- 93,634 · +0.3%
- By 2040
- 93,114 · -0.3%
- By 2050
- 91,586 · -1.9%
- By 2075
- 88,667 · -5.1%
- By 2100
- 81,098 · -13.2%
Race, ethnicity, and origin ACS 2023
- Neighborhood character
- Predominantly White (91%)
- Race & ethnicity
- White 91% Two or more races 5% Black 3% Hispanic / Latino 3%
- Common ancestry
- Slovak 3% Serbian 3% Italian 2%
- Foreign-born
- 3% · Canada
- Languages at home
- 97% English-only · Spanish 2%
Political lean MEDSL · Lauderdale
- 2024 margin
- Solid R (+51.5) · D 23.8% · R 75.3%
- 2008→2024 swing
- -23.3pp toward R · 2008: -28.2pp · 2024: -51.5pp
- All cycles
- 2024: R+51.5 2020: R+44.7 2016: R+46.0 2012: R+30.9 2008: R+28.2
Not yet ingested
- Civics
- —
Market trends
- HPI YoY
- ▼ -28.61%
- Current HPI
- 193.3443
- Rent YoY
- —
- Metro
- Florence-Muscle Shoals, AL
- State GDP YoY
- ▲ 2.94%
- F500 in state
- 4
Industry mix (Fortune 500 HQ in AL)
| Industry | F500 HQs | Revenue |
|---|---|---|
| Financial Services | 1 | $8B |
|
||
| Healthcare | 1 | $5B |
|
||
Price history
-27.9% since first listed8 events — show timeline
- 2026-05-19 Listed $119,000 Greater Alabama MLS
- 2025-06-22 Price Changed $135,000 SAARMLS
- 2025-04-17 Listed $149,900 SAARMLS
- 2024-08-31 Listed $159,900 SAARMLS
- 2024-06-01 Price Changed $159,900 SAARMLS
- 2024-02-28 Price Changed $162,000 SAARMLS
- 2023-10-26 Price Changed $164,000 SAARMLS
- 2023-09-15 Listed $165,000 SAARMLS
Property tax history
+7.1%/yrLatest (2025): $290 · +3.8% YoY. Source: county tax records.
Cash-flow waterfall
monthlySold comps — $/sqft
last 12 mo · ≤1 miLoading sold comps…