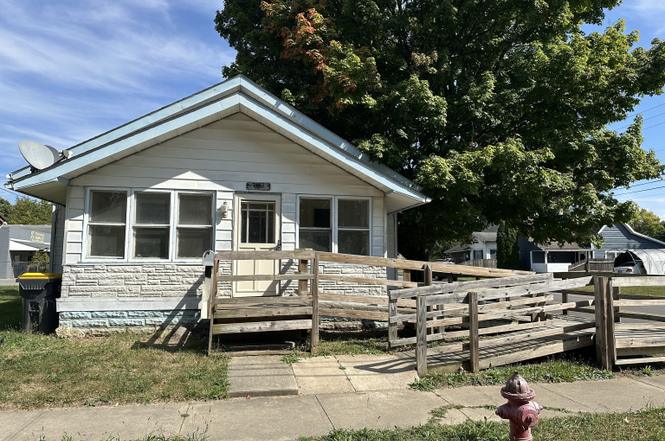
1830 Jefferson St · Anderson, IN
Flood risk 1/10 · Minimal
- FEMA flood zone
- X (unshaded)
- Chance of flooding over 30 yrs
- 0.0%
- Est. flood insurance / yr
- $473 – $860
Fire risk 1/10 · Minimal
- Est. fire insurance / yr
- $717 – $1,331
Heat risk 3/10 · Minor
- Hot days now (above 100°F)
- 7 days/yr
- Hot days in 30 yrs
- 18 days/yr
Wind risk 2/10 · Minimal
- Chance of severe wind over 30 yrs
- 0.0%
Air-quality risk 3/10 · Minor
- Unhealthy air days now
- 2 days/yr
- Unhealthy air days in 30 yrs
- 3 days/yr
Risk factors via First Street. Map © Google.
Why this score? — see what drove the B grade
The composite is a weighted blend of 9 inputs, each scored 0–100. Each bar is that input's sub-score; the figure is the points it added to the 100-point composite (weight × sub-score).
- Cash flow +30.0/30.0
- ARV discount +12.8/15.0
- DSCR +10.0/10.0
- 1% rule +9.8/10.0
- Rent growth +4.5/5.0
- Livability +3.0/5.0
- Condition / age +2.5/5.0
- Schools +1.6/10.0
- Appreciation +0.0/10.0
$55,000
🖨 Deal sheet 📄 Offer letter ✓ Due diligence
Listing remarks MLS
BANK OWNED FORECLOSURE PROPERTY. NEEDS REPAIRS & COSMETICS. SOLD 'AS-IS'. SELLER WILL MAKE NO REPAIRS. MORTGAGE PRE QUALIFICATION OR PROOF OF FUNDS TO BE PROVIDED WITH OFFER.
Key facts
- Corner lot
- Mature trees
- Enclosed front porch
Tags
Neighborhood map
What this means for you Summary
Snapshot
- This is a 1-bed/1.0-bath single-family listed at $55k.
Deal economics
- At list price, monthly cash flow is $269 ($3k/yr) — positive.
- The deal already cash-flows at list — no discount required.
- Meets the 1% rule at list price ($812 rent vs $55k).
- Recommended offer: $48k (12.0% below list) — sets the bar for market timing.
- Cap rate 12.2% vs local median 6.5% in Anderson — top-decile yield for the area; either an underpriced asset or a hidden risk that comps aren't pricing in. Stress-test before assuming the spread holds.
Location & tenants
- Location reads 60/100 on livability (#521 in IN) — a middle-class / working-renter tenant base. Strengths: cost of living A+, housing A+; Watch: schools F, crime D-, amenities F.
- Anderson Community School Corporation (urban): math 15% / reading 23% proficiency, ranked #280 of 301 in IN (top 93%) — low school quality limits family demand, transient renter base, plan for 1-2y turnover; 70% free/reduced lunch — lower-income household profile, screen leases tightly.
- Market conditions: Rents rising fast (+7.9%/yr); 185 active listings in the ZIP; 40 comparable units currently listed for rent nearby; rentals lingering (median 44d on market — plan ~5-8 weeks vacancy on turnover, expect pricing pressure); 55% of comp listings sitting > 30 days — soft ceiling on asking rent; lower-income renter base — watch delinquency; 184 units permitted in Madison County in 2024 (0 in 5+ unit buildings).
Forward outlook
- Local home prices are declining (-3.0%/yr); year-one equity from $380 of loan paydown is wiped out by about $2k of value loss. Plan a longer hold.
- Madison County population projected at -14% by 2050 — secular population decline; favor cash flow + early exit over multi-decade hold.
- At projected returns (-3.0% appreciation + 7.9% rent growth), your $15k cash investment doubles in ~5 years — after that, you're playing with house money.
Negotiation context
- It's been on market 201 days — a 12% lower offer ($48k) is reasonable based on typical stale-listing flexibility.
- 5 sale attempts since 23y ago; this cycle's ask has dropped $10k (15%) from the opening price — seller is motivated, your offer sets the floor, not the list.
- Current owner paid $21k; list at $55k implies a 162% gain — meaningful room to come down on a strong offer.
Risks & watch-outs
- Watch-outs: built in 1905 — expect roof / HVAC / electrical / plumbing capex.
Questions for the listing agent
- It's been on market 201 days. Have you received any prior offers? Is the seller open to a 12% concession, seller financing, or rate buy-down credit?
- Built in 1905 — when were the roof, HVAC, electrical panel, plumbing, and water heater last replaced?
- Why hasn't it sold? Are there any deal-killer items the seller is aware of (foundation, flood, title, zoning, code violations)?
- Is there a deadline driving the sale (1031 exchange, divorce, estate, relocation)? That informs how much negotiation room exists.
- Schools are F-rated, which usually means shorter tenancies and higher turnover. Who's the typical renter profile here, and what's been the actual vacancy rate?
- Crime grade is D in this area — have there been break-ins, vandalism, or insurance claims at this property in the last 3 years? What carrier currently insures it and at what premium?
- What's the average days-on-market for RENTAL listings here right now (not sales)? A rising rental-DOM trend means longer vacancies and softer asking-rent achievability than the comps imply.
- What's the recent tenant-quality profile in this submarket — average credit score on applications, eviction rate, late-payment / NSF rate, and stable-employment percentage? A property-management company in the area should have these aggregated.
- How much new for-sale + rental construction is in the pipeline within 1–3 miles? Heavy new supply typically softens prices + rents 12–24 months out; constrained supply supports both.
Investment metrics
- 1% rule
- 1.48% ✓
- Cap rate
- 12.17%
- Cash-on-cash
- 20.98%
- DSCR
- 1.93
- GRM
- 5.6
CMA / ARV
- ARV (on-the-fly)
- $62,400
- Comps found
- 4
Show comp detail 4 sales within ~0.75 mi
| Address | Dist | Beds/Ba | Sqft | Sold | Price | $/sf | Match |
|---|---|---|---|---|---|---|---|
| 1718 Cincinnati Ave | 0.24mi | 2/1.0 (+1) | 898 (+8%) | 4mo | $115,000 | $128 | 68 |
| 2006 Central Ave | 0.34mi | 1/0.5 | 768 (-8%) | 11mo | $15,000 | $20 | 60 |
| 1221 E 22nd St | 0.40mi | 2/1.0 (+1) | 864 (+4%) | 12mo | $65,000 | $75 | 60 |
| 2639 Central Ave | 0.69mi | 2/1.0 (+1) | 952 (+14%) | 8mo | $57,000 | $60 | 32 |
Match score weights: distance 35% · size 25% · config 20% · recency 20%. Top-matched comps best support the ARV.
Projected returns pro-forma
-3.0% appreciation · 7.88% rent growth · sell at horizon
- IRR
- 18.7%
- Equity multiple
- 1.81×
- Total profit
- $12,420
- Equity at exit
- $8,201
- IRR
- 30.3%
- Equity multiple
- 4.37×
- Total profit
- $51,901
- Equity at exit
- $4,755
Cash invested: $15,400 (down + closing). Projections, not guarantees.
Landlord ↔ Tenant lean methodology
- Overall (STATE)
- 90 Strongly Landlord-Friendly
- State Indiana
- 90 Strongly Landlord-Friendly · R+11
- County
- — inherits STATE
- City
- — inherits STATE
ZIP-level market 46016
- Home prices YoY
- -3.5%
- Rents YoY
- 7.9%
- Active inventory
- 185
- Price-to-rent
- 5.6×
Monthly cashflow live
- Estimated rent
- $812 high interval (Pro) →
- Mortgage (P&I)
- −$288
- Tax from tax record
- −$61 /mo · $727/yr
- Insurance
- −$23
- HOA
- −$0
- Vacancy / Maint / Mgmt
- −$170
- Net cashflow
- $269
Break-even live
UW: 25.0% down · 7.5% · 30yr · 1.5% tax · 5.0% vac · 8.0% maint · 8.0% mgmt
Financing live
Cash to close
- Down payment
- $13,750
- Closing costs
- $1,650
- Reserves months
- —
- Total cash needed
- —
Loan-product check · same deal, 3 products live
Conventional
25% down · 7.5% · 30yr
- Down + closing
- —
- Monthly P&I
- —
- Monthly cashflow
- —
- DSCR
- —
- Eligible?
- —
Personal DTI + credit; lowest rate.
DSCR
20% down · 8.5% · 30yr
- Down + closing
- —
- Monthly P&I
- —
- Monthly cashflow
- —
- DSCR
- —
- Eligible?
- —
No personal income docs; deal must DSCR.
Hard money
10% down · 12.0% · 12mo
- Down + closing
- —
- Monthly P&I
- —
- Monthly cashflow
- —
- DSCR
- —
- Eligible?
- —
Short-term bridge; refi at stabilization.
Rent comps 40 comps
| Address | Beds | Baths | Sqft | Rent | $/sqft | DOM | Units | Dist |
|---|---|---|---|---|---|---|---|---|
| 1710 Jefferson St Apt 2 Anderson, IN | 2.0 | 1.0 | 550 | $950 | $1.73 | 44d | 1 | 0.06mi |
| 2002 Jefferson St Unit 3 Anderson, IN | 1.0 | 2.0 | 725 | $600 | $0.83 | 44d | 1 | 0.10mi |
| 1726-1728 Walnut St Anderson, IN | 2.0 | 2.0 | 900 | $995 | $1.11 | 2d | 1 | 0.14mi |
| 1719 Johnson Ave Anderson, IN | 1.0 | 1.0 | 616 | $824 | $1.34 | 44d | 1 | 0.27mi |
| 702 E 23rd St Anderson, IN | 1.0 | 1.0 | 560 | $595 | $1.06 | 15d | 1 | 0.31mi |
| 2233 E Lynn St Anderson, IN | 1.0 | 1.0 | 700 | $695 | $0.99 | 2d | 1 | 0.36mi |
| 221 E 13th St Anderson, IN | 1.0 | 1.0 | 595 | $995 | $1.67 | 15d | 1 | 0.46mi |
| 414 Wheeler Ave Apt B Anderson, IN | 1.0 | 1.0 | 600 | $650 | $1.08 | 44d | 1 | 0.50mi |
| 1317 Main St Anderson, IN | 2.0 | 1.0 | 750 | $800 | $1.07 | 44d | 1 | 0.55mi |
| 223 E 11th St Anderson, IN | 2.0 | 1.0 | 800 | $900 | $1.12 | 44d | 1 | 0.57mi |
| 917 E 8th St Unit 2 Anderson, IN | 2.0 | 1.0 | 550 | $825 | $1.50 | 8d | 1 | 0.68mi |
| 2625 Main St Anderson, IN | 2.0 | 1.0 | 988 | $895 | $0.91 | 24d | 1 | 0.73mi |
| 1232 E 28th St Anderson, IN | 2.0 | 2.0 | 795 | $950 | $1.19 | 44d | 1 | 0.73mi |
| 2324 Chase St Anderson, IN | 2.0 | 1.0 | 783 | $950 | $1.21 | 44d | 1 | 0.80mi |
| 3006 Noble St Anderson, IN | 2.0 | 1.0 | 1064 | $995 | $0.94 | 8d | 1 | 0.82mi |
| 919 E 6th St Apt 2 Anderson, IN | 1.0 | 1.0 | 700 | $625 | $0.89 | 24d | 1 | 0.83mi |
| 120 W 10th St Anderson, IN | 1.0–3.0 | 1.0 | 1066 | $900 | $0.84 | 2d | 1 | 0.84mi |
| 3000 Fletcher St Unit 3000 Anderson, IN | 2.0 | 1.0 | 800 | $650 | $0.81 | 44d | 1 | 0.86mi |
| 328 E 31st St Anderson, IN | 1.0 | 1.0 | 600 | $750 | $1.25 | 44d | 1 | 0.90mi |
| 1045 Alhambra Dr Unit 6 Anderson, IN | 2.0 | 1.5 | 900 | $975 | $1.08 | 24d | 1 | 0.92mi |
| 602 Meridian St Unit 608 A Anderson, IN | 1.0 | 1.0 | 650 | $750 | $1.15 | 24d | 1 | 0.94mi |
| 602 Meridian St Apt C Anderson, IN | 2.0 | 1.0 | 800 | $900 | $1.12 | 44d | 1 | 0.94mi |
| 1829 E 8th St Anderson, IN | 1.0–3.0 | 1.0 | 810 | $800 | $0.99 | 24d | 9 | 0.95mi |
| 2442 Morton St Anderson, IN | 2.0 | 1.0 | 862 | $1,125 | $1.31 | 24d | 1 | 0.96mi |
| 1501 E 31st St Anderson, IN | 2.0 | 1.0 | 840 | $1,199 | $1.43 | 20d | 1 | 1.01mi |
| 702 W 23rd St Anderson, IN | 1.0 | 1.0 | 560 | $595 | $1.06 | 4d | 1 | 1.04mi |
| 2301 Sheridan St Anderson, IN | 2.0 | 1.0 | 900 | $950 | $1.06 | 44d | 1 | 1.05mi |
| 2904 Lincoln St Anderson, IN | 2.0 | 1.0 | 864 | $900 | $1.04 | 44d | 1 | 1.08mi |
| 915 High St Unit 915 1/2 Anderson, IN | 1.0 | 1.0 | 600 | $650 | $1.08 | 44d | 1 | 1.10mi |
| 2208 Hendricks St Unit 3 Anderson, IN | 1.0 | 1.0 | 585 | $675 | $1.15 | 44d | 1 | 1.12mi |
| 2820 Fairview St Unit A Anderson, IN | 2.0 | 1.0 | 850 | $895 | $1.05 | 44d | 1 | 1.14mi |
| 803 1/2 W 9th St Anderson, IN | 1.0 | 1.0 | 600 | $525 | $0.88 | 44d | 1 | 1.15mi |
| 530 Alhambra Dr Anderson, IN | 1.0–2.0 | 1.0 | 879 | $895 | $1.02 | 44d | 1 | 1.18mi |
| 1502 Cedar St Anderson, IN | 2.0 | 1.0 | 1104 | $850 | $0.77 | 44d | 1 | 1.23mi |
| 2505 E 10th St Anderson, IN | 1.0–2.0 | 1.0 | 850 | $798 | $0.94 | 44d | 2 | 1.29mi |
| 3614 Columbus Ave Anderson, IN | 1.0 | 1.0 | 553 | $725 | $1.31 | 15d | 1 | 1.34mi |
| 2412 E 7th St Anderson, IN | 2.0 | 1.0 | 600 | $895 | $1.49 | 2d | 1 | 1.37mi |
| 519 W 2nd St Anderson, IN | 1.0 | 1.0 | 650 | $800 | $1.23 | 44d | 1 | 1.38mi |
| 925 W 5th St Unit 1 Anderson, IN | 1.0 | 1.0 | 617 | $775 | $1.26 | 16d | 1 | 1.43mi |
| 924 W 5th St Unit 928 Anderson, IN | 1.0 | 1.0 | 600 | $600 | $1.00 | 44d | 1 | 1.44mi |
Listing history 14 events
-
2026-03-24status Pending
-
2026-03-10status Active
-
2026-03-10price $55,000
-
2026-02-12historical
-
2025-12-31price $49,900
-
2025-12-31status Active
-
2025-10-16status Pending
-
2025-09-30price $55,000
-
2025-09-16status Active
-
2025-09-16price $58,500
-
2025-07-09price $55,000
-
2025-05-13$64,900 Active
-
2003-04-30soldstatus $21,000 178-char remark
Show marketing remark (178 chars)
BANK OWNED FORECLOSURE PROPERTY. NEEDS REPAIRS & COSMETICS. SOLD 'AS-IS'. SELLER WILL MAKE NO REPAIRS. MORTGAGE PRE QUALIFICATION OR PROOF OF FUNDS TO BE PROVIDED WITH OFFER.
-
2003-03-05$29,900 178-char remark
Show marketing remark (178 chars)
BANK OWNED FORECLOSURE PROPERTY. NEEDS REPAIRS & COSMETICS. SOLD 'AS-IS'. SELLER WILL MAKE NO REPAIRS. MORTGAGE PRE QUALIFICATION OR PROOF OF FUNDS TO BE PROVIDED WITH OFFER.
ⓘ Source: listings_history table (triggers on properties + properties_extension) + one-shot
backfill from property_details.listing_events for pre-trigger history.
Tax reassessment forecast IN · Partial reset (capped growth)
- Current annual tax
- $727 · $61/mo
- Projected year-2 tax
- $727 · $61/mo
- Expected delta
- $0/yr ($0/mo · 0.0%)
ⓘ Screening estimate from a state-policy table — verify with the county assessor before closing.
Climate risk First Street
- Flood 1/10 Low FEMA zone X (unshaded) · 0% chance over 30 yrs
- Wildfire 1/10 Low
- Heat 3/10 Moderate 7 d/yr ≥100°F today · 18 d/yr by 30 yrs out
- Wind 2/10 Low 0% chance of damaging wind over 30 yrs
- Air quality 3/10 Moderate 2 unhealthy d/yr today · 3 by 30 yrs out
Nearby sold comps map
Loading sold comps map…
Walkable amenities ~0.75 mi
Loading nearby amenities…
Taxation est. · year 1
- Rental income
- $9,738
- − Mortgage interest
- −$3,081
- − Property taxes
- −$727
- − Insurance
- −$275
- − Repairs & maintenance
- −$779
- − Management
- −$779
- − Depreciation
- −$1,600
- Taxable income
- $2,497
- Est. tax owed @ 24.0%
- −$599
- After-tax cash flow
- $2,631/yr
For passive investors: Depreciation is non-cash, so a rental often shows a tax loss while cash-flowing — sheltering income. Rental losses are passive: they offset passive income freely, and up to $25,000/yr can offset ordinary (W-2) income if you actively participate and your MAGI is under $100k (phasing out to $0 by $150k); unused losses carry forward. On sale, claimed depreciation is recaptured at up to 25%, and gains may owe capital-gains tax (a 1031 exchange can defer both). Figures are a year-1 estimate at your 24.0% rate — not tax advice; consult a CPA.
Schools (NCES district)
- District
- Anderson Community School Corporation
- NCES district ID
- 1800150
- Math proficiency
- 15% ▼ -14.00%
- Reading proficiency
- 23% ▼ -7.00%
- Median HH income
- $38,208
- Composite
- 15.93/100
- National rank
- #9250
- State rank
- #280 of 301 in IN
Livability — Anderson
- Score
- 60/100
- State rank
- #521
- US rank
- #18709
Category grades
Schools grade is shown separately in the Schools card above.
Census & demographics
- Census place
- Anderson, IN
- County
- Madison County · 69,445 people
- City population
- 57,762
- Metro
- Indianapolis-Carmel-Anderson, IN
- Population (ZIP)
- 17,834
- Household income
- $36,029
- Rent vs Own
- Severe rent burden
- 1193.0
Population outlook (Madison County) Hauer SSP2
- Today (2025)
- 125,800 people
- By 2030
- 122,640 · -2.5%
- By 2040
- 115,420 · -8.3%
- By 2050
- 108,148 · -14.0%
- By 2075
- 91,838 · -27.0%
- By 2100
- 75,670 · -39.8%
Race, ethnicity, and origin ACS 2023
- Neighborhood character
- Diverse neighborhood (Simpson 0.58)
- Race & ethnicity
- White 61% Black 18% Hispanic / Latino 13% Two or more races 11% Native American 1%
- Hispanic origin (detail)
- Mexican 10% Puerto Rican 1%
- Common ancestry
- Italian 2% Slovak 1% Iranian 1%
- Foreign-born
- 4% · Canada
- Languages at home
- 86% English-only · Spanish 12%
Political lean MEDSL · Madison
- 2024 margin
- Strong R (+26.9) · D 35.6% · R 62.5% · Other 1.9%
- 2008→2024 swing
- -33.5pp toward R · 2008: 6.5pp · 2024: -26.9pp
- All cycles
- 2024: R+26.9 2020: R+22.6 2016: R+25.7 2012: R+4.5 2008: D+6.5
Not yet ingested
- Civics
- —
Market trends
- HPI YoY
- ▼ -11.12%
- Current HPI
- 302.7437
- Rent YoY
- ▲ 7.88%
- Metro
- Indianapolis-Carmel-Anderson, IN
- State GDP YoY
- ▲ 2.90%
- F500 in state
- 18
Industry mix (Fortune 500 HQ in IN)
| Industry | F500 HQs | Revenue |
|---|---|---|
| Industrial Machinery | 2 | $37B |
|
||
| Healthcare | 1 | $177B |
|
||
| Pharmaceuticals | 1 | $45B |
|
||
| Metals / Steel | 1 | $18B |
|
||
| Agriculture | 1 | $17B |
|
||
| Packaging | 1 | $12B |
|
||
Price history
+83.9% since first listed14 events — show timeline
- 2026-03-24 Pending — MIBOR as Distributed by MLS Grid
- 2026-03-10 Relisted — MIBOR as Distributed by MLS Grid
- 2026-03-10 Price Changed $55,000 MIBOR as Distributed by MLS Grid
- 2026-02-12 Listing Removed — MIBOR as Distributed by MLS Grid
- 2025-12-31 Price Changed $49,900 MIBOR as Distributed by MLS Grid
- 2025-12-31 Relisted — MIBOR as Distributed by MLS Grid
- 2025-10-16 Pending — MIBOR as Distributed by MLS Grid
- 2025-09-30 Price Changed $55,000 MIBOR as Distributed by MLS Grid
- 2025-09-16 Relisted — MIBOR as Distributed by MLS Grid
- 2025-09-16 Price Changed $58,500 MIBOR as Distributed by MLS Grid
- 2025-07-09 Price Changed $55,000 MIBOR as Distributed by MLS Grid
- 2025-05-13 Listed $64,900 MIBOR as Distributed by MLS Grid
- 2003-04-30 Sold (MLS) $21,000 MIBOR as Distributed by MLS Grid
- 2003-03-05 Listed $29,900 MIBOR as Distributed by MLS Grid
Property tax history
+3.5%/yrLatest (2024): $727 · +8.3% YoY. Source: county tax records.
Cash-flow waterfall
monthlySold comps — $/sqft
last 12 mo · ≤1 miLoading sold comps…