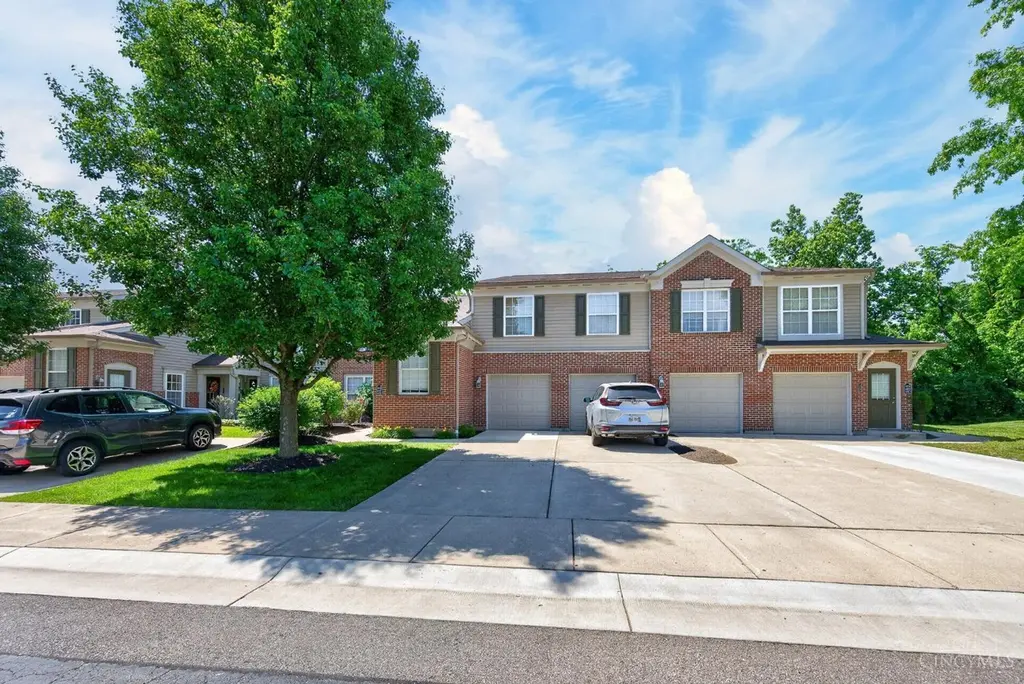
1447 Windwillow Trce · South Lebanon, OH
Flood risk 1/10 · Minimal
- FEMA flood zone
- X (unshaded)
- Chance of flooding over 30 yrs
- 0.0%
- Est. flood insurance / yr
- $507 – $1,088
Fire risk 1/10 · Minimal
- Est. fire insurance / yr
- $713 – $1,323
Heat risk 4/10 · Minor
- Hot days now (above 102°F)
- 7 days/yr
- Hot days in 30 yrs
- 19 days/yr
Wind risk 2/10 · Minimal
- Chance of severe wind over 30 yrs
- 1.0%
Air-quality risk 4/10 · Minor
- Unhealthy air days now
- 4 days/yr
- Unhealthy air days in 30 yrs
- 6 days/yr
Risk factors via First Street. Map © Google.
Why this score? — see what drove the C+ grade
The composite is a weighted blend of 9 inputs, each scored 0–100. Each bar is that input's sub-score; the figure is the points it added to the 100-point composite (weight × sub-score).
- Cash flow +18.2/30.0
- Appreciation +10.0/10.0
- ARV discount +7.5/15.0
- 1% rule +6.6/10.0
- Schools +6.1/10.0
- DSCR +5.7/10.0
- Rent growth +4.4/5.0
- Livability +3.7/5.0
- Condition / age +2.5/5.0
$215,000
🖨 Deal sheet 📄 Offer letter ✓ Due diligence
Listing remarks MLS
Great condo in Adena at Miami Bluffs! Private entry on ground level with stairs down to lower level condo with walkout to private patio area with wooded view. New vinyl luxury plank flooring throughout main living areas, fresh paint throughout! Kitchen appliances and washer/dryer stay! Enjoy low maintenance lifestyle with amazing community amenities - walking trails, ponds, pool, clubhouse, sports complex and direct access to Little Miami Bike Trail! Welcome Home!
Key facts
- Open floor plan
- Overlooking woods
- Walk out to patio
Tags
Property features AI
Finance
- Other: Zoned residential; Condo description: Other; Access via city street
- HOA & community: HOA: Towne Properties; Monthly association fee of $248 (includes exterior maintenance, snow removal, association dues, unit landscaping, community landscaping, professional management); Quarterly association fee of $162.50
Exterior
- Parking: 1 assigned parking space
- Utilities: Public water; Public sewer; Electric power
- Home design: Traditional style; One story / one level unit; Unit entry at level 1; Private entry
- Construction: Brick construction; Shingle roof; Slab foundation; Vinyl insulated windows; Built features include an electric ceramic fireplace
- Exterior features: Patio; Cleared, level lot; Pets allowed
Interior
- Kitchen: Counter bar; Vinyl flooring; Wood cabinets; Dishwasher; Oven/Range; Refrigerator; Garbage disposal
- Bedrooms: 2 bedrooms total; Primary bedroom (lower level) — 17 x 12; Second bedroom (lower level) — 12 x 12
- Flooring: Vinyl flooring (kitchen)
- Bathrooms: 2 full bathrooms; Primary bathroom with shower
- Heating & cooling: Electric forced-air heating; Central air conditioning; Electric water heating
- Interior features: Multi-panel doors; Ceiling fan; Smoke alarm; Private entry; Laundry in unit
- Laundry & utility: In-unit laundry; Washer; Dryer; Laundry room (lower level) — 8 x 5
Neighborhood map
What this means for you Summary
Snapshot
- This is a 2-bed/2.0-bath condo listed at $215k.
Deal economics
- At list price, monthly cash flow is $195 ($2k/yr) — positive.
- The deal already cash-flows at list — no discount required.
- Meets the 1% rule at list price ($2k rent vs $215k).
- Cap rate 7.4% vs local median 3.5% in South Lebanon — top-decile yield for the area; either an underpriced asset or a hidden risk that comps aren't pricing in. Stress-test before assuming the spread holds.
Location & tenants
- Location reads 74/100 on livability (#279 in OH, #4,589 nationally) — a middle-class / working-renter tenant base. Strengths: crime A+, employment A+, cost of living A+; Watch: schools F, amenities F, commute F.
- Little Miami Local (rural): math 67% / reading 70% proficiency, ranked #140 of 656 in OH (top 21%) — acceptable for families but not a draw, mixed tenant base, ~2y average lease; only 17% free/reduced lunch — higher-income household profile.
- Market conditions: Rents rising fast (+7.4%/yr); 126 active listings in the ZIP; 1 comparable units currently listed for rent nearby; solid renter incomes; 1,224 units permitted in Warren County in 2024 (474 in 5+ unit buildings).
Forward outlook
- In year one you build about $23k of equity ($1k loan paydown + $22k appreciation (10.0% local appreciation)).
- Warren County population projected at +16% by 2050 — long-run rental-demand tailwind backs the buy-and-hold thesis.
- At projected returns (10.0% appreciation + 7.4% rent growth), your $60k cash investment doubles in ~3 years — after that, you're playing with house money.
- By year 2, paydown + projected appreciation supports a ~$37k cash-out refi (75% LTV) — recoverable capital for the next deal without selling this one.
Negotiation context
- Only 13 days on market — expect competitive offers; lowballing is unlikely to land.
- 13 sale attempts since 20y ago with the ask held roughly flat each time — persistent listings suggest the price (not the market) is what's stuck; bring a comps-based counter.
- Current owner paid $165k; 30% above their basis — modest negotiation headroom, anchor on the comps not their cost.
Questions for the listing agent
- What does the HOA fee cover, when was the last increase, and are there any pending special assessments or reserve-fund shortfalls?
- Any open or pending special assessments — roof, HVAC, plumbing, elevator, façade? What's the per-unit balance and payoff schedule, and is the seller paying it off at close or rolling it to the buyer?
- Is there a deadline driving the sale (1031 exchange, divorce, estate, relocation)? That informs how much negotiation room exists.
- Schools are F-rated, which usually means shorter tenancies and higher turnover. Who's the typical renter profile here, and what's been the actual vacancy rate?
- What's the average days-on-market for RENTAL listings here right now (not sales)? A rising rental-DOM trend means longer vacancies and softer asking-rent achievability than the comps imply.
- What's the recent tenant-quality profile in this submarket — average credit score on applications, eviction rate, late-payment / NSF rate, and stable-employment percentage? A property-management company in the area should have these aggregated.
- How much new apartment / multifamily construction is in the pipeline within 1–3 miles? Heavy new supply (>2% of stock underway) typically softens rents 12–24 months out; light construction supports rent growth.
Investment metrics
- 1% rule
- 1.16% ✓
- Cap rate
- 7.38%
- Cash-on-cash
- 3.88%
- DSCR
- 1.17
- GRM
- 7.2
CMA / ARV
No comps found within radius.
Projected returns pro-forma
10.0% appreciation · 7.42% rent growth · sell at horizon
- IRR
- 29.1%
- Equity multiple
- 3.35×
- Total profit
- $141,254
- Equity at exit
- $193,689
- IRR
- 26.9%
- Equity multiple
- 8.22×
- Total profit
- $434,605
- Equity at exit
- $417,698
Cash invested: $60,200 (down + closing). Projections, not guarantees.
Landlord ↔ Tenant lean methodology
- Overall (STATE)
- 73 Landlord-Friendly
- State Ohio
- 73 Landlord-Friendly · R+6
- County
- — inherits STATE
- City
- — inherits STATE
ZIP-level market 45039
- Home prices YoY
- 7.3%
- Rents YoY
- 7.4%
- Active inventory
- 126
- Price-to-rent
- 7.2×
Monthly cashflow live
- Estimated rent
- $2,486 medium interval (Pro) →
- Mortgage (P&I)
- −$1,127
- Tax from tax record
- −$250 /mo · $2,999/yr
- Insurance
- −$90
- HOA
- −$302
- Vacancy / Maint / Mgmt
- −$522
- Net cashflow
- $195
Break-even live
UW: 25.0% down · 7.5% · 30yr · 1.5% tax · 5.0% vac · 8.0% maint · 8.0% mgmt
Financing live
Cash to close
- Down payment
- $53,750
- Closing costs
- $6,450
- Reserves months
- —
- Total cash needed
- —
Loan-product check · same deal, 3 products live
Conventional
25% down · 7.5% · 30yr
- Down + closing
- —
- Monthly P&I
- —
- Monthly cashflow
- —
- DSCR
- —
- Eligible?
- —
Personal DTI + credit; lowest rate.
DSCR
20% down · 8.5% · 30yr
- Down + closing
- —
- Monthly P&I
- —
- Monthly cashflow
- —
- DSCR
- —
- Eligible?
- —
No personal income docs; deal must DSCR.
Hard money
10% down · 12.0% · 12mo
- Down + closing
- —
- Monthly P&I
- —
- Monthly cashflow
- —
- DSCR
- —
- Eligible?
- —
Short-term bridge; refi at stabilization.
Rent comps 1 comps
| Address | Beds | Baths | Sqft | Rent | $/sqft | DOM | Units | Dist |
|---|---|---|---|---|---|---|---|---|
| 1409 Grandin Rd Maineville, OH | 2.0 | 2.0 | 1460 | $4,200 | $2.88 | 2d | 1 | 0.73mi |
HOA detail condo
- Monthly dues
- $302 · $3,624/yr
- Likely covers
- pool
- Assessments
- None detected in remarks — confirm with the listing agent.
Listing history 9 events
-
2026-06-18days on market $215,000 Active 13 DOM
-
2026-06-17days on market $215,000 Active 12 DOM
-
2026-06-16days on market $215,000 Active 11 DOM
-
2026-06-15days on market $215,000 Active 10 DOM
-
2026-06-13days on market $215,000 Active 8 DOM
-
2026-06-09days on market $215,000 Active 4 DOM
-
2026-06-08days on market $215,000 Active 3 DOM
-
2026-06-07remarks 512-char remark
-
2026-06-07$215,000 Active 2 DOM
ⓘ Source: listings_history table (triggers on properties + properties_extension) + one-shot
backfill from property_details.listing_events for pre-trigger history.
Tax reassessment forecast OH · Partial reset (capped growth)
- Current annual tax
- $2,999 · $250/mo
- Projected year-2 tax
- $3,177 · $265/mo
- Expected delta
- +$177/yr (+$15/mo · 5.9%)
ⓘ Screening estimate from a state-policy table — verify with the county assessor before closing.
Climate risk First Street
- Flood 1/10 Low FEMA zone X (unshaded) · 0% chance over 30 yrs
- Wildfire 1/10 Low
- Heat 4/10 Moderate 7 d/yr ≥102°F today · 19 d/yr by 30 yrs out
- Wind 2/10 Low 100% chance of damaging wind over 30 yrs
- Air quality 4/10 Moderate 4 unhealthy d/yr today · 6 by 30 yrs out
Nearby sold comps map
Loading sold comps map…
Walkable amenities ~0.75 mi
Loading nearby amenities…
Taxation est. · year 1
- Rental income
- $29,829
- − Mortgage interest
- −$12,043
- − Property taxes
- −$2,999
- − Insurance
- −$1,075
- − Repairs & maintenance
- −$2,386
- − Management
- −$2,386
- − HOA
- −$3,624
- − Depreciation
- −$6,255
- Taxable loss
- −$940
- Est. tax savings @ 24.0%
- +$226
- After-tax cash flow
- $2,562/yr
For passive investors: Depreciation is non-cash, so a rental often shows a tax loss while cash-flowing — sheltering income. Rental losses are passive: they offset passive income freely, and up to $25,000/yr can offset ordinary (W-2) income if you actively participate and your MAGI is under $100k (phasing out to $0 by $150k); unused losses carry forward. On sale, claimed depreciation is recaptured at up to 25%, and gains may owe capital-gains tax (a 1031 exchange can defer both). Figures are a year-1 estimate at your 24.0% rate — not tax advice; consult a CPA.
Schools (NCES district)
- District
- Little Miami Local
- NCES district ID
- 3905044
- Math proficiency
- 67% ▼ -11.00%
- Reading proficiency
- 70% ▼ -6.00%
- Median HH income
- $74,949
- Composite
- 60.5/100
- National rank
- #844
- State rank
- #140 of 656 in OH
Livability — South Lebanon
- Score
- 74/100
- State rank
- #279
- US rank
- #4589
Category grades
Schools grade is shown separately in the Schools card above.
Census & demographics
- County
- Warren County · 196,906 people
- City population
- 7,053
- Metro
- Cincinnati, OH-KY-IN
- Population (ZIP)
- 28,335
- Household income
- $108,794
- Rent vs Own
- Severe rent burden
- 307.0
Population outlook (Warren County) Hauer SSP2
- Today (2025)
- 248,603 people
- By 2030
- 259,345 · +4.3%
- By 2040
- 277,666 · +11.7%
- By 2050
- 289,599 · +16.5%
- By 2075
- 311,681 · +25.4%
- By 2100
- 302,738 · +21.8%
Race, ethnicity, and origin ACS 2023
- Neighborhood character
- Predominantly White (88%)
- Race & ethnicity
- White 88% Hispanic / Latino 5% Two or more races 5% Asian 3% Black 2%
- Common ancestry
- Romanian 2% Scotch-Irish 2% Lithuanian 2%
- Foreign-born
- 8% · Canada, Jamaica
- Languages at home
- 92% English-only · Spanish 3% Russian/Polish/Slavic 2% Other Indo-European 1%
Political lean MEDSL · Warren
- 2024 margin
- Solid R (+31.5) · D 33.8% · R 65.3%
- 2008→2024 swing
- +4.5pp toward D · 2008: -36.1pp · 2024: -31.5pp
- All cycles
- 2024: R+31.5 2020: R+30.8 2016: R+37.6 2012: R+39.5 2008: R+36.1
Not yet ingested
- Civics
- —
Market trends
- HPI YoY
- ▲ 38.63%
- Current HPI
- 568.09
- Rent YoY
- ▲ 7.42%
- Metro
- Cincinnati, OH-KY-IN
- State GDP YoY
- ▲ 1.98%
- F500 in state
- 48
Industry mix (Fortune 500 HQ in OH)
| Industry | F500 HQs | Revenue |
|---|---|---|
| Insurance | 3 | $145B |
|
||
| Industrial Machinery | 3 | $49B |
|
||
| Financial Services | 3 | $24B |
|
||
| Consumer Goods | 2 | $93B |
|
||
| Aerospace / Defense | 2 | $47B |
|
||
| Utilities | 2 | $33B |
|
||
Price history
+88.8% since first listed31 events — show timeline
- 2026-06-05 Listed $215,000 Cincy MLS
- 2023-09-13 Price Changed $165,000 Cincy MLS
- 2023-03-30 Sold (Public Records) $165,000 Public Records
- 2023-03-28 Sold (MLS) $165,000 Cincy MLS
- 2023-03-28 Sold (MLS) $16,500 Dayton MLS
- 2023-03-28 Sold (MLS) $16,500 Dayton MLS
- 2023-03-24 Pending — Cincy MLS
- 2023-03-24 Pending — Dayton MLS
- 2023-03-23 Price Changed $175,000 Cincy MLS
- 2023-03-22 Relisted — Dayton MLS
- 2023-03-22 Relisted — Cincy MLS
- 2023-03-15 Pending — Cincy MLS
- 2023-03-15 Contingent — Dayton MLS
- 2023-03-14 Listed $175,000 Cincy MLS
- 2023-03-14 Listed $175,000 Dayton MLS
- 2013-08-11 Listing Removed — Cincy MLS
- 2013-08-11 Listing Removed — Dayton MLS
- 2013-01-28 Listed $102,900 Cincy MLS
- 2013-01-28 Listed $102,900 Dayton MLS
- 2011-07-14 Listing Removed — Cincy MLS
- 2011-07-14 Listing Removed — Dayton MLS
- 2011-01-13 Listed $108,900 Cincy MLS
- 2011-01-13 Listing Removed — Cincy MLS
- 2011-01-13 Listing Removed — Dayton MLS
- 2011-01-13 Listed $108,900 Dayton MLS
- 2010-04-13 Listed $108,900 Cincy MLS
- 2010-04-13 Listed $108,900 Dayton MLS
- 2008-09-28 Listing Removed — Cincy MLS
- 2008-03-27 Listed $115,000 Cincy MLS
- 2006-06-02 Sold (MLS) $111,637 Cincy MLS
- 2006-03-17 Listed $113,855 Cincy MLS
Property tax history
+3.8%/yrLatest (2025): $2,999 · -0.0% YoY. Source: county tax records.
Cash-flow waterfall
monthlySold comps — $/sqft
last 12 mo · ≤1 miLoading sold comps…