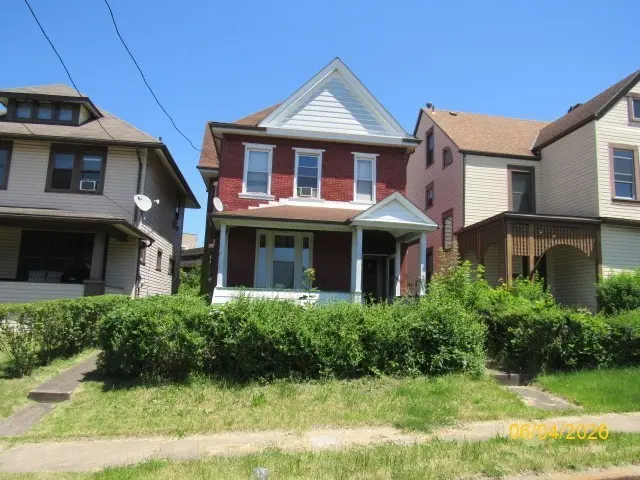
513 Park St · McKeesport, PA
Flood risk 1/10 · Minimal
- FEMA flood zone
- X (unshaded)
- Chance of flooding over 30 yrs
- 0.0%
- Est. flood insurance / yr
- $473 – $860
Fire risk 1/10 · Minimal
- Est. fire insurance / yr
- $511 – $949
Heat risk 4/10 · Minor
- Hot days now (above 97°F)
- 7 days/yr
- Hot days in 30 yrs
- 18 days/yr
Wind risk 2/10 · Minimal
- Chance of severe wind over 30 yrs
- —
Air-quality risk 4/10 · Minor
- Unhealthy air days now
- 4 days/yr
- Unhealthy air days in 30 yrs
- 5 days/yr
Risk factors via First Street. Map © Google.
Why this score? — see what drove the D grade
The composite is a weighted blend of 9 inputs, each scored 0–100. Each bar is that input's sub-score; the figure is the points it added to the 100-point composite (weight × sub-score).
- Cash flow +15.0/30.0
- ARV discount +7.5/15.0
- 1% rule +5.0/10.0
- DSCR +5.0/10.0
- Livability +3.3/5.0
- Rent growth +2.5/5.0
- Condition / age +2.5/5.0
- Schools +1.6/10.0
- Appreciation +0.0/10.0
$34,900
🖨 Deal sheet 📄 Offer letter ✓ Due diligence
Listing remarks MLS
Discover the potential of 513 Park St. , a charming brick home nestled in a TRANQUIL McKeesport, PA, neighborhood. This property boasts an INVITING COVERED FRONT PORCH and a SPACIOUS LIVING ROOM. The roomy DINING AREA also includes a FIREPLACE, adding warmth to the space. THE KITCHEN offers PLENTIFUL CABINET SPACE, complemented by a BONUS BACK ROOM doubling as a PANTRY. Upstairs, find FOUR GENEROUSLY SIZED BEDROOMS, perfect for customization. Being less than 30 minutes from Downtown Pittsburgh, making it an IDEAL CHOICE for tenants and end buyers alike!
Key facts
- 3,484 sq ft lot
- Built 1880
- Listed 13 days
Tags
Property features AI
Exterior
- Parking: On-street parking
- Utilities: Public water; Public sewer
- Home design: 2-story brick home; Asphalt roof; Resale property
- Construction: Brick construction; Asphalt roof
- Exterior features: 30 x 135 x 32 x 136 lot dimensions; Public transportation nearby
Interior
- Kitchen: Kitchen on upper level
- Bedrooms: Three main-level bedrooms; One main-level bedroom (listed as Bedroom 4)
- Flooring: Carpet; Hardwood; Vinyl
- Bathrooms: One full bathroom; One half bathroom
- Heating & cooling: Forced air heating; Gas heating
- Interior features: Carpet flooring; Hardwood flooring; Vinyl flooring; Full, unfinished basement with interior entry
Neighborhood map
What this means for you Summary
Snapshot
- This is a 4-bed/1.5-bath single-family listed at $35k.
Deal economics
- At list price, monthly cash flow is $945 ($11k/yr) — positive.
- The deal already cash-flows at list — no discount required.
- Meets the 1% rule at list price ($2k rent vs $35k).
- Cap rate 38.8% vs local median 10.3% in McKeesport — top-decile yield for the area; either an underpriced asset or a hidden risk that comps aren't pricing in. Stress-test before assuming the spread holds.
Location & tenants
- Location reads 66/100 on livability (#1,089 in PA) — a middle-class / working-renter tenant base. Strengths: commute A+, cost of living A+, housing A+; Watch: schools D+, health & safety D, crime F.
- Mckeesport Area SD (suburban): math 11% / reading 28% proficiency, ranked #499 of 539 in PA (top 93%) — low school quality limits family demand, transient renter base, plan for 1-2y turnover; 66% free/reduced lunch — lower-income household profile, screen leases tightly.
- Market conditions: 113 active listings in the ZIP; 9 comparable units currently listed for rent nearby; rentals at typical pace (median 24d on market — plan ~3-4 weeks tenant-placement turnaround); 44% of comp listings sitting > 30 days — soft ceiling on asking rent; lower-income renter base — watch delinquency; 2,996 units permitted in Allegheny County in 2024 (1,588 in 5+ unit buildings).
- At $1,501/mo this rent would consume 51% of the median local household income ($35k/yr) (locally 1239% of renters already pay >50% of income on rent) — very limited rent-growth headroom before tenants either downsize or default.
Forward outlook
- Local home prices are declining (-3.0%/yr); year-one equity from $241 of loan paydown is wiped out by about $1k of value loss. Plan a longer hold.
- At projected returns (-3.0% appreciation + 3.0% rent growth), your $10k cash investment doubles in ~1 year — after that, you're playing with house money.
Negotiation context
- Only 13 days on market — expect competitive offers; lowballing is unlikely to land.
- 4 sale attempts since 24y ago with the ask held roughly flat each time — persistent listings suggest the price (not the market) is what's stuck; bring a comps-based counter.
Risks & watch-outs
- Watch-outs: built in 1880 — expect roof / HVAC / electrical / plumbing capex.
Questions for the listing agent
- Built in 1880 — when were the roof, HVAC, electrical panel, plumbing, and water heater last replaced?
- Is there a deadline driving the sale (1031 exchange, divorce, estate, relocation)? That informs how much negotiation room exists.
- Schools are D-rated, which usually means shorter tenancies and higher turnover. Who's the typical renter profile here, and what's been the actual vacancy rate?
- Crime grade is F in this area — have there been break-ins, vandalism, or insurance claims at this property in the last 3 years? What carrier currently insures it and at what premium?
- The area grade is low — what's the realistic commute time and amenity access for the typical tenant pool here? Any planned neighborhood developments (good or bad) we should know about?
- What's the average days-on-market for RENTAL listings here right now (not sales)? A rising rental-DOM trend means longer vacancies and softer asking-rent achievability than the comps imply.
- What's the recent tenant-quality profile in this submarket — average credit score on applications, eviction rate, late-payment / NSF rate, and stable-employment percentage? A property-management company in the area should have these aggregated.
- How much new for-sale + rental construction is in the pipeline within 1–3 miles? Heavy new supply typically softens prices + rents 12–24 months out; constrained supply supports both.
Investment metrics
- 1% rule
- 4.30% ✓
- Cap rate
- 38.78%
- Cash-on-cash
- 116.04%
- DSCR
- 6.16
- GRM
- 1.9
CMA / ARV
- ARV (on-the-fly)
- $140,692
- Comps found
- 10
Show comp detail 10 sales within ~0.75 mi
| Address | Dist | Beds/Ba | Sqft | Sold | Price | $/sf | Match |
|---|---|---|---|---|---|---|---|
| 1312 Ross St | 0.53mi | 4/1.0 | 1,800 (-13%) | 3mo | $125,000 | $69 | 49 |
| 1411 Manor Ave | 0.53mi | 5/2.0 (+1) | 2,144 (+4%) | 22mo | $145,000 | $68 | 44 |
| 1703 Coursin St | 0.59mi | 3/2.0 (-1) | 1,874 (-9%) | 6mo | $55,000 | $29 | 44 |
| 1703 Bailie Ave | 0.55mi | 3/2.0 (-1) | 1,980 (-4%) | 22mo | $13,500 | $7 | 42 |
| 1128 Mccleary St | 0.72mi | 4/2.5 | 2,033 (-2%) | 21mo | $148,000 | $73 | 42 |
| 1809 Coursin St | 0.69mi | 4/3.0 | 1,916 (-7%) | 11mo | $212,000 | $111 | 40 |
| 1517 Beaver St | 0.64mi | 3/1.5 (-1) | 1,815 (-12%) | 6mo | $38,000 | $21 | 40 |
| 1300 Pirl St | 0.58mi | 3/2.0 (-1) | 1,800 (-13%) | 7mo | $13,250 | $7 | 39 |
| 1409 Carnegie Ave | 0.45mi | 4/1.5 | 2,352 (+14%) | 21mo | $72,000 | $31 | 39 |
| 1409 Centennial St | 0.62mi | 5/3.5 (+1) | 2,285 (+10%) | 7mo | $170,000 | $74 | 35 |
Match score weights: distance 35% · size 25% · config 20% · recency 20%. Top-matched comps best support the ARV.
Projected returns pro-forma
-3.0% appreciation · 3.0% rent growth · sell at horizon
- IRR
- —
- Equity multiple
- 6.58×
- Total profit
- $54,553
- Equity at exit
- $5,204
- IRR
- —
- Equity multiple
- 13.80×
- Total profit
- $125,094
- Equity at exit
- $3,018
Cash invested: $9,772 (down + closing). Projections, not guarantees.
Landlord ↔ Tenant lean methodology
- Overall (STATE)
- 62 Landlord-Friendly
- State Pennsylvania
- 62 Landlord-Friendly · EVEN
- County
- — inherits STATE
- City
- — inherits STATE
ZIP-level market 15132
- Home prices YoY
- -32.9%
- Active inventory
- 113
- Price-to-rent
- 1.9×
Monthly cashflow live
- Estimated rent
- $1,501 high interval (Pro) →
- Mortgage (P&I)
- −$183
- Tax est. 1.5%
- −$44 /mo · $524/yr
- Insurance
- −$15
- HOA
- −$0
- Vacancy / Maint / Mgmt
- −$315
- Net cashflow
- $945
Break-even live
UW: 25.0% down · 7.5% · 30yr · 1.5% tax · 5.0% vac · 8.0% maint · 8.0% mgmt
Financing live
Cash to close
- Down payment
- $8,725
- Closing costs
- $1,047
- Reserves months
- —
- Total cash needed
- —
Loan-product check · same deal, 3 products live
Conventional
25% down · 7.5% · 30yr
- Down + closing
- —
- Monthly P&I
- —
- Monthly cashflow
- —
- DSCR
- —
- Eligible?
- —
Personal DTI + credit; lowest rate.
DSCR
20% down · 8.5% · 30yr
- Down + closing
- —
- Monthly P&I
- —
- Monthly cashflow
- —
- DSCR
- —
- Eligible?
- —
No personal income docs; deal must DSCR.
Hard money
10% down · 12.0% · 12mo
- Down + closing
- —
- Monthly P&I
- —
- Monthly cashflow
- —
- DSCR
- —
- Eligible?
- —
Short-term bridge; refi at stabilization.
Rent comps 9 comps
| Address | Beds | Baths | Sqft | Rent | $/sqft | DOM | Units | Dist |
|---|---|---|---|---|---|---|---|---|
| 1507 Carnegie Ave McKeesport, PA | 3.0 | 1.5 | 1600 | $1,699 | $1.06 | 14d | 1 | 0.41mi |
| 1217 Scott St McKeesport, PA | 3.0 | 1.0 | 1500 | $1,165 | $0.78 | 43d | 1 | 0.48mi |
| 2212 Cronemeyer St McKeesport, PA | 3.0 | 1.0 | 1720 | $1,375 | $0.80 | 43d | 1 | 0.72mi |
| 1318 Maryland Ave West Mifflin, PA | 3.0 | 1.0 | 1408 | $1,695 | $1.20 | 43d | 1 | 0.76mi |
| 1451 Jenny Lind St McKeesport, PA | 3.0 | 1.5 | 1408 | $1,150 | $0.82 | 23d | 1 | 0.78mi |
| 2807 Beaver St McKeesport, PA | 4.0 | 2.0 | 1700 | $1,200 | $0.71 | 43d | 1 | 0.81mi |
| 2408 McCarrell St McKeesport, PA | 4.0 | 1.0 | 1430 | $1,195 | $0.84 | 23d | 1 | 1.20mi |
| 2311 Grandview Ave McKeesport, PA | 4.0 | 2.0 | 2550 | $1,250 | $0.49 | 17d | 1 | 1.29mi |
| 19 S 6th St Duquesne, PA | 3.0 | 1.0 | 2100 | $1,675 | $0.80 | 23d | 1 | 1.41mi |
Listing history 10 events
-
2026-06-18days on market $34,900 Active 13 DOM
-
2026-06-17days on market $34,900 Active 12 DOM
-
2026-06-16days on market $34,900 Active 11 DOM
-
2026-06-15days on market $34,900 Active 10 DOM
-
2026-06-13days on market $34,900 Active 8 DOM
-
2026-06-13days on market $34,900 Active 7 DOM
-
2026-06-09days on market $34,900 Active 4 DOM
-
2026-06-08days on market $34,900 Active 3 DOM
-
2026-06-07remarks 238-char remark
-
2026-06-07$34,900 Active 2 DOM
ⓘ Source: listings_history table (triggers on properties + properties_extension) + one-shot
backfill from property_details.listing_events for pre-trigger history.
Climate risk First Street
- Flood 1/10 Low FEMA zone X (unshaded) · 0% chance over 30 yrs
- Wildfire 1/10 Low
- Heat 4/10 Moderate 7 d/yr ≥97°F today · 18 d/yr by 30 yrs out
- Wind 2/10 Low
- Air quality 4/10 Moderate 4 unhealthy d/yr today · 5 by 30 yrs out
Nearby sold comps map
Loading sold comps map…
Walkable amenities ~0.75 mi
Loading nearby amenities…
Taxation est. · year 1
- Rental income
- $18,018
- − Mortgage interest
- −$1,955
- − Property taxes
- −$524
- − Insurance
- −$174
- − Repairs & maintenance
- −$1,441
- − Management
- −$1,441
- − Depreciation
- −$1,015
- Taxable income
- $11,467
- Est. tax owed @ 24.0%
- −$2,752
- After-tax cash flow
- $8,588/yr
For passive investors: Depreciation is non-cash, so a rental often shows a tax loss while cash-flowing — sheltering income. Rental losses are passive: they offset passive income freely, and up to $25,000/yr can offset ordinary (W-2) income if you actively participate and your MAGI is under $100k (phasing out to $0 by $150k); unused losses carry forward. On sale, claimed depreciation is recaptured at up to 25%, and gains may owe capital-gains tax (a 1031 exchange can defer both). Figures are a year-1 estimate at your 24.0% rate — not tax advice; consult a CPA.
Schools (NCES district)
- District
- Mckeesport Area SD
- NCES district ID
- 4214940
- Math proficiency
- 11% ▼ -9.00%
- Reading proficiency
- 28% ▼ -10.00%
- Median HH income
- $33,779
- Composite
- 15.88/100
- National rank
- #9257
- State rank
- #499 of 539 in PA
Livability — McKeesport
- Score
- 66/100
- State rank
- #1089
- US rank
- #12321
Category grades
Schools grade is shown separately in the Schools card above.
Census & demographics
- Census place
- McKeesport, PA
- County
- Allegheny County · 1,022,028 people
- City population
- 25,010
- Metro
- Pittsburgh, PA
- Population (ZIP)
- 18,898
- Household income
- $35,397
- Rent vs Own
- Severe rent burden
- 1239.0
Population outlook (Allegheny County) Hauer SSP2
- Today (2025)
- 1,250,282 people
- By 2030
- 1,256,482 · +0.5%
- By 2040
- 1,256,318 · +0.5%
- By 2050
- 1,244,169 · -0.5%
- By 2075
- 1,197,693 · -4.2%
- By 2100
- 1,093,187 · -12.6%
Race, ethnicity, and origin ACS 2023
- Neighborhood character
- Diverse neighborhood (Simpson 0.62)
- Race & ethnicity
- White 50% Black 35% Two or more races 10% Hispanic / Latino 4% Asian 1%
- Common ancestry
- Romanian 5% Serbian 2% Scotch-Irish 2%
- Foreign-born
- 2% · Canada, China
- Languages at home
- 96% English-only · Spanish 3%
Political lean MEDSL · Allegheny
- 2024 margin
- Strong D (+20.3) · D 59.7% · R 39.4%
- 2008→2024 swing
- +4.8pp toward D · 2008: 15.5pp · 2024: 20.3pp
- All cycles
- 2024: D+20.3 2020: D+20.4 2016: D+16.4 2012: D+14.4 2008: D+15.5
Not yet ingested
- Civics
- —
Market trends
- HPI YoY
- ▼ -71.01%
- Current HPI
- 145.195
- Rent YoY
- —
- Metro
- Pittsburgh, PA
- State GDP YoY
- ▲ 1.68%
- F500 in state
- 34
Industry mix (Fortune 500 HQ in PA)
| Industry | F500 HQs | Revenue |
|---|---|---|
| Healthcare | 2 | $309B |
|
||
| Insurance | 2 | $27B |
|
||
| Telecommunications / Media | 1 | $124B |
|
||
| Industrial Distribution | 1 | $22B |
|
||
| Financial Services | 1 | $20B |
|
||
| Chemicals / Materials | 1 | $18B |
|
||
Price history
+24.6% since first listed9 events — show timeline
- 2026-06-05 Listed $34,900 West Penn MLS
- 2023-12-27 Price Changed $35,950 West Penn MLS
- 2023-12-13 Listed $37,950 West Penn MLS
- 2010-04-21 Sold (Public Records) $38,000 Public Records
- 2008-10-29 Sold (MLS) $10,100 West Penn MLS
- 2008-08-13 Listed $9,900 West Penn MLS
- 2004-04-28 Sold (Public Records) $37,250 Public Records
- 2002-07-31 Sold (MLS) $22,000 West Penn MLS
- 2002-06-24 Listed $28,000 West Penn MLS
Property tax history
+9.9%/yrLatest (2026): $2,256 · +61.9% YoY. Source: county tax records.
Cash-flow waterfall
monthlySold comps — $/sqft
last 12 mo · ≤1 miLoading sold comps…