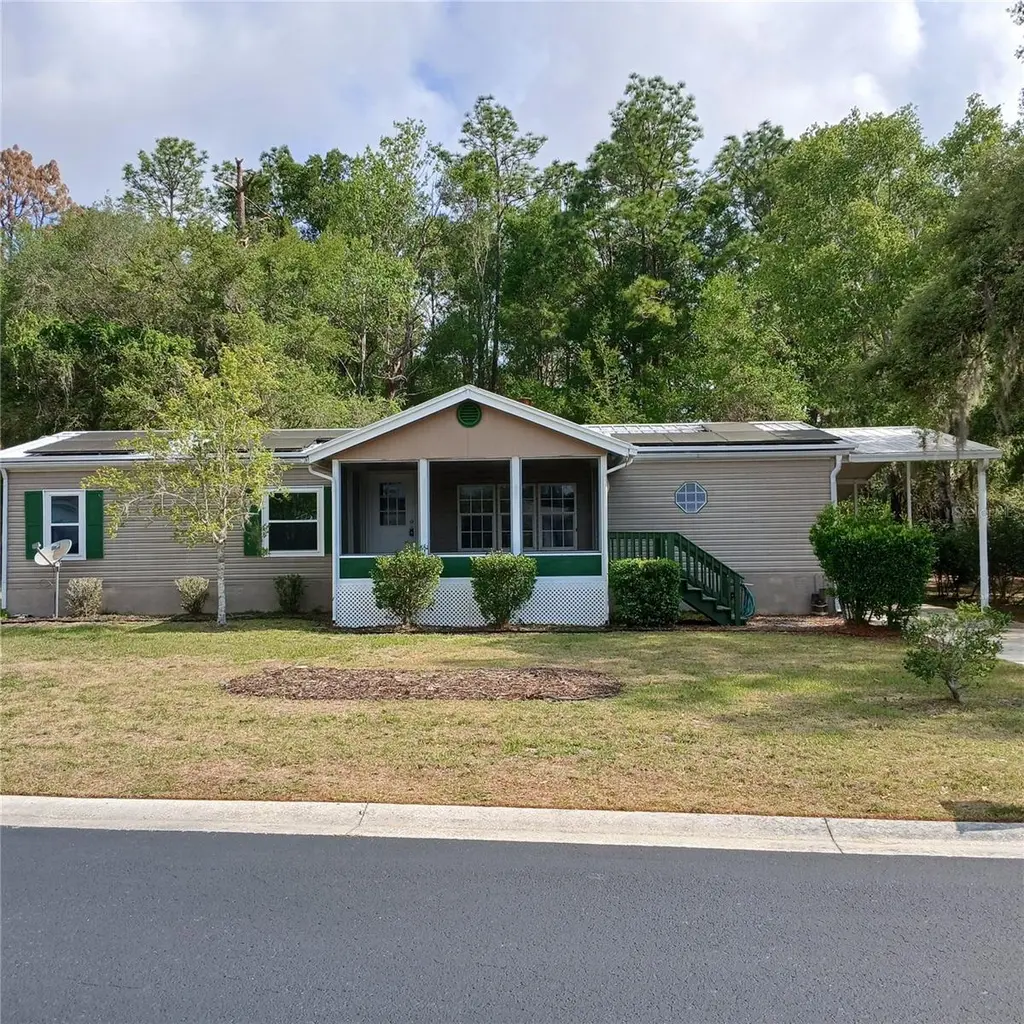
7899 W Fostoria Dr · Pine Ridge, FL
Flood risk 1/10 · Minimal
- FEMA flood zone
- X (unshaded)
- Chance of flooding over 30 yrs
- 0.0%
- Est. flood insurance / yr
- $507 – $1,088
Fire risk 4/10 · Minor
- Est. fire insurance / yr
- $947 – $1,759
Heat risk 9/10 · Severe
- Hot days now (above 108°F)
- 7 days/yr
- Hot days in 30 yrs
- 24 days/yr
Wind risk 9/10 · Severe
- Chance of severe wind over 30 yrs
- 99.0%
Air-quality risk 2/10 · Minimal
- Unhealthy air days now
- 2 days/yr
- Unhealthy air days in 30 yrs
- 2 days/yr
Risk factors via First Street. Map © Google.
Why this score? — see what drove the F grade
The composite is a weighted blend of 9 inputs, each scored 0–100. Each bar is that input's sub-score; the figure is the points it added to the 100-point composite (weight × sub-score).
- Cash flow +9.8/30.0
- 1% rule +5.0/10.0
- Schools +4.1/10.0
- Livability +3.4/5.0
- DSCR +2.8/10.0
- Rent growth +2.5/5.0
- Condition / age +2.5/5.0
- Appreciation +1.8/10.0
- ARV discount +0.0/15.0
$199,900
🖨 Deal sheet (PDF) 📄 Offer letter ✓ Due diligence
Listing remarks
Seller is providing $5000 towards buyer's closing costs. Beautifully updated and truly move-in ready, this meticulously maintained home offers the perfect blend of comfort, style, and efficiency in a desirable 55+ community where you own the land. Installed in 2024 and paid off at closing, the solar panel system delivers outstanding energy efficiency and long-term savings. The updated kitchen features brand-new stainless steel appliances including a microwave, oven, and refrigerator, along with a sleek black glass-top electric range, new stainless steel sink, and an upgraded pantry with custom shelving for exceptional storage and organization. The guest bathroom has been tastefully refreshe
Key facts
- Upgraded pantry
- Updated kitchen
- Walk-in shower
Tags
Property features AI
Finance
- Other: Property zoned RURMH; Lot is level, approximately 0.26 acres
- HOA & community: Has HOA (monthly fee of $272) — amenities include pool and shuffleboard court; fee covers pool and grounds maintenance; Senior community; Pets allowed
Exterior
- Parking: Carport with 2 spaces
- Utilities: Well water; Septic sewer; Electricity connected; Water connected; Solar energy generation
- Home design: Residential modular double-wide home; One story; Slab foundation; Home faces south
- Construction: Vinyl siding; Metal roof; Built as a double-wide modular
- Exterior features: Covered front and rear porches (rear porch is screened); Patio areas; Rain gutters; Shed/storage structure on property; In-ground pool
Interior
- Kitchen: Cooktop; Dishwasher; Microwave; Water filtration system; Electric water heater
- Bedrooms: 3 bedrooms
- Flooring: Laminate flooring
- Bathrooms: 2 full bathrooms
- Heating & cooling: Electric heating; Central air conditioning
- Interior features: Ceiling fans; Split-bedroom layout; Thermostat; Walk-in closets; Wood-burning fireplace in the living room
- Laundry & utility: Inside laundry room with washer and dryer included
Neighborhood map
What this means for you Summary
Snapshot
- This is a 3-bed/2.0-bath manufactured listed at $200k.
Deal economics
- At list price, monthly cash flow is $-129 ($-2k/yr) — negative.
- To cash-flow at today's rent, offer at most $177k (11.4% below list).
- Meets the 1% rule at list price ($2k rent vs $200k).
- Recommended offer: $177k (11.4% below list) — sets the bar for cash-flow.
- Cap rate 5.5% vs local median 3.4% in Pine Ridge — top-decile yield for the area; either an underpriced asset or a hidden risk that comps aren't pricing in. Stress-test before assuming the spread holds.
Location & tenants
- Location reads 67/100 on livability (#565 in FL) — a middle-class / working-renter tenant base. Strengths: crime A+, housing A+, cost of living A-; Watch: health & safety C-, amenities F, commute F.
- Citrus (rural): math 49% / reading 50% proficiency, ranked #44 of 73 in FL (top 60%) — families likely to look elsewhere, expect single-tenant / working-renter base with shorter leases.
- Zoned schools: Citrus Springs Elementary School (math 52% / reading 48%, grade D+, #1,070 of 2,144 statewide, top 51%, 817 students, 71% FRL); Crystal River Middle School (math 49% / reading 47%, grade C-, #286 of 571 statewide, top 50%, 900 students, 64% FRL); Crystal River High School (math 31% / reading 44%, grade F, #336 of 667 statewide, top 51%, 1,249 students, 56% FRL).
- Market conditions: 653 active listings in the ZIP; 2,443 units permitted in Citrus County in 2024 (0 in 5+ unit buildings).
Forward outlook
- Local home prices are declining (-3.0%/yr); year-one equity from $1k of loan paydown is wiped out by about $6k of value loss. Plan a longer hold.
- Citrus County population projected to shrink 10% by 2050 — rents likely to lag national; underwrite the cash flow, not the appreciation.
Negotiation context
- It's been on market 44 days — a 3% lower offer ($194k) is reasonable based on typical stale-listing flexibility.
- Current owner paid $76k; list at $200k implies a 161% gain — meaningful room to come down on a strong offer.
Risks & watch-outs
- Climate carrying-cost: severe wind risk, 99% chance of damaging wind over 30y; extreme-heat days projected 7→24/yr by 2055 (HVAC capex compounding) — expect insurance premiums to compound above CPI over the hold.
Questions for the listing agent
- What do current leases actually rent for vs. the listed asking? Can we see a recent rent roll and the last 12 months of T-12 income?
- It's been on market 44 days. Have you received any prior offers? Is the seller open to a 11% concession, seller financing, or rate buy-down credit?
- What does the HOA fee cover, when was the last increase, and are there any pending special assessments or reserve-fund shortfalls?
- Is there a deadline driving the sale (1031 exchange, divorce, estate, relocation)? That informs how much negotiation room exists.
- Schools are F-rated, which usually means shorter tenancies and higher turnover. Who's the typical renter profile here, and what's been the actual vacancy rate?
- The area grade is low — what's the realistic commute time and amenity access for the typical tenant pool here? Any planned neighborhood developments (good or bad) we should know about?
- What's the average days-on-market for RENTAL listings here right now (not sales)? A rising rental-DOM trend means longer vacancies and softer asking-rent achievability than the comps imply.
- What's the recent tenant-quality profile in this submarket — average credit score on applications, eviction rate, late-payment / NSF rate, and stable-employment percentage? A property-management company in the area should have these aggregated.
- How much new for-sale + rental construction is in the pipeline within 1–3 miles? Heavy new supply typically softens prices + rents 12–24 months out; constrained supply supports both.
Investment metrics
- 1% rule
- 1.00% ✓
- Cap rate
- 5.52%
- Cash-on-cash
- -2.76%
- DSCR
- 0.88
- GRM
- 8.3
CMA / ARV
- ARV (on-the-fly)
- $153,900
- Comps found
- 6
Show comp detail 6 sales within ~0.75 mi
| Address | Dist | Beds/Ba | Sqft | Sold | Price | $/sf | Match |
|---|---|---|---|---|---|---|---|
| 8385 N Shady Fork Way | 0.12mi | 3/2.0 | 1,512 (-2%) | 8mo | $151,000 | $100 | 84 |
| 7925 W Fostoria Dr | 0.04mi | 3/2.0 | 1,648 (+7%) | 18mo | $160,000 | $97 | 71 |
| 8156 N Princess Ave | 0.34mi | 3/2.0 | 1,724 (+12%) | 1mo | $90,000 | $52 | 64 |
| 8033 N Mary Ter | 0.46mi | 3/2.0 | 1,432 (-7%) | 5mo | $145,000 | $101 | 63 |
| 8445 N Cedar Elm Way | 0.06mi | 2/2.0 (-1) | 1,344 (-13%) | 11mo | $125,000 | $93 | 62 |
| 8645 N Ural Pt | 0.40mi | 3/2.0 | 1,344 (-13%) | 2mo | $238,500 | $177 | 58 |
Match score weights: distance 35% · size 25% · config 20% · recency 20%. Top-matched comps best support the ARV.
Projected returns pro-forma
-3.0% appreciation · 3.0% rent growth · sell at horizon
- IRR
- -20.7%
- Equity multiple
- 0.28×
- Total profit
- $-40,358
- Equity at exit
- $29,806
- IRR
- -13.7%
- Equity multiple
- 0.20×
- Total profit
- $-44,751
- Equity at exit
- $17,284
Cash invested: $55,972 (down + closing). Projections, not guarantees.
Landlord ↔ Tenant lean methodology
- Overall (STATE)
- 87 Strongly Landlord-Friendly
- State Florida
- 87 Strongly Landlord-Friendly · R+3
- County
- — inherits STATE
- City
- — inherits STATE
ZIP-level market 34433
- Home prices YoY
- -1.8%
- Active inventory
- 653
- Price-to-rent
- 8.3×
Monthly cashflow live
- Estimated rent
- $2,006 medium interval (Pro) →
- Mortgage (P&I)
- −$1,048
- Tax from tax record
- −$310 /mo · $3,714/yr
- Insurance
- −$83
- HOA
- −$272
- Vacancy / Maint / Mgmt
- −$421
- Net cashflow
- $-129
Break-even live
Sensitivity live
| Price | -10% $-16 | -5% $-72 | +0% $-129 | +5% $-185 | +10% $-242 |
|---|---|---|---|---|---|
| Rent | -10% $-287 | -5% $-208 | +0% $-129 | +5% $-50 | +10% $30 |
| Rate | -1.0pp $-28 | -0.5pp $-78 | base $-129 | +0.5pp $-181 | +1.0pp $-233 |
UW: 25.0% down · 7.5% · 30yr · 1.5% tax · 5.0% vac · 8.0% maint · 8.0% mgmt
Financing live
Cash to close
- Down payment
- $49,975
- Closing costs
- $5,997
- Reserves months
- —
- Total cash needed
- —
Loan-product check · same deal, 3 products live
Conventional
25% down · 7.5% · 30yr
- Down + closing
- —
- Monthly P&I
- —
- Monthly cashflow
- —
- DSCR
- —
- Eligible?
- —
Personal DTI + credit; lowest rate.
DSCR
20% down · 8.5% · 30yr
- Down + closing
- —
- Monthly P&I
- —
- Monthly cashflow
- —
- DSCR
- —
- Eligible?
- —
No personal income docs; deal must DSCR.
Hard money
10% down · 12.0% · 12mo
- Down + closing
- —
- Monthly P&I
- —
- Monthly cashflow
- —
- DSCR
- —
- Eligible?
- —
Short-term bridge; refi at stabilization.
HOA detail
- Monthly dues
- $272 · $3,264/yr
- Likely covers
- electric
Listing history 24 events
-
2026-06-21days on market $199,900 Active 44 DOM
-
2026-06-19days on market $199,900 Active 42 DOM
-
2026-06-18days on market $199,900 Active 41 DOM
-
2026-06-17days on market $199,900 Active 40 DOM
-
2026-06-16days on market $199,900 Active 39 DOM
-
2026-06-15days on market $199,900 Active 38 DOM
-
2026-06-14days on market $199,900 Active 36 DOM
-
2026-06-13days on market $199,900 Active 35 DOM
-
2026-06-09days on market $199,900 Active 32 DOM
-
2026-06-08days on market $199,900 Active 31 DOM
-
2026-06-07days on market $199,900 Active 30 DOM
-
2026-06-03days on market $199,900 Active 26 DOM
-
2026-06-02days on market $199,900 Active 25 DOM
-
2026-06-01days on market $199,900 Active 24 DOM
-
2026-05-31days on market $199,900 Active 23 DOM
-
2026-05-30days on market $199,900 Active 22 DOM
-
2026-05-08price $199,900
-
2026-05-08$189,900 Active
-
2026-04-12price $199,900
-
2026-03-14price $204,900
-
2026-02-23price $214,900
-
2010-10-26soldstatus $76,500
-
2005-07-06soldstatus $79,500
-
1999-08-30soldstatus $82,900
ⓘ Source: listings_history table (triggers on properties + properties_extension) + one-shot
backfill from property_details.listing_events for pre-trigger history.
Tax reassessment forecast FL · Resets to sale price
- Current annual tax
- $3,714 · $310/mo
- Projected year-2 tax
- $3,714 · $310/mo
- Expected delta
- $0/yr ($0/mo · 0.0%)
ⓘ Screening estimate from a state-policy table — verify with the county assessor before closing.
Climate risk First Street
- Flood 1/10 Low FEMA zone X (unshaded) · 0% chance over 30 yrs
- Wildfire 4/10 Moderate
- Heat 9/10 Extreme 7 d/yr ≥108°F today · 24 d/yr by 30 yrs out
- Wind 9/10 Extreme 99% chance of damaging wind over 30 yrs
- Air quality 2/10 Low 2 unhealthy d/yr today · 2 by 30 yrs out
Nearby sold comps map
Loading sold comps map…
Walkable amenities ~0.75 mi
Loading nearby amenities…
Taxation est. · year 1
- Rental income
- $24,066
- − Mortgage interest
- −$11,198
- − Property taxes
- −$3,714
- − Insurance
- −$1,000
- − Repairs & maintenance
- −$1,925
- − Management
- −$1,925
- − HOA
- −$3,264
- − Depreciation
- −$5,815
- Taxable loss
- −$4,775
- Est. tax savings @ 24.0%
- +$1,146
- After-tax cash flow
- $-399/yr
For passive investors: Depreciation is non-cash, so a rental often shows a tax loss while cash-flowing — sheltering income. Rental losses are passive: they offset passive income freely, and up to $25,000/yr can offset ordinary (W-2) income if you actively participate and your MAGI is under $100k (phasing out to $0 by $150k); unused losses carry forward. On sale, claimed depreciation is recaptured at up to 25%, and gains may owe capital-gains tax (a 1031 exchange can defer both). Figures are a year-1 estimate at your 24.0% rate — not tax advice; consult a CPA.
Schools (NCES district)
- District
- Citrus
- NCES district ID
- 1200270
- Math proficiency
- 49% ▼ -10.00%
- Reading proficiency
- 50% ▼ -6.00%
- Median HH income
- $38,618
- Composite
- 41.28/100
- National rank
- #3519
- State rank
- #44 of 73 in FL
Livability — Pine Ridge
- Score
- 67/100
- State rank
- #565
- US rank
- #10798
Category grades
Schools grade is shown separately in the Schools card above.
Census & demographics
- City population
- 18,514
- Population (ZIP)
- 8,218
Population outlook (Citrus County) Hauer SSP2
- Today (2025)
- 138,622 people
- By 2030
- 136,886 · -1.3%
- By 2040
- 132,009 · -4.8%
- By 2050
- 125,196 · -9.7%
- By 2075
- 108,570 · -21.7%
- By 2100
- 84,454 · -39.1%
Race, ethnicity, and origin ACS 2023
- Neighborhood character
- Predominantly White (76%)
- Race & ethnicity
- White 76% Hispanic / Latino 13% Two or more races 13%
- Hispanic origin (detail)
- Puerto Rican 6% Cuban 1%
- Common ancestry
- Italian 2% Romanian 2% Lithuanian 1%
- Foreign-born
- 9% · Canada
- Languages at home
- 90% English-only · Spanish 9% Other Indo-European 1%
Political lean MEDSL · Citrus
- 2024 margin
- Solid R (+45.9) · D 26.8% · R 72.6%
- 2008→2024 swing
- -29.8pp toward R · 2008: -16.1pp · 2024: -45.9pp
- All cycles
- 2024: R+45.9 2020: R+41.0 2016: R+39.7 2012: R+21.9 2008: R+16.1
Not yet ingested
- Civics
- —
Market trends
- HPI YoY
- ▼ -6.35%
- Current HPI
- 340.9844
- Rent YoY
- —
- Metro
- —
- State GDP YoY
- ▲ 3.28%
- F500 in state
- 36
Industry mix (Fortune 500 HQ in FL)
| Industry | F500 HQs | Revenue |
|---|---|---|
| Industrial Technology | 2 | $29B |
|
||
| Insurance | 2 | $17B |
|
||
| Retail | 1 | $60B |
|
||
| Technology Distribution | 1 | $58B |
|
||
| Homebuilding | 1 | $35B |
|
||
| Technology Manufacturing | 1 | $35B |
|
||
Price history
+141.1% since first listed8 events — show timeline
- 2026-05-08 Price Changed $199,900 Stellar MLS as Distributed by MLS Grid
- 2026-05-08 Listed $189,900 Stellar MLS as Distributed by MLS Grid
- 2026-04-12 Price Changed $199,900 RACC
- 2026-03-14 Price Changed $204,900 RACC
- 2026-02-23 Price Changed $214,900 RACC
- 2010-10-26 Sold (Public Records) $76,500 Public Records
- 2005-07-06 Sold (Public Records) $79,500 Public Records
- 1999-08-30 Sold (Public Records) $82,900 Public Records
Property tax history
+20.1%/yrLatest (2025): $3,714 · +704.0% YoY. Source: county tax records.
Cash-flow waterfall
monthlySold comps — $/sqft
last 12 mo · ≤1 miLoading sold comps…