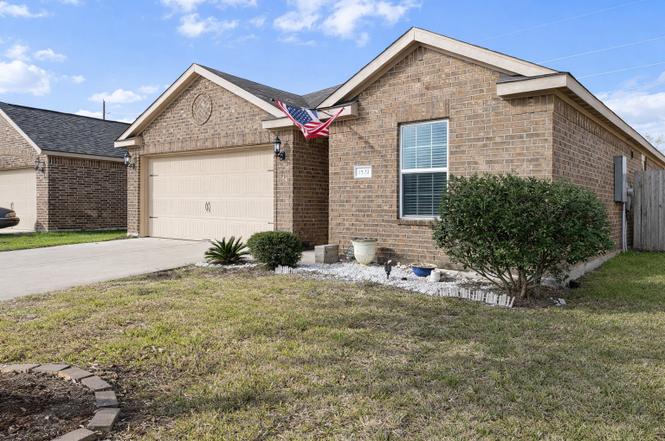
1527 Loose Stone Dr · Iowa Colony, TX
Flood risk 1/10 · Minimal
- FEMA flood zone
- X (unshaded)
- Chance of flooding over 30 yrs
- 0.0%
- Est. flood insurance / yr
- $507 – $1,088
Fire risk 6/10 · Moderate
- Est. fire insurance / yr
- $1,222 – $2,270
Heat risk 9/10 · Severe
- Hot days now (above 110°F)
- 7 days/yr
- Hot days in 30 yrs
- 23 days/yr
Wind risk 9/10 · Severe
- Chance of severe wind over 30 yrs
- 99.0%
Air-quality risk 2/10 · Minimal
- Unhealthy air days now
- 1 days/yr
- Unhealthy air days in 30 yrs
- 2 days/yr
Risk factors via First Street. Map © Google.
Why this score? — see what drove the C grade
The composite is a weighted blend of 9 inputs, each scored 0–100. Each bar is that input's sub-score; the figure is the points it added to the 100-point composite (weight × sub-score).
- Cash flow +16.7/30.0
- ARV discount +15.0/15.0
- 1% rule +7.0/10.0
- DSCR +5.2/10.0
- Schools +3.9/10.0
- Livability +3.2/5.0
- Rent growth +2.6/5.0
- Condition / age +2.5/5.0
- Appreciation +0.0/10.0
$209,900
🖨 Deal sheet 📄 Offer letter ✓ Due diligence
Listing remarks
This home is designed for easy, low-maintenance living. With two additional well-sized bedrooms, there is plenty of space for a home office, a guest suite. The attached two-car garage and dedicated laundry room add to the functional appeal of this move-in-ready gem.
Key facts
- 5,488 sq ft lot
- 2 garage spots
- Built 2016
Property features AI
Finance
- Other: Living area approximately 1,393
- HOA & community: Part of Sterling Lakes association; Association offers controlled access and gated amenities; Annual association fee of $1,400
Exterior
- Parking: Attached 2-car garage
- Security: Gated community access
- Utilities: Public water; Public sewer
- Home design: Residential property; Single-story entry (all main rooms on first floor)
- Construction: Brick construction; Built in 2016; Composition roof; Slab foundation
- Exterior features: Subdivision lot; Concrete road surface; Security gate
Interior
- Kitchen: Dishwasher; Electric oven; Electric range; Garbage disposal; Microwave
- Bedrooms: Three bedrooms total — two additional bedrooms (11x11) and a primary bedroom (13x12), all on the first floor
- Flooring: Laminate flooring
- Bathrooms: Two full bathrooms
- Heating & cooling: Central heating (electric); Central air (electric)
- Interior features: Granite counters
Neighborhood map
What this means for you Summary
Snapshot
- This is a 3-bed/2.0-bath single-family listed at $210k.
Deal economics
- At list price, monthly cash flow is $132 ($2k/yr) — positive.
- The deal already cash-flows at list — no discount required.
- Meets the 1% rule at list price ($3k rent vs $210k).
- Recommended offer: $191k (9.0% below list) — sets the bar for market timing.
- Cap rate 7.0% vs local median 4.2% in Iowa Colony — top-decile yield for the area; either an underpriced asset or a hidden risk that comps aren't pricing in. Stress-test before assuming the spread holds.
Location & tenants
- Location reads 64/100 on livability (#757 in TX) — a middle-class / working-renter tenant base. Strengths: crime A+, employment A+, cost of living A+; Watch: amenities F, commute F, health & safety F.
- Alvin ISD (suburban): math 39% / reading 48% proficiency, ranked #255 of 826 in TX (top 31%) — families likely to look elsewhere, expect single-tenant / working-renter base with shorter leases.
- Zoned schools: Iowa Colony H S (792 students, 56% FRL).
- Market conditions: Rents flat; 1139 active listings in the ZIP; 19 comparable units currently listed for rent nearby; rentals at typical pace (median 20d on market — plan ~3-4 weeks tenant-placement turnaround); high-income renter base; 3,960 units permitted in Brazoria County in 2024 (593 in 5+ unit buildings).
Forward outlook
- Local home prices are declining (-3.0%/yr); year-one equity from $1k of loan paydown is wiped out by about $6k of value loss. Plan a longer hold.
- Brazoria County population projected at +44% by 2050 — long-run rental-demand tailwind backs the buy-and-hold thesis.
Negotiation context
- It's been on market 112 days — a 9% lower offer ($191k) is reasonable based on typical stale-listing flexibility.
- 2 sale attempts; this cycle's ask has dropped $15k (7%) from the opening price — seller is motivated, your offer sets the floor, not the list.
Risks & watch-outs
- Watch-outs: property tax is 3.1% of price.
- Climate carrying-cost: severe wind risk, 99% chance of damaging wind over 30y; major wildfire risk; extreme-heat days projected 7→23/yr by 2055 (HVAC capex compounding) — expect insurance premiums to compound above CPI over the hold.
Questions for the listing agent
- It's been on market 112 days. Have you received any prior offers? Is the seller open to a 9% concession, seller financing, or rate buy-down credit?
- Property tax is high relative to price — has the assessment been appealed recently, and will the sale trigger a re-assessment?
- What does the HOA fee cover, when was the last increase, and are there any pending special assessments or reserve-fund shortfalls?
- Why hasn't it sold? Are there any deal-killer items the seller is aware of (foundation, flood, title, zoning, code violations)?
- Is there a deadline driving the sale (1031 exchange, divorce, estate, relocation)? That informs how much negotiation room exists.
- Schools are F-rated, which usually means shorter tenancies and higher turnover. Who's the typical renter profile here, and what's been the actual vacancy rate?
- What's the average days-on-market for RENTAL listings here right now (not sales)? A rising rental-DOM trend means longer vacancies and softer asking-rent achievability than the comps imply.
- What's the recent tenant-quality profile in this submarket — average credit score on applications, eviction rate, late-payment / NSF rate, and stable-employment percentage? A property-management company in the area should have these aggregated.
- How much new for-sale + rental construction is in the pipeline within 1–3 miles? Heavy new supply typically softens prices + rents 12–24 months out; constrained supply supports both.
Investment metrics
- 1% rule
- 1.20% ✓
- Cap rate
- 7.05%
- Cash-on-cash
- 2.70%
- DSCR
- 1.12
- GRM
- 7.0
CMA / ARV
- ARV (on-the-fly)
- $261,884
- Comps found
- 12
Show comp detail 12 sales within ~0.75 mi
| Address | Dist | Beds/Ba | Sqft | Sold | Price | $/sf | Match |
|---|---|---|---|---|---|---|---|
| 9438 Gold Mountain Dr | 0.12mi | 3/2.0 | 1,393 (0%) | 1mo | $229,000 | $164 | 94 |
| 1802 Opal Peach Dr | 0.29mi | 3/2.0 | 1,393 (0%) | 2mo | $240,000 | $172 | 85 |
| 1827 Garnet Breeze Dr | 0.31mi | 3/2.0 | 1,393 (0%) | 2mo | $235,000 | $169 | 84 |
| 9115 Serene Hvn | 0.36mi | 3/2.0 | 1,412 (+1%) | 2mo | $296,490 | $210 | 80 |
| 9011 Serene Hvn | 0.40mi | 3/2.0 | 1,412 (+1%) | 1mo | $288,490 | $204 | 78 |
| 1306 Paradise Found Dr | 0.46mi | 3/2.0 | 1,393 (0%) | 2mo | $239,000 | $172 | 77 |
| 9919 Opal Rock Dr | 0.67mi | 3/2.0 | 1,393 (0%) | 2mo | $239,999 | $172 | 67 |
| 1511 Shimmering Ocean Way | 0.42mi | 3/2.0 | 1,595 (+14%) | 1mo | $299,990 | $188 | 56 |
| 1202 Paradise Found Dr | 0.52mi | 3/2.0 | 1,581 (+14%) | 1mo | $265,000 | $168 | 53 |
| 9015 Rose Water Trl | 0.48mi | 3/2.0 | 1,595 (+14%) | 1mo | $309,490 | $194 | 52 |
| 1222 Sandy Shore Ln | 0.51mi | 3/2.0 | 1,595 (+14%) | 2mo | $309,990 | $194 | 51 |
| 9118 Sunset Marina Way | 0.51mi | 3/2.0 | 1,595 (+14%) | 3mo | $309,490 | $194 | 50 |
Match score weights: distance 35% · size 25% · config 20% · recency 20%. Top-matched comps best support the ARV.
Projected returns pro-forma
-3.0% appreciation · 0.44% rent growth · sell at horizon
- IRR
- -15.6%
- Equity multiple
- 0.46×
- Total profit
- $-31,618
- Equity at exit
- $31,297
- IRR
- -13.7%
- Equity multiple
- 0.32×
- Total profit
- $-40,143
- Equity at exit
- $18,148
Cash invested: $58,772 (down + closing). Projections, not guarantees.
Landlord ↔ Tenant lean methodology
- Overall (STATE)
- 87 Strongly Landlord-Friendly
- State Texas
- 87 Strongly Landlord-Friendly · R+5
- County
- — inherits STATE
- City
- — inherits STATE
ZIP-level market 77583
- Rents YoY
- 0.4%
- Active inventory
- 1139
- Price-to-rent
- 7.0×
Monthly cashflow live
- Estimated rent
- $2,515 high interval (Pro) →
- Mortgage (P&I)
- −$1,101
- Tax from tax record
- −$549 /mo · $6,589/yr
- Insurance
- −$87
- HOA
- −$117
- Vacancy / Maint / Mgmt
- −$528
- Net cashflow
- $132
Break-even live
UW: 25.0% down · 7.5% · 30yr · 1.5% tax · 5.0% vac · 8.0% maint · 8.0% mgmt
Financing live
Cash to close
- Down payment
- $52,475
- Closing costs
- $6,297
- Reserves months
- —
- Total cash needed
- —
Loan-product check · same deal, 3 products live
Conventional
25% down · 7.5% · 30yr
- Down + closing
- —
- Monthly P&I
- —
- Monthly cashflow
- —
- DSCR
- —
- Eligible?
- —
Personal DTI + credit; lowest rate.
DSCR
20% down · 8.5% · 30yr
- Down + closing
- —
- Monthly P&I
- —
- Monthly cashflow
- —
- DSCR
- —
- Eligible?
- —
No personal income docs; deal must DSCR.
Hard money
10% down · 12.0% · 12mo
- Down + closing
- —
- Monthly P&I
- —
- Monthly cashflow
- —
- DSCR
- —
- Eligible?
- —
Short-term bridge; refi at stabilization.
Rent comps 19 comps
| Address | Beds | Baths | Sqft | Rent | $/sqft | DOM | Units | Dist |
|---|---|---|---|---|---|---|---|---|
| 1123 Diamond Drape Dr Rosharon, TX | 4.0 | 2.0 | 1844 | $2,000 | $1.08 | 12d | 1 | 0.33mi |
| 9518 Peridot Green Dr Rosharon, TX | 4.0 | 2.0 | 1593 | $1,886 | $1.18 | 22d | 1 | 0.78mi |
| 10313 Malta Trace Dr Rosharon, TX | 4.0 | 2.0 | 1802 | $2,545 | $1.41 | 43d | 1 | 0.88mi |
| 1816 Corsica Creek Ln Rosharon, TX | 3.0–4.0 | 2.0–2.5 | 1653 | $2,306 | $1.40 | 1d | 21 | 0.94mi |
| 10211 Alpine Lake Ln Rosharon, TX | 3.0–4.0 | 2.0–2.5 | 1731 | $2,700 | $1.56 | 1d | 6 | 1.07mi |
| 10211 Alpine Lake Ln Rosharon, TX | 3.0–4.0 | 2.0–2.5 | 1731 | $2,469 | $1.43 | 43d | 7 | 1.07mi |
| 10610 Cascade Creek Dr Rosharon, TX | 3.0 | 2.0 | 1548 | $2,700 | $1.74 | 43d | 1 | 1.11mi |
| 10502 Moon Valley Ln Rosharon, TX | 3.0 | 2.0 | 1615 | $2,725 | $1.69 | 1d | 1 | 1.12mi |
| 10507 Moon Valley Ln Rosharon, TX | 3.0 | 2.0 | 1548 | $2,650 | $1.71 | 1d | 1 | 1.12mi |
| 10622 Cascade Creek Dr Rosharon, TX | 4.0 | 2.0 | 1780 | $2,775 | $1.56 | 43d | 1 | 1.14mi |
| 2510 Green Jasper Dr Rosharon, TX | 3.0 | 2.0 | 1561 | $2,375 | $1.52 | 43d | 1 | 1.17mi |
| 10538 Wildflower View Dr Rosharon, TX | 3.0 | 2.0 | 1522 | $2,775 | $1.82 | 1d | 1 | 1.21mi |
| 10602 Wildflower View Dr Rosharon, TX | 4.0 | 2.0 | 1596 | $2,850 | $1.79 | 20d | 1 | 1.23mi |
| 1234 Scarlet Creek Dr Rosharon, TX | 3.0 | 2.0 | 1548 | $2,650 | $1.71 | 1d | 1 | 1.24mi |
| 8219 House Dr Rosharon, TX | 3.0 | 2.0 | 1263 | $1,970 | $1.56 | 22d | 1 | 1.30mi |
| 2523 Topaz Hill Ln Rosharon, TX | 3.0–4.0 | 2.0–2.5 | 1857 | $2,425 | $1.31 | 16d | 1 | 1.32mi |
| 8102 Buck Ln Rosharon, TX | 3.0 | 2.0 | 1409 | $2,100 | $1.49 | 43d | 1 | 1.41mi |
| 8310 Rose Petals Ln Rosharon, TX | 4.0 | 2.0 | 1833 | $2,300 | $1.25 | 43d | 1 | 1.41mi |
| 10203 Karsten Blvd Rosharon, TX | 1.0–2.0 | 1.0–2.0 | 935 | $2,061 | $2.20 | 1d | 138 | 1.43mi |
HOA detail
- Monthly dues
- $117 · $1,404/yr
Listing history 8 events
-
2026-04-29status Pending
-
2026-04-15price $209,900
-
2026-04-01status Active
-
2026-04-01status Pending
-
2026-03-20status Pending
-
2026-03-17price $214,900
-
2026-01-05$225,000 Active
-
2025-12-29soldstatus
ⓘ Source: listings_history table (triggers on properties + properties_extension) + one-shot
backfill from property_details.listing_events for pre-trigger history.
Tax reassessment forecast TX · Resets to sale price
- Current annual tax
- $6,589 · $549/mo
- Projected year-2 tax
- $6,589 · $549/mo
- Expected delta
- $0/yr ($0/mo · -0.0%)
ⓘ Screening estimate from a state-policy table — verify with the county assessor before closing.
Climate risk First Street
- Flood 1/10 Low FEMA zone X (unshaded) · 0% chance over 30 yrs
- Wildfire 6/10 Major
- Heat 9/10 Extreme 7 d/yr ≥110°F today · 23 d/yr by 30 yrs out
- Wind 9/10 Extreme 99% chance of damaging wind over 30 yrs
- Air quality 2/10 Low 1 unhealthy d/yr today · 2 by 30 yrs out
Nearby sold comps map
Loading sold comps map…
Walkable amenities ~0.75 mi
Loading nearby amenities…
Taxation est. · year 1
- Rental income
- $30,175
- − Mortgage interest
- −$11,758
- − Property taxes
- −$6,589
- − Insurance
- −$1,050
- − Repairs & maintenance
- −$2,414
- − Management
- −$2,414
- − HOA
- −$1,404
- − Depreciation
- −$6,106
- Taxable loss
- −$1,559
- Est. tax savings @ 24.0%
- +$374
- After-tax cash flow
- $1,961/yr
For passive investors: Depreciation is non-cash, so a rental often shows a tax loss while cash-flowing — sheltering income. Rental losses are passive: they offset passive income freely, and up to $25,000/yr can offset ordinary (W-2) income if you actively participate and your MAGI is under $100k (phasing out to $0 by $150k); unused losses carry forward. On sale, claimed depreciation is recaptured at up to 25%, and gains may owe capital-gains tax (a 1031 exchange can defer both). Figures are a year-1 estimate at your 24.0% rate — not tax advice; consult a CPA.
Schools (NCES district)
- District
- Alvin ISD
- NCES district ID
- 4808090
- Math proficiency
- 39% ▼ -11.00%
- Reading proficiency
- 48% ▬ 0.00%
- Median HH income
- $66,740
- Composite
- 38.96/100
- National rank
- #4080
- State rank
- #255 of 826 in TX
Livability — Iowa Colony
- Score
- 64/100
- State rank
- #757
- US rank
- #13904
Category grades
Schools grade is shown separately in the Schools card above.
Census & demographics
- Census place
- Iowa Colony, TX
- County
- Brazoria County · 374,982 people
- City population
- 52,747
- Metro
- Houston-The Woodlands-Sugar Land, TX
- Population (ZIP)
- 52,747
- Household income
- $119,287
- Rent vs Own
- Severe rent burden
- 251.0
Population outlook (Brazoria County) Hauer SSP2
- Today (2025)
- 420,414 people
- By 2030
- 457,585 · +8.8%
- By 2040
- 532,232 · +26.6%
- By 2050
- 605,399 · +44.0%
- By 2075
- 779,358 · +85.4%
- By 2100
- 883,759 · +110.2%
Race, ethnicity, and origin ACS 2023
- Neighborhood character
- Highly diverse neighborhood (Simpson 0.70)
- Race & ethnicity
- Hispanic / Latino 38% Black 34% White 20% Two or more races 18% Asian 5%
- Hispanic origin (detail)
- Mexican 31% Puerto Rican 2%
- Common ancestry
- Lithuanian 1% Slovak 1% Romanian 1%
- Foreign-born
- 16% · Canada, Vietnam, China
- Languages at home
- 64% English-only · Spanish 28% Other Asian/Pacific 2% Vietnamese 1%
Political lean MEDSL · Brazoria
- 2024 margin
- R (+19.7) · D 39.5% · R 59.2% · Other 1.3%
- 2008→2024 swing
- +9.9pp toward D · 2008: -29.6pp · 2024: -19.7pp
- All cycles
- 2024: R+19.7 2020: R+18.2 2016: R+24.6 2012: R+34.2 2008: R+29.6
Not yet ingested
- Civics
- —
Market trends
- HPI YoY
- ▼ -120.19%
- Current HPI
- 198.6559
- Rent YoY
- ▲ 0.44%
- Metro
- Houston-The Woodlands-Sugar Land, TX
- State GDP YoY
- ▲ 3.95%
- F500 in state
- 110
Industry mix (Fortune 500 HQ in TX)
| Industry | F500 HQs | Revenue |
|---|---|---|
| Energy | 16 | $1,198B |
|
||
| Technology | 5 | $198B |
|
||
| Engineering / Construction | 4 | $72B |
|
||
| Energy Services | 3 | $60B |
|
||
| Utilities | 3 | $41B |
|
||
| Healthcare | 2 | $330B |
|
||
Price history
-6.7% since first listed8 events — show timeline
- 2026-04-29 Pending — HARMLS
- 2026-04-15 Price Changed $209,900 HARMLS
- 2026-04-01 Relisted — HARMLS
- 2026-04-01 Pending — HARMLS
- 2026-03-20 Pending — HARMLS
- 2026-03-17 Price Changed $214,900 HARMLS
- 2026-01-05 Listed $225,000 HARMLS
- 2025-12-29 Sold (Public Records) — Public Records
Property tax history
+1.3%/yrLatest (2025): $6,589 · -7.2% YoY. Source: county tax records.
Cash-flow waterfall
monthlySold comps — $/sqft
last 12 mo · ≤1 miLoading sold comps…